Somewhere on Telegram right now, a channel with 40,000 subscribers is posting a green screenshot and the words "94% ACCURACY". And somewhere else, a quieter trader is running a system that wins 44% of the time and compounding an account while the 94% crowd slowly bleeds out. If that sounds backwards, this article is for you.
The question underneath it all is the oldest argument in retail trading: win rate vs risk reward ratio — which matters more? Ask a beginner and they'll say win rate, obviously, because winning feels like the point. Ask anyone who has survived a few years of live trading and they'll give you a more annoying answer: neither, on its own. The number that decides whether you make money is the one almost nobody advertises, because it's harder to sell. It's called expectancy, and it's just win rate and risk-reward multiplied together in a particular way.
We run a gold signal desk, so we stare at these three numbers every day of our working lives. This piece walks through the arithmetic properly: why a high forex signal accuracy rate can be a warning sign rather than a selling point, why a mediocre-sounding win rate can be a money machine, and how you can compute any provider's real expectancy from their published history in about ten minutes. Bring a calculator. It's less painful than it sounds and it will change how you read every performance claim you see from now on.
The seductive lie of the high win rate
Win rate is the percentage of trades that close in profit. That's it. It says nothing about how much you win when you win, or how much you lose when you lose, which means it says almost nothing about whether you make money. And yet it dominates signal marketing so completely that most buyers never ask a second question.
There's a reason for that, and it's not a technical one. It's psychological. Humans experience each trade as a small verdict on themselves. A win feels like being right; a loss feels like being wrong, or worse, being stupid. A service that hands you nine little verdicts of "you were right" for every one of "you were wrong" feels wonderful to use, day to day, in a way that has nothing to do with your account balance. Signal sellers know this. Win rate is the metric of feelings, and feelings are what actually convert on a sales page.
Here's the mechanical problem. I can build you a 90% win rate system in the next thirty seconds. Take any market, gold included: buy at market, set a take profit 20 cents away, set a stop loss $20 away. Price wobbles 20 cents constantly, so you'll hit the TP the overwhelming majority of the time. You will bank tiny win after tiny win after tiny win, your history will glow green, and then one afternoon a US inflation print will land, gold will move $25 in forty minutes, and your single loss will erase months of profit and then some. You did nothing wrong by the system's rules. The system was designed to lose; it just scheduled the losing for later.
That structure, many small wins funding one catastrophic loss, is not a rare pathology. It is the default shape of most high-accuracy signal services, because a fat advertised win rate and a starved risk-reward ratio are two sides of the same coin. Stretch one and you compress the other. Anyone quoting you 90%+ accuracy without also quoting average win size against average loss size is either hiding the second number or has never calculated it. Neither option should get your money.
Win rate vs risk reward ratio: which matters more?
Let's define the second contender properly. Risk-reward ratio (R:R) is how much a trade stands to make relative to how much it risks. Risk $10 to make $20 and you're trading at 1:2, or "2R" in the shorthand most traders use. Risk $10 to make $5 and you're at 0.5R. On a gold trade, if your entry is 3,340 with a stop at 3,332 and a take profit at 3,356, you're risking $8 of movement to capture $16. That's a 2R setup regardless of your lot size, which is a separate decision entirely (and one we've covered in depth in our lot size guide, because getting R right and then sizing it wrong is its own classic way to blow up).
So which number matters more? Here is the honest answer, and it's the whole thesis of this article: the question is malformed. Win rate and risk-reward are not competitors. They are two inputs into a single output, and the output is the only thing that pays your bills. Asking which matters more is like asking whether the length or the width of a rectangle matters more to its area. Shrink either one far enough and the area goes to nothing, no matter how impressive the other looks.
But if you force the question, if you make me pick which number I'd rather see inflated on a provider's sales page, I'll take risk-reward every time, for one practical reason. Win rate is trivially easy to manipulate and R:R is not. A provider can juice their accuracy overnight by widening stops and shrinking targets, and the history will look better while the economics get worse. To improve average R:R, though, you have to genuinely pick better entries, place stops where the trade idea is actually invalidated, and let winners run to targets that mean something. One of these can be faked with a settings change. The other has to be earned.
The refusal to pick a winner isn't a dodge. It's the setup for the formula that actually settles the argument, so let's do that now.
Expectancy: the one formula that decides everything
Expectancy is the average amount you make or lose per trade, over a large number of trades. In the cleanest form, measured in R (multiples of your risk per trade):
Expectancy = (Win rate × Average win in R) − (Loss rate × Average loss in R)
If you risk 1R on every trade and your stop losses are honoured, average loss is simply 1. So the formula collapses to something you can do on a napkin. Take a system that wins 45% of the time with an average winner of 2R:
(0.45 × 2) − (0.55 × 1) = 0.90 − 0.55 = +0.35R per trade
Every trade this system takes is worth, on average, 35% of whatever you risked. Risk $30 a trade on a $3,000 account and you're earning an expected $10.50 per signal, win or lose, before spread and slippage. Over 200 trades a year that's a serious return on a small account, achieved while losing more often than winning.
Now the crowd favourite. A system that wins 90% of the time, but with the tight-target, wide-stop structure that usually produces such numbers, say average winner 0.2R against average loser of 1R:
(0.90 × 0.2) − (0.10 × 1) = 0.18 − 0.10 = +0.08R per trade
Still positive, barely. But notice what it's balanced on. That +0.08R assumes the average loss really is 1R, and in high-win-rate systems it rarely is, because the same psychology that builds these systems also moves stops when price approaches them. Let the average loss drift from 1R to 2.5R, which one gapped news candle on gold can do to a wide stop all by itself, and the sum becomes 0.18 − 0.25 = −0.07R. The 90% system is now a slow-motion account shredder with a beautiful track record.
Win rate tells you how often you'll feel good. Expectancy tells you whether you'll get paid. The entire signal industry is built on hoping you never learn the difference.
This is what "expectancy trading" means when traders use the phrase: judging systems, providers and your own performance by expected value per trade rather than by how often the outcome is green. It's the only frame in which win rate and risk-reward stop fighting and start meaning something.
The table that ends the argument
Words are one thing. Here is the actual grid. Each cell is expectancy per trade, assuming a clean 1R loss on every loser.
| Win rate | 0.3R avg win | 0.5R avg win | 1R avg win | 2R avg win | 3R avg win |
|---|---|---|---|---|---|
| 30% | −0.61R | −0.55R | −0.40R | −0.10R | +0.20R |
| 40% | −0.48R | −0.40R | −0.20R | +0.20R | +0.60R |
| 45% | −0.42R | −0.33R | −0.10R | +0.35R | +0.80R |
| 55% | −0.29R | −0.18R | +0.10R | +0.65R | +1.20R |
| 70% | −0.09R | +0.05R | +0.40R | +1.10R | +1.80R |
| 85% | +0.11R | +0.28R | +0.70R | +1.55R | +2.40R |
| 90% | +0.17R | +0.35R | +0.80R | +1.70R | +2.60R |
Sit with this table for a minute, because a few things jump out.
First, look at 45% win rate with 2R winners: +0.35R. Now look at 85% with 0.3R winners: +0.11R. The system that loses more than half its trades earns three times as much per trade as the one that wins six trades in seven. If you've been choosing providers by their forex signal accuracy rate, this row comparison is the whole article in two cells.
Second, the entire left side of the table is red. No win rate below 70% survives an average winner of half an R or less. This is where most retail traders actually live, by the way: decent-ish entries, panic exits that cut winners to 0.4R, full 1R losses. The maths never had a chance.
Third, and this is the part the table can't show: the cells are not equally stable. The bottom-right region (high win rate, high R) essentially doesn't exist in liquid markets over meaningful sample sizes; if gold gave up 3R winners 90% of the time, the edge would be arbitraged to dust within weeks. And the top-right high-win-rate column entries degrade fast the moment average losses exceed 1R, which in practice they do. The realistic, sustainable, reachable zone for a discretionary or signal-based approach is the band running through the middle: roughly 40-60% win rates paired with 1.5R to 2.5R average winners. Boring. Durable. Profitable.
Why 90% win-rate systems still blow up accounts
Suppose a high-accuracy system genuinely is positive expectancy, a real +0.08R per trade like our earlier example. Can't you just trade it and collect? In theory. In practice, three separate mechanisms conspire to kill it, and it's worth understanding each one because you will meet them all.
The first is sample size and the geometry of rare losses. A system that loses 10% of the time can easily run 40, 50, 60 trades without a loss. The trader watching it concludes the loss basically never happens, and starts sizing accordingly, risking 3%, then 5%, then "it hasn't lost in three months" percent. When the 1-in-10 event finally arrives, and on gold it tends to arrive attached to an FOMC statement or a geopolitical headline, it lands on the biggest position the account has ever held. The maths was fine. The human wasn't.
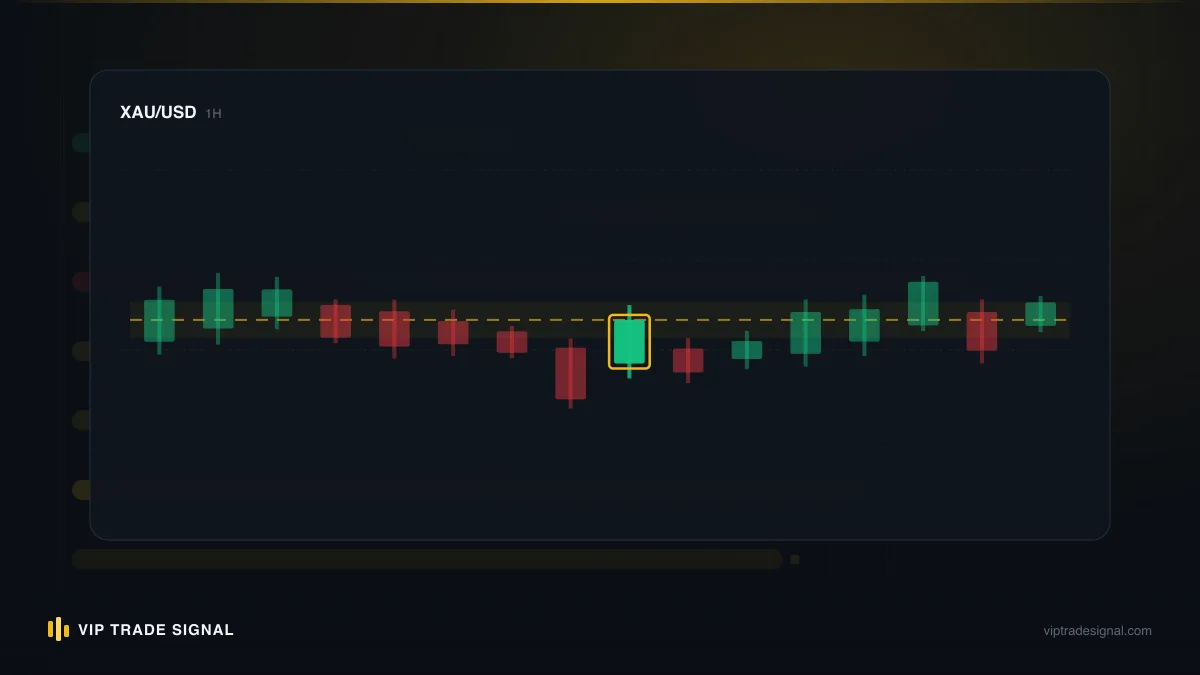
The second mechanism is the fragility of the loss side. That expectancy calculation assumed the average loss stays at 1R. High win-rate structures have wide stops by construction, and wide stops invite two behaviours: moving them wider under pressure ("it always comes back"), and catastrophic slippage when a fast market blows through them. On XAU/USD, a stop resting $18 from entry during a quiet Asian session is a different animal from the same stop during the London-New York overlap with a data release pending. The advertised R was never the real R.
The third is cost drag, which nobody includes in their screenshots. A 0.2R take profit on gold might be 60-80 cents of movement. Spread and commission on a typical retail account might eat 25-35 of those cents. Your true average win just fell by a third, and the expectancy that looked like +0.08R is now underwater before any behavioural failure occurs at all. Fat-target systems suffer cost drag too, but as a small tax rather than a decapitation: 30 cents off a $16 target is noise.
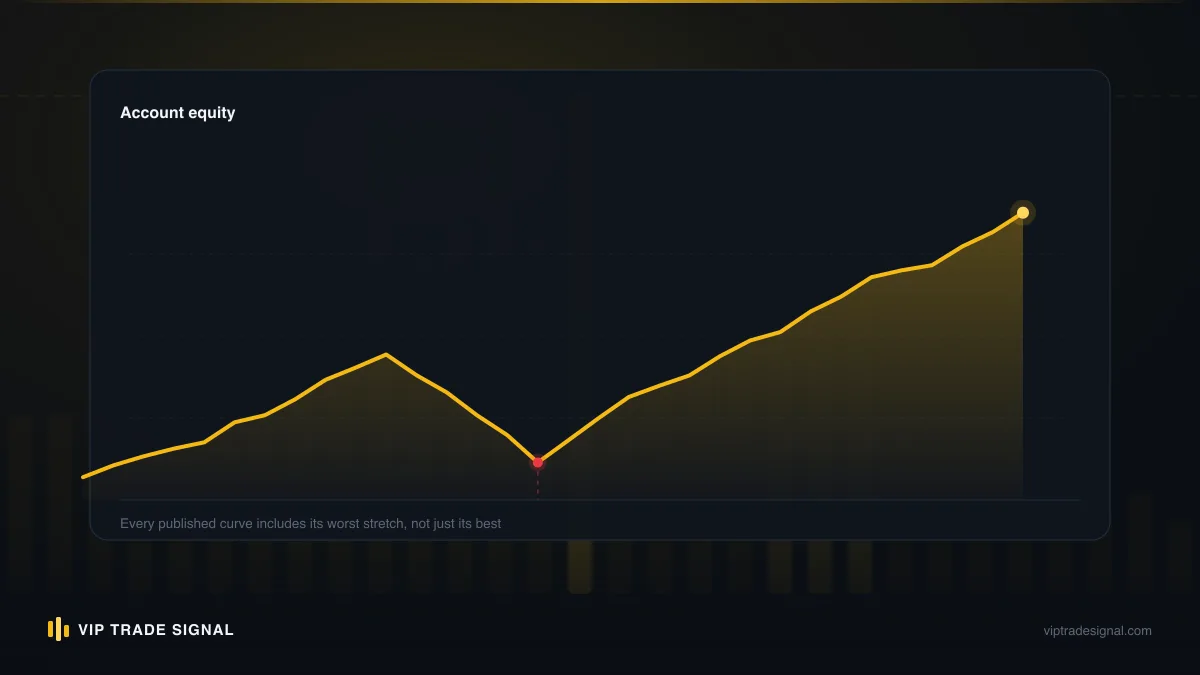
Put the three together and you get the classic equity curve of the high win-rate account: a long, smooth, seductive staircase up, then a cliff. We've reviewed hundreds of these histories from traders who came to us after the cliff. The staircase is always beautiful. That's rather the problem.
The martingale trap behind the prettiest track records
There's a darker version of the high win rate story that deserves its own section, because it's rampant in the signal world: the win rate that is manufactured rather than merely fragile.
Martingale, and its politer cousins "recovery trading", "grid" and "averaging down", is any scheme where losing positions are answered with bigger positions in the same direction, so that a small reversal makes the whole cluster whole. Textbook example on gold: buy 0.10 lots at 3,350. Price drops to 3,340; buy 0.20 more. Drops to 3,330; buy 0.40. Now a bounce to just 3,338 puts the entire stack in profit and everything closes green. One trade in the history. A win.
Do you see what that structure does to reported statistics? Every survivable drawdown gets converted into a recorded win. The only trades that ever show as losses are the ones where the market refused to bounce before the margin ran out, at which point the loss isn't 1R or 3R, it's the account. A martingale system's track record is a sequence of wins punctuated by extinction events, and if the extinction hasn't happened yet, the record is literally flawless. 100% win rate, right up until the number that matters most, the account balance, goes to zero.
This is why "what is a good win rate for forex signals" is almost the wrong question, and why we'd treat any figure above roughly 85%, sustained over hundreds of trades, as a red flag demanding explanation rather than a selling point. The explanation is occasionally genuine (very tight scalping in specific sessions can run hot for a while). Far more often it's averaging-down with hidden risk, cherry-picked trade windows, or a demo account. Ask one question of any glossy track record: what was the maximum floating drawdown behind these closed results? A martingale operator either won't answer or won't answer honestly, because the floating drawdown is where the bodies are buried. An honest provider will tell you, because honest results have losses sitting right there in the open.
Real trades, incidentally, have one entry, one stop, and defined targets. If a provider's "one signal" involves five averaged entries and no stop, you're not looking at a signal service. You're looking at a countdown.
What good actually looks like
Enough autopsy. What combinations should you expect from a legitimate, sustainable approach, whether it's your own trading or signals you follow?
For an intraday-to-swing approach on gold, the honest ranges look something like this:
- Win rate between 40% and 65%. Below 40% is tradeable in theory (trend-following funds live there) but brutal to follow psychologically as a signal subscriber; you'll quit during a normal losing streak. Above 70%, sustained, start asking the hard questions from the last section.
- Average winner between 1.2R and 2.5R. This is where stops sit at genuine invalidation points and targets sit at genuine structure, the way we've laid out in our XAU/USD strategy guide, rather than both being reverse-engineered to flatter a statistic.
- Expectancy between +0.15R and +0.45R per trade. This sounds humble next to marketing claims. Compounded across 15-25 signals a month with 1% risk per trade, it is anything but.
- Losing streaks of 5-8 trades occurring regularly, and survivable without drama. A 50% win rate produces a streak of seven losses about once every 200 trades. That's not the system breaking. That's the system.
Notice how unsexy those numbers are. Nobody builds a sales funnel around "45-55% win rate, roughly 1.8R average winner, expect losing weeks." But run the expectancy on it: (0.50 × 1.8) − (0.50 × 1) = +0.40R per trade. At 1% risk, that's roughly 0.4% of account growth per signal on average, delivered in lumpy, uncomfortable, real-world fashion, with drawdowns you can actually live through. We'd take that over the 94% screenshot every single time, and after enough years around this industry, so would every trader we respect.
One more marker of "good": the numbers are computed over a real sample. Twenty trades tells you nearly nothing; the difference between a 45% and 55% win rate doesn't reliably show up until well past a hundred trades. Any performance claim resting on a month of history is weather, not climate.
Computing a provider's expectancy from their history
Here's where this stops being theory and becomes a weapon. You can compute the true expectancy of any signal provider who publishes full results, and the calculation requires nothing beyond secondary-school arithmetic. The fact that so few subscribers ever do it is the entire reason bad providers survive.
You need their complete closed-trade history, every trade, wins and losses, with entry, stop loss, and exit price for each. Right away this filters the industry, because most providers publish highlights, not history. If you can't get the full record, including losers, stop here; there is nothing to audit and that is itself your answer. (It's exactly why we publish every closed signal at /signals/history, losses included and left there permanently. Not out of saintliness. Because a track record that can't be audited is worth nothing, including ours.)
With the history in hand, the procedure:
- Convert every trade to R. For each trade, the risk is the distance from entry to stop loss. The result is the distance from entry to exit, divided by that risk. A gold long entered at 3,320 with a stop at 3,312 (risk: $8) that closed at 3,336 made $16, so it scored +2.0R. If it stopped out at 3,312, that's −1.0R. If it was closed early at 3,326, +0.75R.
- Flag the anomalies. Any loss materially worse than −1.0R means slippage or a moved stop; note how many there are. Any trade with no published stop gets scored as suspect, not skipped, and enough of them invalidates the whole audit.
- Compute the four numbers. Win rate (winners ÷ total), average winning R, average losing R (as a positive number), and then expectancy: (win rate × avg win) − (loss rate × avg loss).
- Subtract costs. Knock 0.03-0.05R off the expectancy per trade for spread and slippage on gold if the provider's results are quoted at raw prices. Painful, but honest.
What you're left with is the one number their marketing never mentioned. If it's positive after costs across 100+ trades, you've found something rare. If it's negative while their homepage advertises 90% accuracy, you've just saved yourself a subscription fee and probably a chunk of your account. Either way, ten minutes well spent.
How TP ladders complicate both numbers
If you've followed gold signals anywhere, you'll have met the multi-target format: one entry, one stop, and then TP1, TP2, TP3 stacked above it. Ours look like that too. It's a sensible format, but you should understand that it quietly muddies both win rate and risk-reward, and dishonest providers exploit the mud.
Take a typical laddered gold signal: buy 3,335, SL 3,327, TP1 3,343, TP2 3,351, TP3 3,367. That's +1R, +2R and +4R targets. Now suppose price hits TP1 and reverses to the stop. Was that trade a win? The provider will count it as one; TP1 was hit, screenshot posted, "✅ TP1" in the channel. But what did a subscriber actually make? If they closed a third of the position at TP1 and the rest stopped out at breakeven (assuming the stop was moved), somewhere around +0.33R. If the stop wasn't moved, roughly +0.33R − 0.67R = −0.33R. A recorded "win" that lost money. Multiply that accounting across a year and a channel can honestly-ish claim an 80% win rate while its subscribers' accounts shrink.
The fix isn't to abandon TP ladders. Partial exits are legitimately useful: they pay the psychological toll that lets people hold runners, and they acknowledge that nobody knows in advance whether a move will travel $8 or $40. The fix is to audit laddered signals in weighted R. Decide a fixed convention, say a third of the position at each TP, stop to breakeven after TP1, then score every historical signal by what that convention would have actually earned. A TP1-then-reverse trade scores +0.33R, not "win". A full ride to TP3 scores +2.33R, not "win". Suddenly wins have sizes, which is the entire point.
When you run this weighted audit on a provider, watch what happens to the gap between their claimed accuracy and the weighted expectancy. A small gap means their counting is merely optimistic. A chasm means the "win rate" was doing marketing work, not measurement work. And if you're wondering how to run this convention live on your own account, position splitting and per-leg sizing is covered in the lot size calculator guide; the maths is the same, just pointed forwards instead of backwards.
Our numbers, and why the losses stay published
Fair question at this point: fine, what about you? We're a signal service telling you signal services lie about statistics. The only credible response is to show our working rather than assert our virtue, so here is how we handle each number on our own desk.
We trade one instrument, XAU/USD, and nothing else, for reasons we've set out in our gold signals overview. Every signal we issue carries a defined entry, one stop loss, and a TP ladder, and every closed signal is posted to /signals/history with its actual outcome, including the ones that went straight to the stop. We don't quote a headline accuracy percentage in our marketing, and that is deliberate: after everything above, you can see why we think a naked win-rate claim is closer to a confession than a credential. What we want subscribers and prospects to do is exactly what this article teaches, pull the history, convert to R, and compute the expectancy themselves. If our numbers don't survive your audit, we haven't earned your $99 a month, and no adjective on a landing page should override your arithmetic.
Two honesty notes, because this is where they belong rather than in small print. First, your results following any provider, us included, will differ from the published record: your broker's spread, your execution delay, your fills on fast moves, and above all your own discipline in taking every signal at consistent risk all move the outcome, usually by more than new subscribers expect. Second, gold is a violently volatile instrument and losing streaks are a certainty, not a risk. We have had them. We will have them again. Anyone who tells you otherwise, about their service or any other, is selling the feeling from the start of this article, not a trading edge. The FAQ covers how our pricing and the free-via-partner-broker route work if you want the commercial details; none of it changes the maths.
Drawdown: the third number that binds the other two
There's a missing character in the win rate vs risk-reward story, and ignoring it is how traders with genuinely profitable systems still end up quitting. Expectancy tells you what a system earns on average. Drawdown tells you what it costs to collect.
Two systems with identical +0.30R expectancy can make wildly different demands on their operator. A 60%-win-rate version delivers its edge in frequent small deposits with shallow dips. A 35%-win-rate, 3R-winner version delivers the same long-run edge through long droughts punctuated by big paydays, and those droughts are where the arithmetic collides with the human. Ten losses in a row at 1% risk is a 9.6% drawdown. Statistically routine for the low-win-rate system. Emotionally, for most people, it's somewhere between miserable and unbearable, and the standard failure mode isn't the drawdown itself but what it provokes: doubling risk to "get it back", skipping the next three signals (one of which, by iron law, is the monster winner), or abandoning the system entirely at its statistical low point.
So when you evaluate any approach, yours or a provider's, the third question after "what's the win rate?" and "what's the average R?" is: what losing streak does this win rate make routine, and can I hold my risk steady through it? The streak maths is unforgiving. At a 45% win rate, over 300 trades you should positively expect a streak of eight or nine losses at some point. Budget for it. At 1% risk that's a survivable single-digit dip; at 5% risk it's over a third of the account gone, and almost nobody trades their system faithfully after losing a third of their account.
This is also the honest defence of moderate win rates in a signal service. Pure expectancy maximisation might favour lower win rates and fatter R, but a service is only as good as its subscribers' ability to actually follow it through the rough patches. A 45-60% win rate with 1.5-2.5R targets is, in our experience, near the outer edge of what real humans with real money follow consistently. The best system is not the one with the highest expectancy on paper. It's the highest-expectancy system you'll still be following, at full size and without improvisation, on the ninth trade of a losing streak.
Choosing a provider by expectancy, not accuracy claims
Pull the threads together and provider selection becomes almost mechanical. Not easy, but mechanical. The forex signal accuracy rate on the sales page moves to the bottom of your list, and a different hierarchy takes over.
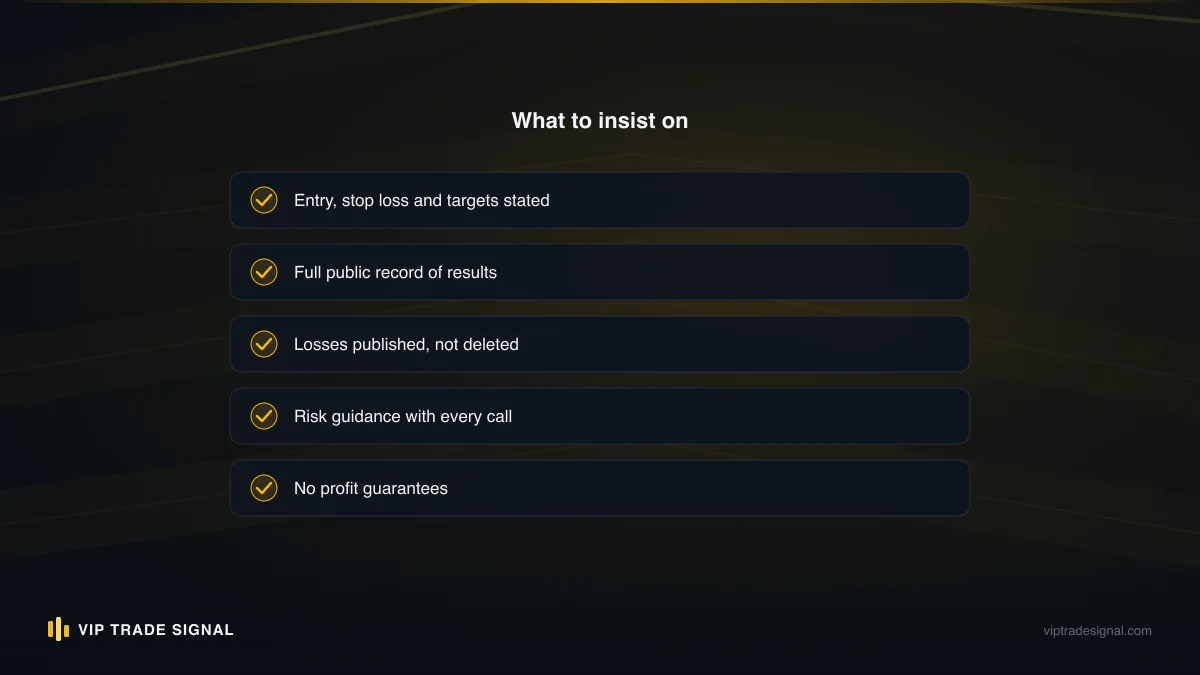
Transparency first, because it gates everything else: full closed history, permanently public, losses included, with entries and stops recorded so R can be reconstructed. No full history means no audit, and no audit means their statistics are decoration. This single filter removes most of the market, and yes, that is the point.
Then structure: one entry, a stop on every trade, no averaging into losers, no "recovery" language anywhere. A martingale track record fails the audit before you run a single number, because its win rate is an accounting artefact and its true risk lives off the books in floating drawdown.
Then the audit itself: weighted-R expectancy over at least 100 trades, computed by you, costs subtracted. Positive and stable beats large and spiky. A provider running +0.25R with a five-loss worst streak over 300 trades is a fundamentally better bet than one showing +0.60R over 40 trades, because 40 trades of anything is a coin flip wearing a suit.
And last, the fit with your own psychology and account: does the implied drawdown profile fit risk you can genuinely hold steady? Does the trade frequency fit your life and your broker's costs? A brilliant service you follow at random, skipping signals after losses, will underperform a mediocre one you follow perfectly. That's not a motivational poster. It's just what the maths does when you multiply an edge by inconsistent execution.
Run every glossy Telegram channel you know through those four gates and watch how few get past the first one. Then notice how the ones shouting loudest about accuracy are, almost without exception, the ones that fail fastest. That inverse correlation is the most reliable statistic in this entire industry.
The ten-minute expectancy audit, step by step
Let's make this concrete enough that you can do it tonight. Pick any provider with a published history, ours or anyone's, open a spreadsheet, and run this. Ten minutes for a 100-trade sample once you get moving. Maybe fifteen the first time.
- Minute 1-2: gather. Copy their last 100+ closed trades into columns: date, direction, entry, stop, exit(s). If losses are missing, or stops were never published, stop. Verdict reached early: unauditable, walk away.
- Minute 3-5: convert to R. One formula, filled down: (exit − entry) ÷ (entry − stop) for longs, flipped for shorts. For laddered exits, apply a fixed convention (thirds at each TP, breakeven stop after TP1) and score the weighted result per trade.
- Minute 6: sanity-check the losses. Count trades worse than −1.2R. A few is slippage; a pattern is moved stops. Count wins smaller than +0.3R; a wall of them means the win rate is cosmetic.
- Minute 7-8: compute. Win rate, average winning R, average losing R, then expectancy = (WR × avg win) − (LR × avg loss). Subtract 0.04R for costs. Write the final number down.
- Minute 9: stress it. Multiply expectancy by trades-per-month and by your risk per trade in pounds or dollars. Is the realistic monthly figure worth the subscription and the effort? Also check the worst streak in the sample and price the drawdown at your intended risk.
- Minute 10: decide. Positive after costs over a real sample, structure clean, drawdown survivable at your size: worth a serious look. Anything else: it doesn't matter how green the screenshots were.
The first time you run this on a channel advertising 92% accuracy and the spreadsheet quietly returns −0.11R per trade, something permanent happens to how you read trading marketing. That immunity is worth more than most subscriptions you'll ever buy.
Where this leaves you
The argument this article opened with, win rate versus risk-reward, dissolves once you've seen the machinery. Neither number matters on its own. Win rate without R is the metric of feelings; R without win rate is a lottery ticket's brochure. Expectancy, the two multiplied together and measured over a real sample with real costs, is the only figure that corresponds to money arriving in or leaving your account. And drawdown is the toll you pay to collect it, the number that decides whether you'll still be at the table when the edge pays out.
So here's the uncomfortable question to sit with: have you ever actually computed the expectancy of the way you currently trade, or the service you currently pay for? Not estimated. Computed, in a spreadsheet, from real closed trades, with the losses in. In our experience most traders never have, and most of the industry is banking on that gap staying exactly where it is.
Close the gap. Take your own last 100 trades, or any provider's, and run the ten-minute audit above. If the number that comes out is positive and the drawdown is one you can hold your risk through, you have something real; protect it with boring, consistent sizing. If the number is negative, no amount of accuracy percentage was ever going to save it, and finding that out cost you ten minutes instead of an account. Our own history is at /signals/history, every gold signal, wins and losses, exactly so you can point this arithmetic at us first. That's not confidence talking. It's just the only standard, once you understand expectancy, that any provider should be allowed to hide behind.