Most people "test" a signal provider the way they test a mattress in a showroom. They lie on it for ninety seconds, it feels fine, they buy it. Then they spend the next year wondering why their back hurts.
The showroom version, in trading terms, looks like this: join the channel, watch four or five signals, see three of them win, feel a little jolt of excitement, and go live with real money by Friday. No log. No baseline. No idea whether those three wins came from skill or from a week when gold happened to trend nicely and a coin toss would have paid too. And when the losing week arrives, as it always does, there's no way to tell whether it's a normal drawdown or the start of the truth coming out.
There is a better way, and it costs you nothing but a month of patience. Learning how to test a signal provider on a demo account properly means treating those 30 days as an experiment with rules you write down before you start, not a vibe check you score by feel at the end. This article is the whole protocol: the demo setup, the rules, the tracking sheet, the sample-size maths, the red flags that end a trial early, and how to score the month honestly when it's done. Run it once and you'll never again hand money to a provider on the strength of a screenshot.
Why demo testing beats reading reviews
Reviews of signal services are close to worthless, and it's worth being clear about why before you spend a month doing something harder.
First, the incentives are wrecked. A large slice of "review" sites earn affiliate commissions from the services they rank, which is why the same handful of providers top every list with suspiciously round scores. Second, the genuine reviews skew toward the emotional extremes: people who just had a winning fortnight and people who just blew an account. Neither tells you much about expectancy. Third, and this is the one people miss, a review can't test the thing that actually matters to you: whether the signals work with your broker, your spread, your time zone, and your ability to execute them.
A signal that wins for a reviewer in Singapore trading the London open can lose for you in Manchester if you're asleep when it posts. That's not the provider lying. It's just a fact about you that no review can capture.
A demo test fixes all three problems at once. Nobody's paying you to like the result. You're not sampling the extremes, you're sampling everything the provider posts for a month. And you're testing the full chain, from signal posted to trade closed, in conditions that approximate your own. It's the difference between reading restaurant reviews and cooking from the actual recipe in your actual kitchen.
There's one more advantage that people underrate. A structured demo month tests you as much as the provider. You'll find out whether you can actually be at your screen when signals land, whether you fat-finger lot sizes at 7am, whether you can leave a trade alone once it's on. Half the traders who fail with signals fail at execution, not selection. Better to discover that on play money.
The obvious objection: "a month on demo is a month of missed profits". Maybe. It's also a month of missed losses, and if the provider is any good, they'll still be good in five weeks. A service that pressures you to skip testing because "this opportunity won't last" has told you everything you need to know.
Setting up a demo that mirrors live conditions
A demo test is only as honest as the demo account behind it, and most people sabotage theirs in the first five minutes.
The default demo at most brokers gives you $10,000 or $100,000 of pretend money. Decline it. Set the demo balance to what you'd actually fund live. If your real plan is a $2,000 account, test on a $2,000 demo. This matters more than it sounds: position sizing, drawdown tolerance, and margin behaviour all scale with balance, and a test run at 50 times your real size teaches you nothing about how the strategy feels at your size. A 300-pip adverse move on gold is an abstraction on a $100k demo. On $2,000 with a 0.05 lot position, it's $150 of pain, and you need to know what that pain does to the equity curve you'll actually live with.
Next, the broker. Open the demo with the broker you'd genuinely use live, not whichever one had the fastest signup. Spreads on gold vary wildly between brokers, from under 15 cents to over 50 on the same quiet Tuesday, and a signal strategy with tight stops can be profitable at one spread and a slow bleed at another. If you're planning to use one of the partner brokers that make services like ours free, test on that broker's demo specifically; the FAQ covers how the partner arrangement works if that route interests you.
Match the account type too. Standard account live, standard demo. Raw-spread-plus-commission live, same on demo. Commission changes the arithmetic on every trade, and gold signals with 30- and 50-pip first targets feel that arithmetic immediately.
Three smaller settings people forget:
- Leverage. Set demo leverage to whatever you'd run live. Absurd demo leverage lets you take positions that would trigger margin calls on the real account.
- Platform. MT4 or MT5, same as live, on the same devices. If you'll execute from your phone at work, test from your phone at work. Execution friction is part of the experiment.
- Base currency. Same as your live account, so the P/L numbers you log are the numbers you'd actually see.
One thing you can't fully replicate: demo fills. Demo servers fill you at the price you clicked, more or less always. Live servers don't, especially around news. We'll handle that with a correction factor later rather than pretending it away.
Total setup time, done properly: about twenty minutes. The number of people who skip it and then wonder why live results don't match their test is not small.
The 30-day protocol: rules you commit to upfront
Here's where the experiment either becomes real or stays a vibe check. Before the first signal, you write down the rules, and then the rules are not negotiable for 30 days.
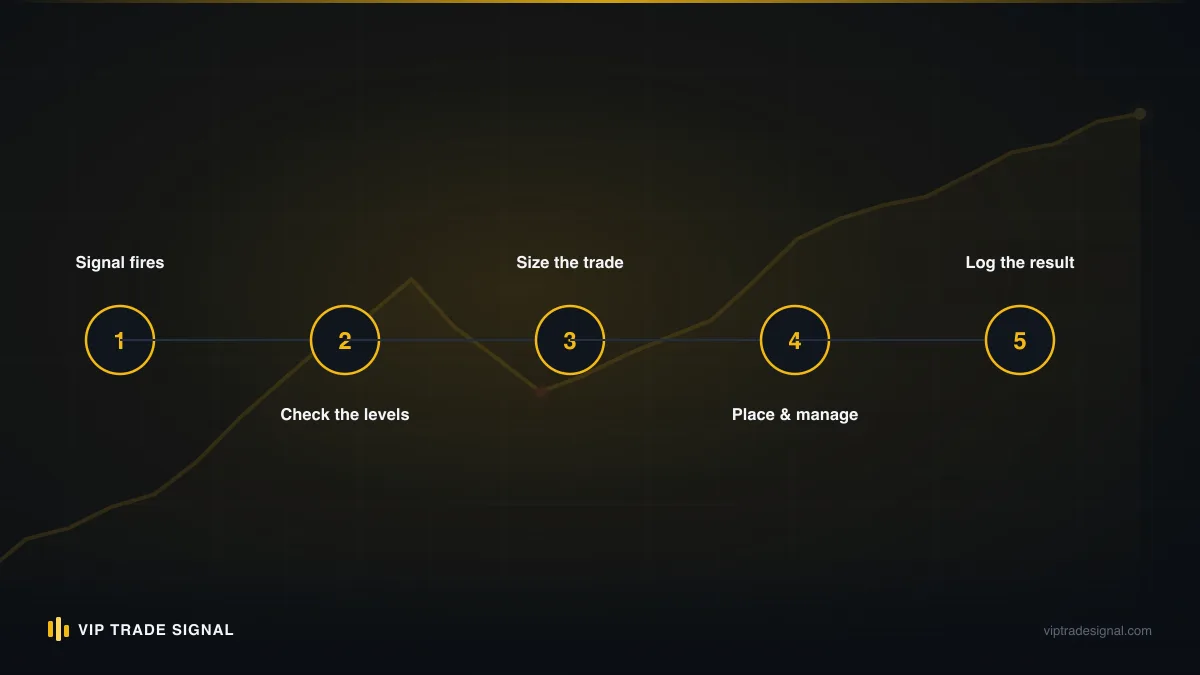
Why upfront? Because the whole failure mode of informal testing is deciding what counts after you've seen the results. Skip a losing signal, then quietly exclude it: "I wouldn't have taken that one anyway." Take a winner at a better price than posted, count the improved result. Do that for a month and you've tested nothing except your own capacity for self-flattery.
The rules I'd commit to, and the ones we suggest to anyone testing our own gold signals:
- Take every signal. Not the ones you like. Not the ones that agree with your own read of the chart. Every signal posted during your defined trading window, executed as posted. You're testing the provider's judgement, not a blend of theirs and yours.
- Define the window honestly. If you genuinely cannot trade between 1am and 6am, write that down on day one and exclude those hours for the whole month, both wins and losses. What you may not do is decide at day 19 that the overnight signals don't count because two of them lost.
- Fixed risk per trade. Pick a percentage, 0.5% or 1% of the demo balance, and size every position off the posted stop loss. Same formula every time. Never martingale, never "double up because the last one lost".
- No manual interference. Stop loss and take profits go in with the order and stay there, unless the provider posts a management update, in which case you follow that update. You don't move stops. You don't close early because it "looks weak". Not once.
- Log the same day. Every signal gets its row in the tracking sheet within 24 hours, filled trades and missed ones alike.
- Pre-commit the end conditions. The test runs 30 calendar days or 30 signals, whichever comes second, unless one of the hard red flags (a later section) fires first. You don't stop at day 12 because you're up, and you don't stop at day 12 because you're down.
Write these on paper or in the top rows of the spreadsheet. It sounds ceremonial. It is ceremonial, deliberately, because the ceremony is what stops the quiet cheating that ruins the data.
One rule about money during the test: don't pay for a subscription you can avoid. Plenty of providers offer a forex signals free trial or a free tier, and testing on that costs nothing. If a service has no trial, no free tier, and no public history, weigh whether one month's fee is worth the information. Sometimes it is. A $99 subscription tested properly and rejected is cheaper than a $2,000 account tested badly and lost.
What to log per signal: the tracking sheet
The tracking sheet is the actual product of this month. The demo balance at day 30 is almost a distraction; the sheet is where the truth lives.
You can build it in Google Sheets in ten minutes. One row per signal, these columns:
| Column | What goes in it | Why it matters |
|---|---|---|
| Date / time posted | Timestamp when the signal appeared | Reveals session bias and whether you can realistically catch them |
| Time you saw it | When you actually read it | The gap here predicts your live slippage on entries |
| Direction & type | Buy/sell, market or pending | Pending orders test very differently from market entries |
| Posted entry | The provider's stated entry price | Baseline for measuring your fill quality |
| Your fill | The price you actually got | Demo optimism lives in this column |
| Stop loss | As posted | Needed for R-multiple maths |
| Take profits | TP1/TP2/TP3 as posted | Partial-close structure changes everything |
| Risk in $ | Your fixed % converted to money | Keeps sizing honest |
| Outcome | Which levels hit, in what order | The core result |
| Result in R | Profit or loss divided by risked amount | The only unit that transfers to any account size |
| Updates posted | Stop moved to breakeven, early close, etc. | Measures management quality, not just entries |
| Notes | Spread at entry, news events, your mistakes | The column you'll thank yourself for |
Two of these deserve a word. Result in R is the unit that makes the whole test portable. A trade that risked $20 and made $30 is +1.5R; one that lost the full stop is −1R. Sum the R column at the end and you have a number that means the same thing whether you go live with $500 or $50,000. Dollars flatter or frighten depending on size; R just tells the truth.
And the missed-signal rows. When a signal posts at 3am and you sleep through it, it still gets a row, marked missed, with the outcome it would have had. At month's end you'll compare the taken set with the full set. If the provider's overall month was +9R but your taken subset was +2R, the service might be fine and the fit might be wrong. That's a real finding, and it's one nobody else can produce for you. If you want to see the level structure you'll be logging, most gold signals arrive with three targets, and it's worth understanding what TP1, TP2 and TP3 actually mean before your first row, because "which targets hit, in what order" is where most logging errors happen.
Resist the urge to add twenty more columns. A sheet that takes four minutes per signal gets filled in; one that takes fifteen gets abandoned by day nine.
Executing every signal exactly as posted
This section is short because the rule is short, but it earns its own heading because it's where most demo tests quietly die.
Exactly as posted means: the posted entry method, the posted stop, the posted targets, the posted management. If the signal says "buy gold at market, SL 3,290, TP1 3,318, TP2 3,332", you buy at market within a reasonable window of seeing it, you set that stop, you set those targets, and then you sit on your hands. If a pending order signal says "buy limit 3,304" and price never comes back to 3,304, the order expires untriggered and you log it as not filled. You do not chase it at 3,312 because it "ran without you". The provider's edge, if there is one, includes the entries that don't fill; chasing replaces their entry logic with your impatience.
The temptations, so you can recognise them mid-test. Skipping a signal because you've had three losers and this one "feels" like another. Closing a winner at half its first target because green numbers are pleasant. Widening a stop "just a bit" because price is close to it and you'd hate to be stopped by a wick. Every one of these substitutes your judgement for the thing under test, and the moment you do it, the row is contaminated. If you slip, and most people slip once or twice, log it in the notes column and log what would have happened under the rules. Keep two mental ledgers: the provider's performance, and your interference. Month-end, you'll want both.
There's a self-serving objection worth answering: "but live, I'd manage trades actively anyway". Fine, maybe you will. But you can't evaluate a provider through the fog of your own improvisation. Test the signals pure first. If they pass, you can run a second month testing your management overlay against the baseline you just built.
Demo vs live gaps: spread, slippage, psychology
Demo results are always a little too good. Not fraudulently, structurally. If you don't correct for the gap, you'll go live expecting the demo number and feel cheated by a perfectly normal live result.
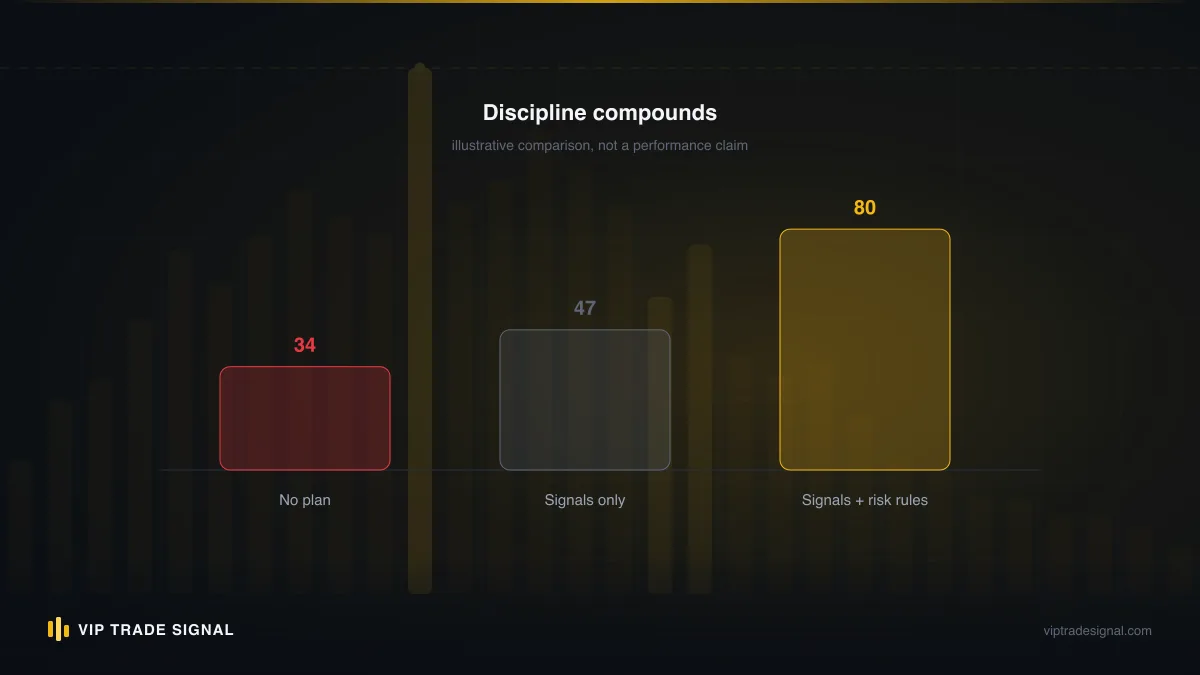
Three gaps, in ascending order of nastiness.
Spread. Some brokers run tighter spreads on demo servers than live, and gold is a favourite instrument for this because its spread is volatile anyway. During the London/New York overlap the difference might be trivial. During the Asian session or in the minute around a US inflation print, the live spread on gold can triple while the demo spread barely moves. Check it yourself: open the live platform (you can watch prices without funding) beside the demo and compare quotes at the times your provider actually posts. If signals cluster around New York mornings, that's the spread that matters.
Slippage and fills. Demo servers simulate fills; there's no real liquidity behind them, so your stop loss "fills" at exactly its price and your market order fills at the quote you saw. Live, a stop on gold triggered during a fast move can fill 20, 40, occasionally 100+ cents through the level. Take profits can be skipped by a gapping price. Pending limit orders that "filled" on demo might have been jumped over live. The honest correction: assume every live result is a little worse than its demo twin, with the damage concentrated in trades around scheduled news.
Psychology. The big one, and the one no spreadsheet fully captures. On demo, a 150-pip drawdown on gold is a number. Live, it's your actual money evaporating in real time, and the urge to "just close it" becomes physical. Nearly everyone trades demo more calmly than live. You can't eliminate this gap, but you can shrink it: run the demo at your real intended balance (you already did, per the setup section), imagine each loss as dinner out with your family that isn't happening, and note in the sheet any trade where even the demo loss made you twitchy. Those notes are a map of where live-you will struggle.
A workable rule of thumb for gold signals with typical 30-to-80-pip targets: haircut your demo expectancy by 10-20% when projecting live performance, more if the signals trade thin sessions or news windows. A demo month at +8R projecting to +6.5R live is still worth having. A demo month at +1.5R probably isn't, once the gap eats it.
Minimum sample size: why 10 trades proves nothing
Here's the uncomfortable maths that most trials, free or paid, are designed to exploit.
Suppose a provider is genuinely mediocre: a true 50% win rate on trades that win 1R and lose 1R, zero long-run edge. Over any 10 trades, simple binomial arithmetic says there's roughly a 17% chance they hit 7 or more winners. Run that mediocre service past six prospects on 10-trade trials and one of them, on average, sees a 70% win month and signs up convinced. Nobody lied. The sample was just small enough for luck to impersonate skill.
Flip it around and it stings the other way: a genuinely good provider with a 60% true win rate has about a 16% chance of winning 5 or fewer out of 10. Small samples don't just admit frauds; they reject decent services too. Ten trades is a coin rattling in a cup.
Ten trades can't tell a good provider from a lucky one. Thirty starts to. A hundred usually settles it.
So what's enough? Statisticians would want hundreds of trades to pin down a win rate tightly, and you don't have that kind of patience, so we compromise. Thirty trades is the practical floor: enough that a coin-flip service faking a strong month becomes genuinely unlikely, few enough to gather in 30-45 days from an active gold provider. If your provider posts one or two signals a day, a calendar month gets you there. If they post three a week, extend the test to hit 30 trades rather than stopping at 30 days with 13 rows; that's why the protocol said "whichever comes second".
Two refinements that matter more than raw count:
- Judge expectancy, not win rate. A 40% win rate with 2R average winners beats a 65% win rate with tiny winners and full-stop losers. Your R column already computes this: total R divided by number of trades. Anything reliably above +0.2R per trade after the demo-to-live haircut is respectable. Signal sellers advertise win rate precisely because it's the number luck fakes most easily.
- Watch the distribution, not just the sum. +6R built from steady singles is a different animal from +6R that was −5R until one monster trade rescued it. One trade carrying the month means your result is really a sample of one.
And accept, gracefully, what a month cannot do. Thirty trades can't prove a provider will be good next year. It can prove they're consistent with their claims, catch the worst frauds, and measure the fit between their posting schedule and your life. That's a lot. It isn't certainty, because nothing in this business is.
Mid-test red flags that end the trial early
The 30-day commitment has an escape clause, and it's important to define it as narrowly as the rest of the rules. You don't quit because of losses. Losses are the weather. You quit for integrity violations, because a provider who fakes or fudges cannot be tested at all; the data itself is poisoned.
Hard stops, any one of which ends the trial that day:
- Edited or deleted history. A losing signal quietly vanishes from the channel, or an entry price changes after the fact. Telegram shows an "edited" tag; screenshots of signals at posting time, which take two seconds, make this checkable. One doctored signal invalidates every other row in your sheet. Walk.
- After-the-fact signals. "We caught this 400-pip move" posted with no timestamped entry beforehand. Hindsight signals are marketing, and a channel that mixes them with real calls is telling you which business it's really in.
- Results that don't match your log. Their monthly recap claims +2,100 pips; your sheet, which took every signal, says +600. Ask once, politely, how they count. If the answer involves counting every TP level of every trade as separate pips while losses count once, you've learned the accounting is decorative.
- Sizing instructions that reveal the model. Any instruction to double lots after losses, add "recovery trades", or remove stop losses ends the test immediately. Martingale on gold works until the one week it removes the account.
- The upsell pivot. The "free" channel turns out to be a funnel where real entries are held back for a paid tier mid-trade, or you're pressured to move to a specific unregulated broker with a deposit bonus. Some broker-linked models are legitimate and transparent about the economics; we run one ourselves, and how the broker-deposit route works is written up plainly. The flag isn't the model, it's the concealment.
Soft flags, which you note in the sheet and weigh at month's end rather than acting on immediately: signals arriving so fast after each other that management is impossible; stops widened mid-trade more than once; long unexplained silences; a channel that celebrates wins with fireworks and passes losses in silence. Three or four soft flags together tell a story even when no single one is disqualifying.
The discipline runs both ways. If none of the hard flags fire, you finish the month, even through an ugly drawdown. Especially through an ugly drawdown, actually, because how a provider behaves during a losing streak, whether they keep posting, keep the same sizing, keep acknowledging the losses, is some of the best data the test produces.
Scoring the month: expectancy, drawdown, effort
Day 30 (or trade 30, whichever came second). The sheet is full. Now you score it like an examiner, not like a fan.
Compute five numbers:
- Total R and expectancy. Sum the R column; divide by the number of taken trades. This is the headline. Apply the 10-20% live haircut from earlier before you let it impress you.
- Win rate and average win/loss. Not because win rate matters on its own, but because the pair tells you the strategy's shape: grinder (high win rate, small R wins) or hunter (lower win rate, occasional 3R+ winners). Shapes fail differently. Grinders die by a fat tail of big losses; hunters die when you can't sit through eight straight losers, which brings us to number three.
- Maximum drawdown in R. The worst peak-to-trough run in your cumulative R curve. If the month made +7R but passed through −6R on the way, ask honestly: with real money, would you have still been following at −6R? Most people answer yes and behave no. Whatever drawdown the demo month showed, live will eventually show worse; a month is a small sample of drawdowns too, not just of wins.
- Missed-signal delta. Full-set R minus taken-set R. Large gap, wrong time zone fit; the provider might suit somebody, just not you, and no amount of quality fixes a schedule mismatch.
- Effort cost. Roughly how many hours the month consumed: waiting, executing, logging. A service that netted +4R and forty anxious hours is paying you poorly for a part-time job. This number never appears in anyone's marketing and it decides more long-term outcomes than expectancy does.
Then reread the notes column start to finish in one sitting. Patterns hide there: every loser clustered around US news, spreads trebling at each entry, your own repeated 40-minute delay on morning signals. The numbers say whether the month was good; the notes usually say why.
Grade it coldly. Positive expectancy after haircut, drawdown you can genuinely stomach, no hard flags, tolerable effort: a pass, and you can plan a live transition. Positive expectancy but a drawdown that made even demo-you sweat: a conditional pass, live only at reduced risk. Flat-to-negative expectancy with clean behaviour: a fair provider having a normal bad month, or a mediocre one; extend the demo another 30 trades if you're unsure, because extending costs nothing. Any hard flag: a fail regardless of the R total, and yes, that includes a profitable month. A dishonest provider who happened to win for 30 days is still a dishonest provider.
Comparing your results to the provider's claims
The month has a second output beyond "should I go live": it's an audit of the provider's honesty, and this comparison is where demo account signal testing earns its keep as due diligence.
Put your sheet next to whatever the provider publishes: monthly recaps, pinned results, a public history page. You're checking three alignments.
Completeness. Does every signal you logged appear in their reckoning? The commonest fraud in this industry isn't fake wins; it's real results with the losers omitted. Your sheet is the complete record, so missing trades stick out immediately. A provider whose public history includes its losses is rare enough to notice; it's the reason we publish every closed signal, wins and losses alike, at our signal history, because a track record you can't check against your own log is an anecdote with formatting.
Counting method. If their pips and your pips disagree, find the rule that explains the gap. Common inflations: counting each TP as its own full-size win, quoting the best possible exit rather than the posted management, measuring from an entry price the signal never actually offered. Ask them to walk you through one specific trade from your sheet. A straight answer to a specific question is a good sign. A paragraph about their "verified 92% accuracy" is not. The wider question of how to verify a signal track record from the outside deserves its own piece, and there is one, but nothing external beats a month of your own rows.
Trajectory. Compare your tested month against their claimed average. Your +4R month against a claimed history of "+2,000 pips monthly" means either you caught a rare bad patch or the claims were always decorative. Sometimes it genuinely is a bad patch; even good desks have flat months, and honest providers say so in the open. But when the marketed number is triple anything your complete log can reconstruct, believe your log. Your log has no marketing department.
Keep the sheet afterwards, whatever you decide. If you go live, it's your baseline; live months that fall far below it, beyond the expected haircut, are a signal that something changed, either in the service or in your execution. And if you walk away, the sheet is a template that makes the next provider's test half the work.
Graduating to live: position sizing for month one
Say the month passed. Expectancy positive after haircut, drawdown bearable, notes clean, claims aligned. The instinct now is to fund the account and jump to full size, because the testing is "done". It isn't, quite. The first live month is the second half of the experiment: same signals, same sheet, new variable, which is you, with money on.
Real money is high risk in a way demo never was; losses now are actual losses, and no protocol removes that. What sizing does is make the tuition affordable.
Start at half whatever risk you tested. Demo at 1% per trade, go live at 0.5%. On a $2,000 account that's $10 of risk per signal, which will feel almost insultingly small, and that's the point: month one live is measuring the psychology gap, and you want that measurement to be cheap. Keep logging every trade in the same sheet, same columns, plus one new note: how each trade felt. Where demo-you was calm and live-you closed a winner early or hovered over a stop, you've found the gap the earlier section warned about, at half price.
At the end of live month one, compare its R total against the demo baseline. Within the expected haircut of each other: raise risk to your tested level and carry on. Live sharply worse with the same signals: the leak is execution or nerves, not the provider, and more size would only make the leak more expensive. Fix the behaviour first, at small size, however many months that takes.
A few sizing rules that hold whatever the provider:
- Risk a fixed percentage of current balance, so size shrinks in drawdown automatically.
- Cap total open risk. Three simultaneous gold signals at 1% each is 3% on one metal; correlated positions on a single instrument fail together.
- Decide your walk-away line before funding: the drawdown in R at which you stop and reassess, written down next to the original rules. Deciding it mid-drawdown means deciding it with the worst version of yourself.
- Never add size to "win back" a losing week. That's the martingale logic you rejected in other people, back for a personal visit.
If the demo month failed, graduating means walking away, and doing it without the sunk-cost wobble. A month spent proving a service isn't worth your money is a month that earned its keep. The sheet transfers. The next test is faster.
Your 30 days start whenever you decide they do
Strip it to the checklist. Demo at your real intended balance, real broker, real account type. Rules written before signal one: every signal, fixed risk, no interference, defined window, pre-committed end. A twelve-column sheet, filled the same day, missed signals included. Thirty trades minimum before the numbers mean anything. Hard flags end the test; losses don't. Score in R, haircut for live, audit the claims against your log, and go live, if you go live, at half size for a month.
None of this is glamorous. That's rather the point. The signal industry sells excitement, screenshots of monster wins and countdown-timer "free trials" engineered to convert you before the sample size can embarrass anyone. The demo protocol is the antidote precisely because it's boring: it replaces the ninety-second mattress test with a month of rows in a spreadsheet, and the rows don't care about anyone's marketing.
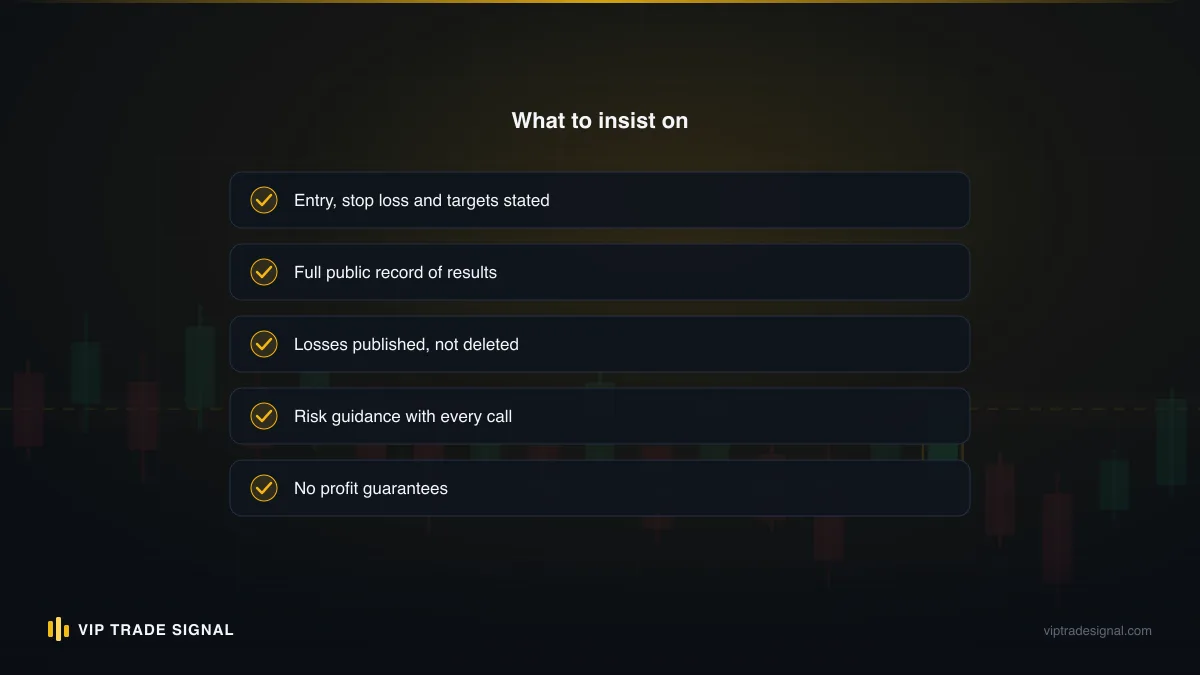
We'll say the self-interested thing once, plainly, because the honesty rules cut both ways. We think a properly run demo test is the best filter this industry has, and we think that partly because it's a test we're set up to pass: every closed gold signal we've issued is public, losses included, and a month of your own logging against our channel will reconstruct our numbers or we deserve to lose you. Most services fear the protocol. That fact alone should tell you how much of the industry is built on samples too small to check.
So here's the hard question to end on. You were going to spend the next month watching some provider's signals anyway, half-following, half-deciding, drifting toward a decision you'd eventually make on feel. The month passes either way. The only choice is whether it ends with a spreadsheet that knows the answer, or with the same hunch you started with and slightly less patience. Set up the demo tonight. It takes twenty minutes, and it's the cheapest due diligence you'll ever do.