Most gold strategies you find online were never built for gold. Someone took a EUR/USD system, swapped the symbol, ran a backtest with a fixed 20-cent spread, and published the equity curve. It looks beautiful. Then you trade it live through one New York session and watch a "tight" stop get clipped by a wick that exists on no backtest anywhere, because the backtest never modelled what gold actually does at 14:30 London time.
We run a desk that trades XAU/USD and nothing else, so we have strong feelings about this. A working XAUUSD trading strategy is not a forex strategy with a shinier symbol. It is a set of rules built around gold's specific personality: its sessions, its spread behaviour, its habit of overshooting every level by a few dollars before doing what you expected. This piece is the full playbook. Three frameworks with actual entry, stop, and exit rules. What moving averages genuinely do on gold when you test them honestly. How to size positions, how to survive news days, and how to backtest without fooling yourself.
Fair warning before we start: none of this removes risk. Gold is a leveraged, volatile instrument and most retail accounts trading it lose money. A strategy tilts the odds and controls the damage. It does not promise anything, and anyone who tells you otherwise is selling something other than trading.
Why an XAUUSD trading strategy can't be a forex port
Start with the numbers, because they settle the argument quickly.
A typical day's range on EUR/USD might be 60 to 80 pips. On gold, an ordinary Tuesday moves $20 to $30, and a lively one moves $50 or more. Price both of those per standard lot and the difference stops being academic: a $25 gold move is $2,500 per lot. The same nominal position size that gives you a calm afternoon on a major pair gives you a margin call on gold.
Then there is the spread. On a decent broker, EUR/USD costs you a fraction of a pip almost all day. Gold's spread breathes. It might be 15 to 25 cents through a liquid London afternoon, then triple in the minute before a US inflation print, then blow out to a dollar or more in the Asian small hours or around the daily rollover at 5pm New York. A scalping system that works at a 20-cent spread and dies at 60 cents is not a system. It is a fair-weather arrangement.
Third, and least appreciated: gold overshoots. Currency pairs respect levels with reasonable manners because the players on both sides are mostly the same banks hedging the same flows. Gold has a wider cast — central banks, ETF flows, jewellery demand, momentum funds, and a very large retail crowd clustering stops at obvious round numbers. When gold approaches a level everyone can see, it usually trades through it by $3 to $8, hoovers up the stops parked there, and only then decides its real direction. If your strategy places stops exactly at the level, gold will collect them like a toll booth.
So every rule in this article carries gold-specific assumptions: wider structural stops than feel comfortable, entries that expect the overshoot rather than fear it, and session filters that most forex strategies never bother with. Take those out and you are back to trading a EUR/USD system on the wrong instrument.
The gold trading day, hour by hour
Gold trades nearly 24 hours on weekdays, but it does not behave the same way for any two of them. Learn the day's shape and half your filtering is done before you draw a single line on a chart.
Asia (roughly 00:00–07:00 London time). Thin, rangey, occasionally treacherous. Spreads are wider, moves are smaller, and the session's main job is to establish a range that London will later destroy. There are exceptions — a risk event in Asian hours, a Bank of Japan surprise — but as a rule this is observation time, not execution time. Plenty of scalpers have donated their week's profit to the Asian session out of boredom. Don't be one of them.
London open (07:00–09:00). The first real liquidity arrives and gold usually picks a direction, often by running one side of the Asian range first. The classic move: spike $5 above the Asian high, stall, reverse $15 the other way. That fake-out is not a bug. For two of our three frameworks it is the entry signal itself.
London morning into lunch (09:00–13:00). Trending hours when there's a story, drifting hours when there isn't. Spreads are at their best. If you can only watch charts for one calm window a day, this is a decent one.
The New York overlap (13:00–17:00 London). This is gold's main event. US data lands at 13:30, COMEX is fully awake, and both London and New York desks are active at once. The biggest moves of most days happen here, and so do the nastiest wicks. Momentum works best in this window; so does getting stopped out twice in ten minutes if you trade it carelessly.
Late New York (17:00 onwards). London goes home, liquidity thins, and moves start to drift rather than trend. The 22:00 London rollover (5pm New York) brings a brief but genuinely ugly spread widening — routinely several times the daytime spread. No framework in this article takes positions into that window, and any open scalp should be flat well before it.
One practical habit that costs nothing: mark the Asian high and low every morning. Gold interacts with those two levels almost every single day, and they anchor the first framework below.
Framework one: London/NY momentum scalping
This is the highest-tempo framework and the most demanding of your attention. It tries to catch the directional bursts that happen when the market is at its most liquid, holds for minutes to a couple of hours, and refuses to trade at any other time.
When it trades. Two windows only: London open (07:00–10:00) and the New York overlap (13:00–17:00, London time). Outside those windows the strategy is flat. Not "flat unless something looks amazing". Flat.
Timeframes. Bias from the 1-hour chart, execution on the 5-minute.
The rules, in order:
- Establish bias. On the 1-hour chart, is price making higher highs and higher lows (long bias), lower highs and lower lows (short bias), or neither (no trade)? You want the answer in ten seconds. If you have to squint, there is no bias and the morning is a no.
- Wait for the pullback. With a long bias, wait for the 5-minute chart to pull back against the trend — ideally into the area of the Asian high (now acting as support), a prior 5-minute consolidation, or the 20-period EMA on the 5-minute. Gold pullbacks are fast and deep; a $6–$10 retrace inside an uptrend is normal, not a reversal.
- Enter on reclaim, not on touch. Do not buy the falling knife into the level. Wait for a 5-minute candle to close back in the trend direction, then enter on the next candle. You surrender a couple of dollars of entry price and in exchange you skip most of the traps.
- Stop below the pullback low, plus cushion. Not at the low. $2–$3 beyond it, because of the overshoot habit. On a typical setup this makes the full stop $5–$9 wide.
- Two targets. Take half off at 1R (profit equal to the stop distance) and move the stop to entry. Run the remainder toward the next 1-hour structural level, or trail it behind each new 5-minute swing.
- Hard daily limits. Two losses in a session ends the session. Three losses in a day ends the day. This rule has saved more scalping accounts than any indicator ever invented.
A worked example, with invented but realistic numbers. Say it's 13:45 London, gold is trending up on the 1-hour, and price pulls back from 3,349 to 3,341, right into the morning's breakout shelf. A 5-minute candle closes back up at 3,343. You buy at 3,343.50 with a stop at 3,336 (below the 3,338.80 pullback low, with cushion) — $7.50 of risk. First target 3,351, where you bank half and go risk-free. The runner aims at 3,358, the prior day's high. Sometimes the runner gets stopped at entry and you make half a unit. Sometimes it pays 3R. Over a hundred trades, that asymmetry is the entire edge.
What kills this framework is not the losing trades. It's the trades outside the rules: the bored Asian-session punt, the third entry after two stops, revenge-buying the news candle. The rules are boring on purpose. Boring is what survives.
Framework two: swing trading structure breaks
If you have a job, a family, or simply no appetite for staring at 5-minute candles, this is your framework. It trades the 4-hour and daily charts, holds for two days to three weeks, and needs perhaps twenty minutes of attention per evening.
The core idea: gold spends most of its time in broad consolidations, then leaves them violently. You are not trying to predict the break. You are trying to join it once it has proven itself, and to survive the retest that almost always follows.
The rules:
- Find the structure. On the daily chart, mark consolidations that have held for at least two weeks — a range with a defined ceiling and floor that price has tested at least twice on each side. Gold produces a handful of these per year, and they are visible to anyone honest. If you can't draw the box in under a minute, it isn't a box.
- Demand a daily close beyond it. An intraday poke through the level counts for nothing; gold pokes through everything. You want a full daily candle closing beyond the boundary, ideally by more than $5.
- Enter on the retest, not the break. Here is where patience pays. After a genuine break, gold usually returns to the broken level within one to five days and tests it from the other side. That retest is your entry — you're buying a former ceiling acting as a floor. You will miss the occasional runaway break that never comes back. Accept it. The retest entry roughly halves your stop size and filters a large share of false breaks in the bargain.
- Stop beyond the far side of the retest swing. Typically $15–$30 on gold at current prices. Yes, that's wide. That's the price of trading a timeframe where a $12 wick is Tuesday-afternoon noise.
- Target the measured move. Take the height of the consolidation and project it from the break point. A $40-tall range that breaks upward at 3,360 targets roughly 3,400. Bank half there; trail the rest behind each new daily swing low until it's taken out.
- One position per structure. No pyramiding into the same break, no re-entering three times as a level fails messily. One break, one trade, one outcome.
The psychological difficulty of swing trading gold is not the entries. It's the holding. A position that's $25 onside can be $6 onside by breakfast without anything being wrong. If you have sized so that the full stop-out costs 1% of the account, you can watch that happen with your pulse under 100. If you've sized for excitement, you'll close it at the worst possible moment and then watch it hit your original target without you. Sizing, which we'll get to properly below, is what makes this framework tradeable at all.
Framework three: mean reversion at levels the market actually respects
The counter-trend framework, and the one we'd hand to the fewest people. It makes money in the rangey conditions that starve the other two, and it loses fastest when a real trend arrives. Its whole discipline is selectivity.
The premise: certain gold levels get tested again and again, and reactions off them are tradeable — but only certain levels, and only with confirmation.
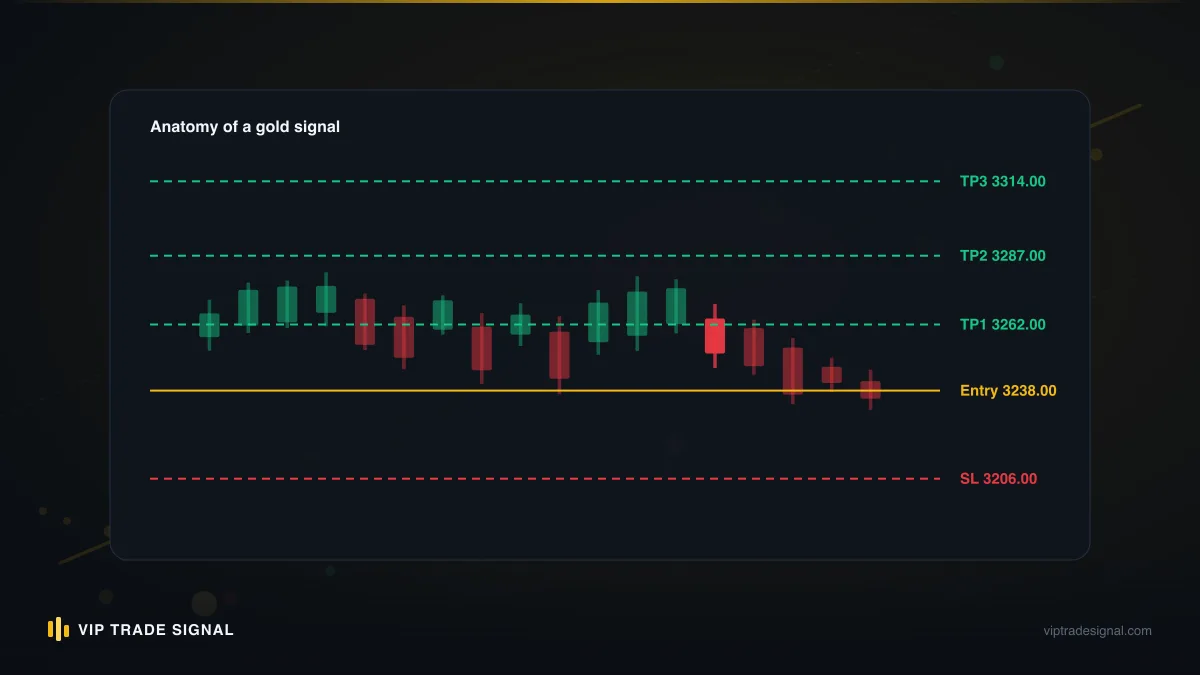
Levels that qualify:
- The prior day's high and low.
- The prior week's high and low.
- Major round numbers at the $50s and $100s (3,300, 3,350, 3,400). The $25 increments are noise; skip them.
- Any daily level the market has already rejected twice in recent weeks.
That's the whole list. If your chart has fourteen horizontal lines on it, you don't have levels, you have wallpaper.
The rules:
- Regime check first. Mean reversion only trades when the daily chart is broadly sideways — no sequence of strong one-directional daily closes in the last week. In a trending regime this framework is switched off entirely. Fading a genuine gold trend is how accounts die, and they die quickly.
- Let the level be swept. Remember the overshoot habit. You want price to trade $2–$6 through the level — running the obvious stops — and then reject. The sweep is not a failure of the level. On gold, the sweep is the confirmation.
- Enter on the reclaim. After the sweep, wait for a 15-minute candle to close back on the original side of the level. Enter there. Buying the first touch of support, without the sweep and reclaim, is the single most common way people lose money with this style.
- Stop beyond the sweep extreme, plus cushion. If support at 3,340 was swept to 3,335.20 and reclaimed, your stop goes near 3,332. Usually $6–$10 all-in.
- Target the middle, not the far side. Mean reversion pays you for the trip back toward the range midpoint, not for a full traverse. Take most of the position off at the midpoint. Greedy targets turn a 60% win rate into a 40% one with the same entries.
- Never re-fade a level twice in a session. If a level was swept, reclaimed, and then broken again, the market has told you what it thinks. Believe it.
This is also the framework most sensitive to news. A level sweep during a quiet London lunch and a level sweep thirty seconds after a hot CPI print are entirely different animals, which is why the news-day playbook below exists.
Moving averages on XAUUSD: what honest testing shows
Every second gold article on the internet is some version of an xauusd moving average strategy: golden cross the 50 and 200, buy the 20 EMA bounce, done. So let's be straight about what testing these things actually reveals, because we've run these studies on years of gold data and the results are less flattering than the articles.
Simple MA crossovers, traded raw, are roughly break-even before costs on gold — and losers after them. A 50/200 daily crossover system catches the two or three big trends per decade beautifully and then hands most of it back through a long string of whipsaw losses in consolidations, which is where gold spends the majority of its life. Add realistic spread and slippage and the equity curve sags below zero for long, demoralising stretches. Faster crossovers (say 9/21 on the 1-hour) trade more and whipsaw more; the cost drag gets worse, not better.
Moving averages as filters, though, genuinely earn their place. The same tests show a consistent pattern: taking framework-one scalps only in the direction of the 1-hour 50 EMA slope removes a large slice of the losing trades while keeping most of the winners. The MA isn't generating signals. It's vetoing bad ones. That's a real, durable job.
So our position, plainly: no moving average crossover is a complete XAUUSD trading strategy, and anyone selling one with a smooth backtest curve has either not traded it live or not charged it real costs. But a 50 EMA on your 1-hour chart, used purely as a "which side am I allowed to trade" line, is worth more than most indicators costing $200 on the MQL market.
One more honest note. We are not publishing precise win-rate percentages for these tests, because backtest statistics travel badly — different data feed, different spread model, different result. The shape of the findings holds up across every variation we've run. The third decimal place never is.
The news-day playbook: trade it, fade it, or stay flat
Gold reacts to US macro data more violently than any major currency pair, because gold is, at heart, a bet on real interest rates and the dollar. CPI, non-farm payrolls, and FOMC decisions are the big three. On those days you need a protocol decided in advance, because deciding in the moment, with a candle moving $10 every thirty seconds, is not deciding. It's flinching.
Here is ours.
Before the release (from 30 minutes out): no new positions in any framework. Existing swing positions either carry their normal stop knowingly, or get reduced — decided the evening before, never in the final half hour. Scalps are flat, full stop. Spreads start widening several minutes before the number, and a resting stop-loss can fill dollars away from its price in the release itself. That's not broker villainy, mostly; it's what no liquidity looks like.
The first fifteen minutes after: we don't trade them. The initial spike reverses fully or partially on a large share of releases — the market's first opinion of a data print is frequently wrong. Fifteen minutes of watching costs nothing and skips the worst fills of the month.
After fifteen minutes, three branches:
- Trade the trend if the post-news move aligns with the existing 1-hour bias and holds its ground after the first pullback. This is framework one with extra confirmation and slightly wider stops — call it 1.5× normal width for the first hour.
- Fade the spike only when the move has slammed directly into a framework-three quality level (prior week's extreme, major round number) and printed a sweep-and-reclaim. News-day fades pay well precisely because they're frightening, but they take the full confirmation sequence. No shortcuts because the candle is exciting.
- Stay flat the rest of the time, which honestly is most of the time. A news day where you did nothing is a successful news day more often than not.
FOMC gets one extra rule: the statement lands at 19:00 London and the press conference follows at 19:30, and the conference reverses the statement's move often enough that we treat the whole 19:00–20:30 window as unreadable. Whatever gold does in it, we let it.
The market will still be there tomorrow. Your account has to be.
Stops and targets: the architecture underneath all three frameworks
Different rules per framework, one shared philosophy: the stop goes where the trade idea is objectively wrong, plus a cushion for gold's overshoot, and then the position size is derived from that distance. Never the other way round. The moment you pick a stop distance because it "fits" the position size you wanted, you've replaced analysis with wishcasting.
The comparison, side by side:
| Momentum scalp | Structure swing | Mean reversion | |
|---|---|---|---|
| Timeframes | 1H bias, 5M entry | Daily bias, 4H entry | Daily regime, 15M entry |
| Typical stop | $5–$9 | $15–$30 | $6–$10 |
| Stop logic | Beyond pullback low + $2–3 | Beyond retest swing | Beyond sweep extreme + cushion |
| First target | 1R, bank half | Measured move, bank half | Range midpoint, bank most |
| Runner | Trail 5M swings | Trail daily swings | Small or none |
| Holding time | Minutes–hours | Days–weeks | Hours–a day |
| Trades/month | 15–40 | 2–6 | 5–15 |
Three details that matter more than they look:
The cushion is not optional. Every framework adds $2–$3 beyond the "logical" invalidation point. Across a year of gold trades, the difference between a stop at the swing low and a stop $2.50 beyond it is a startling number of trades that survived to hit target instead of dying by wick. It is the single cheapest improvement available to a gold trader.
Partial profits are a psychological tool wearing a mathematical costume. Pure expectancy maths sometimes argues for all-or-nothing exits. We bank halves anyway, because a trader who has taken something off the table holds the runner properly, and a trader who is all-in to the last tick interferes with the trade. Strategy design has to fit humans, or humans won't run it.
Time stops exist. A scalp that has gone nowhere in 90 minutes gets closed; the burst it was built for didn't come. A mean reversion trade still underwater at the level after four hours gets closed. Swings are exempt — patience is their whole engine — but the fast frameworks pay rent by the hour.
Position sizing across the three frameworks
Here's where the frameworks unify. Whatever the setup, the account risks the same fixed fraction per trade — we suggest 0.5% to 1% while you're proving a framework, and never more than 2% at full confidence. The stop distance then dictates the lot size, mechanically.
The arithmetic, once, so it's concrete. On XAU/USD, one standard lot moves $100 per $1 of gold movement; 0.10 lots moves $10; 0.01 lots moves $1.
Take a $5,000 account risking 1%, so $50 per trade:
- Scalp, $7 stop: $50 ÷ $7 = $7.14 per dollar of movement → 0.07 lots.
- Swing, $22 stop: $50 ÷ $22 = $2.27 per dollar → 0.02 lots.
- Mean reversion, $8 stop: $50 ÷ $8 = $6.25 per dollar → 0.06 lots.
Notice the swing position is a third the size of the scalp. That's the design working. The wide stop and the small size cancel, and every trade in every framework threatens the account identically. Traders who blow up on gold almost always broke exactly this symmetry: they took swing-sized stops with scalp-sized lots, usually because the bigger number felt better on the winners. It feels better right up until one full stop-out costs 8% of the account, and the maths of getting 8% back is crueller than the maths of losing it.
Two more sizing rules we'd call non-negotiable. First, correlated exposure counts as one trade: a scalp long and a swing long on gold at the same time is double risk on one idea, so halve each or skip one. Second, after any 5% drawdown from equity peak, cut risk per trade in half until you've recovered half the hole. Drawdowns are when judgement is worst; the rule assumes that in advance so you don't have to notice it in the moment. If you've slipped further than that and are staring at a serious floating loss, that's a different conversation than a sizing tweak — it's the situation our drawdown management service exists for, and the honest first step is measuring the hole, not doubling the shovel.
Backtesting gold without lying to yourself
Most published gold backtests are fiction, and not because anyone faked the trades. They're fiction because of the assumptions underneath, and gold punishes bad assumptions harder than any forex major.
The four lies, in descending order of damage:
The fixed-spread lie. The test charges 20 cents per trade, all day, every day. Real gold spreads triple around news and blow out after 22:00 London. For a scalping system doing thirty trades a month, modelling spread as a constant can quietly overstate the edge enough to flip a losing system into an apparently winning one. Fix: charge your test the bad spread — 40 to 60 cents — on every entry that happens within 30 minutes of red-calendar news or outside London/NY hours. If the edge dies under that spread model, the edge was never there.
The perfect-fill lie. The test assumes your stop fills at its exact price. On a fast gold move, live stops slip. A backtest that adds zero slippage on stop-outs is systematically kinder than your broker will ever be. Fix: add $0.30–$0.50 of adverse slippage to every stop fill, and a full dollar on stops triggered inside news windows.
The bar-data lie. Testing a 5-minute strategy on bar closes, without tick data, means the test doesn't know whether the high or low of a bar came first. On an instrument that wicks like gold, that ambiguity resolves in the test's favour constantly. Anything with stops and targets closer than one bar's typical range needs tick-level data, or its results are a coin toss wearing a lab coat.
The regime lie. The subtlest one. A test run over a strong bull period will make any long-biased system look brilliant. You haven't tested the system; you've tested the era. Fix: test across at least one grinding consolidation and one sustained downtrend, and look at the worst 12-month stretch, not the full-period average. The worst stretch is the one you'll live through with real money and real doubt, and whether you'd have kept trading through it is the only question that matters.
And the simplest fix of all: forward-test. Run the framework on a demo or a tiny live size for eight to twelve weeks and compare the results to the backtest. If live scalping results come in noticeably below the test, that gap is your cost model error, measured for free. Painful, but cheap at the price.
How our signals map onto these frameworks
Time to declare an interest properly. We run a gold-only signal service, and the signals we publish are built from exactly the frameworks above — that's not a marketing flourish, it's why this article exists. When a signal arrives with an entry, stop, and two targets, it came out of one of these three machines.
The rough shape of it: the majority of our signals are framework-one momentum trades in the London and New York windows, which is why members in those time zones see the most action. Structure-break swings appear a few times a month when the daily chart actually offers one; we don't manufacture them in between. Mean reversion signals show up in sideways regimes and go quiet in trends, exactly as the regime filter above dictates. And on the big three news events we follow the playbook you just read, which means some news days produce nothing at all. Members occasionally grumble about the quiet days. We'd rather be grumbled at than be the channel that fires five signals into an FOMC press conference for the engagement.
Every closed signal — target, stop, or scratch — is public at /signals/history, losses sitting in the open next to wins. Read a run of it and you'll see these frameworks' fingerprints: the $6–$9 scalp stops, the wide swing stops with small implied sizing, the flat patches around CPI. That's the audit trail for everything this article claims. Service costs $99/month, or free if you trade through a partner broker with $250+ maintained; if you're weighing us against the rest of the market, our guide to choosing between signal providers covers what a track record has to show before any of it means anything, and we hold ourselves to that list.
One boundary we'll restate because it matters: signals are trade ideas with defined risk, not personalised advice. We don't know your account size or your obligations, and we're not licensed to tell you what's suitable for you. The sizing section above is how you make any signal fit your account — that translation is the member's job, and this playbook is us trying to make you good at it. If you'd rather delegate execution entirely, that's account management, a different service with different economics and, frankly, a corner of the industry with more sharks than honest operators — how those scams work is worth twenty minutes of your life before you give anyone your login.
Picking the framework that fits your actual life
Strategy selection is mostly self-honesty about three things: your schedule, your capital, and your temperament. The market doesn't care which framework you'd like to run.
Schedule. Scalping requires genuinely free attention during London morning or the NY overlap — not a phone glanced at between meetings. If gold's liquid hours land inside your workday, you are structurally unsuited to framework one, and no amount of wanting changes it. Swing trading needs twenty minutes at the daily close. Mean reversion sits between, needing alert-driven availability rather than constant watching. Most people with jobs should default to swings; most people who default to scalping do it for the entertainment, and the market charges admission.
Capital. The swing framework's $15–$30 stops set a floor. Risking 1% with a $25 stop means every $250 of account supports just 0.01 lots; below roughly $1,000, position sizes get too coarse to control risk properly, and we'd say wait and save rather than round up and hope. Scalping's tighter stops technically work on smaller accounts, but pairing the smallest accounts with the fastest framework hands your most error-prone trading to your least forgiving bankroll. Funny how the industry markets it the other way round.
Temperament. The honest questions: Can you watch an open profit halve without touching the trade? Swings. Can you take two quick stop-outs and walk away flat for the day, actually away, laptop shut? Scalps. Can you buy a level while the candle is still red and everyone on Twitter is screaming collapse? Mean reversion. If the answer to all three is no, trade none of them yet — run one framework on demo until one of those answers turns into a yes you've witnessed rather than assumed.
Whichever you choose, run it alone for at least three months before adding a second. Sixty trades of one framework teaches you more than ten trades each of three, because the pattern only emerges from repetition. And log every trade against the rules: entry, stop, size, which rule (if any) you broke. The log is where you discover that most of your losing months were rule-breaks wearing a strategy's clothing.
Where this leaves you is a short list. Pick the framework your Tuesday actually has room for. Write its rules on one page. Size so a full stop costs 1% or less. Charge your backtest real gold costs, forward-test for two months, and judge yourself on rule adherence before profit. Do that, and whether you trade your own setups or take ours alongside them, you'll be running an actual XAUUSD trading strategy rather than a borrowed forex system and a hopeful spreadsheet. Slower than the marketing promised. Considerably more durable.