Ask ten signal providers for their accuracy and you'll get ten numbers between 85% and 95%. Ask the same ten providers how they calculated it and you'll get silence, a subject change, or a screenshot of a Telegram message with a green tick on it.
That gap is the whole story of forex signal accuracy rate claims. The number itself is almost never the lie. The lie is in what got counted, what got quietly left out, and which of at least three competing definitions of "a win" the provider reached for that month. A service can tell you it runs at 92% accuracy and be technically telling the truth while losing its subscribers money hand over fist. I've watched it happen. More than once, I've watched the subscribers defend the service while it happened, because the green ticks kept coming.
So this piece does two things. First, it publishes the uncomfortable base rates: what accuracy honest providers actually sustain over hundreds of trades, why the honest range is lower than anything you'll see advertised, and why a sustained claim above roughly 75% should make you reach for your wallet with the other hand. Second, it gives you the tools to audit any number you're shown, including ours. We run a gold signal service and we publish every closed trade at /signals/history, losses included, precisely because we know how rotten the accuracy conversation in this industry is. You should not take our word for anything either. That's rather the point.
What "accuracy" even means: three competing definitions
Here's the first problem, and it's foundational. "Accuracy" has no agreed definition in the signal world, and providers exploit the ambiguity ruthlessly.
Definition one: per-trade accuracy. Of all signals issued, what fraction closed at any profit? This is the definition most subscribers assume they're being given. A signal that hit its first take-profit counts as one win. A signal that hit stop loss counts as one loss. Simple, honest, hard to game, which is exactly why almost nobody advertises it.
Definition two: per-TP accuracy. Every take-profit level that gets touched counts as a separate win. One trade with three TP levels that runs to the third target? Three wins. The stop loss that follows on the next trade? One loss. You can see where this is going, and we'll do the arithmetic properly in the next section, because it's the single biggest inflation mechanism in the industry.
Definition three: per-period accuracy, sometimes dressed up as "profitable weeks" or "green months". The provider had a profitable week, so the week counts as a win. Twelve trades inside that week, seven of them losers, doesn't matter. "40 green weeks out of 44" sounds like 91% accuracy if you say it fast enough.
There's a fourth definition lurking underneath all three, which is whatever survived deletion. Signals that stopped out get removed from the channel, or were only ever posted to a "free" channel while the VIP channel gets a different, curated history. Accuracy of the surviving sample is not accuracy. It's taxidermy.
When you see an accuracy figure, your first question is never "is it high?" It's "which of these definitions produced it?" A provider who can't or won't answer that question in one sentence has answered it anyway.
How TP ladders let one trade count as three wins
Let's do the arithmetic, because once you've seen it you can't unsee it.
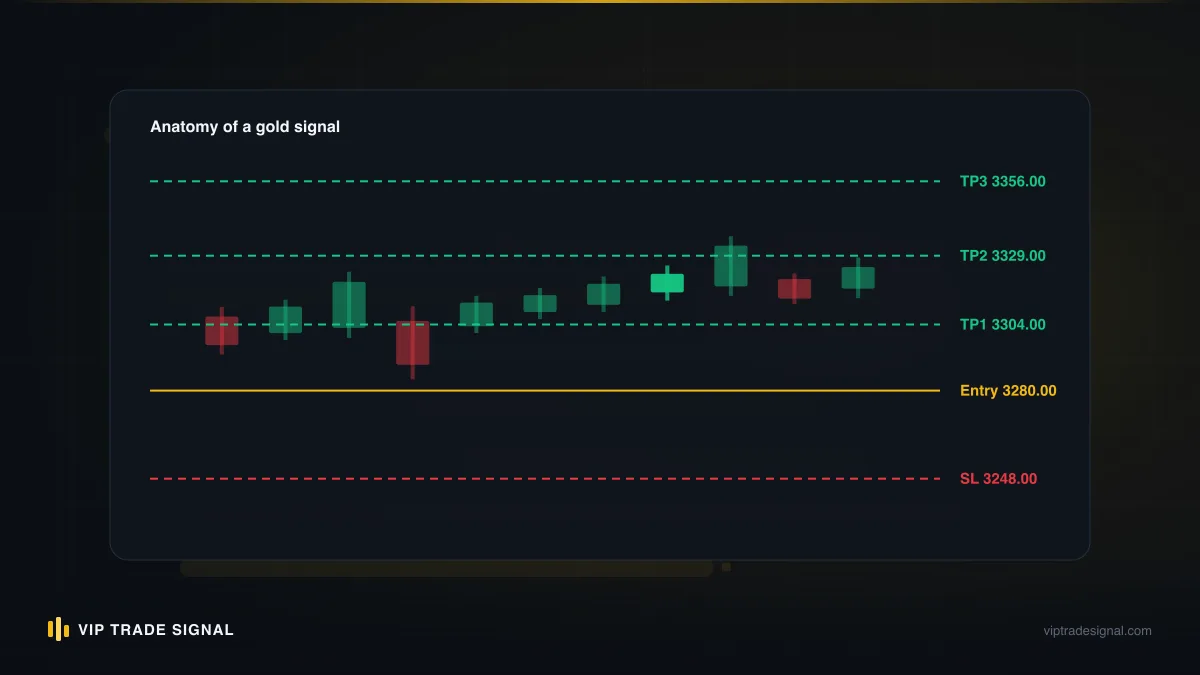
Say a provider issues gold signals with three take-profit levels and one stop loss. A typical structure: buy at 3,300, TP1 at 3,304, TP2 at 3,310, TP3 at 3,320, stop at 3,288. Nothing wrong with that structure in itself; laddered exits are a legitimate way to manage a position, and we use partial targets ourselves.
Now watch what happens to the accuracy number. Over 100 trades, suppose the honest per-trade outcome is: 40 trades reach TP1 only, 15 reach TP2, 5 run all the way to TP3, and 40 hit the stop. Per-trade accuracy: 60 winners out of 100, so 60%. Respectable. Probably profitable, depending on the distances. Not a marketing headline.
Count it per-TP instead. Those same 100 trades produce 40 + (15 × 2) + (5 × 3) = 85 TP hits, against 40 stop-outs. Now the provider reports 85 wins and 40 losses: 68%. Push a little further (count TP1 as a "win" the moment price ticks it, even if the rest of the position later stops out at entry or worse, and quietly reclassify those trades out of the loss column) and the same trading gets you into the high seventies. Same trades. Same money. Very different brochure.
The breakeven-stop trick, the ladder's quiet accomplice
There's a refinement worth knowing because it's near-universal: the move-to-breakeven rule. Once TP1 tags, the provider instructs everyone to shift the stop to entry. Sensible risk management, genuinely; we do a version of it. But watch what it does to the ledger. The trade that tags TP1 and then reverses through entry now closes "at breakeven", and breakeven trades get filed as... well, where exactly? Not losses, obviously. Usually they're either counted as wins ("TP1 secured") or dropped from the denominator entirely as "risk-free trades". Either way the loss column shrinks.
Run the numbers on a channel doing this. Suppose a third of all TP1 tags reverse and stop at entry. Under honest per-trade accounting those trades made a few cents on the partial and nothing on the rest: economically near-zero, emotionally a loss for anyone who watched a $9 open profit evaporate. Under channel accounting they're pure green. Stack that on top of per-TP counting and a 58% strategy reports comfortably above 85% without a single fabricated trade. Every individual message in the channel is true. The aggregate is fiction assembled from facts.
The really corrosive version is TP1 set absurdly close, 30 or 40 cents on gold, with a stop 12 dollars away. TP1 gets tagged constantly, the channel fills with green ticks, and the occasional stop-out wipes out fifteen TP1s' worth of profit at a stroke. The advertised accuracy climbs while the account bleeds. If you've ever wondered how a "93% accurate" channel's subscribers end up down on the year, this is how. The win rate was real, under a definition designed to make it meaningless.
What a real forex signal accuracy rate looks like
Now the base rates. This is the part providers hate, because the honest numbers are boring.
A competent discretionary or systematic provider, measured per trade, over a sample of several hundred signals, typically sustains somewhere between 55% and 70%. That's the range. Not 90. Not 85. Most of the durable services I've tracked over the years live in the low-to-mid 60s, and the genuinely excellent ones touch 70% only in kind stretches, then give some back when conditions turn.
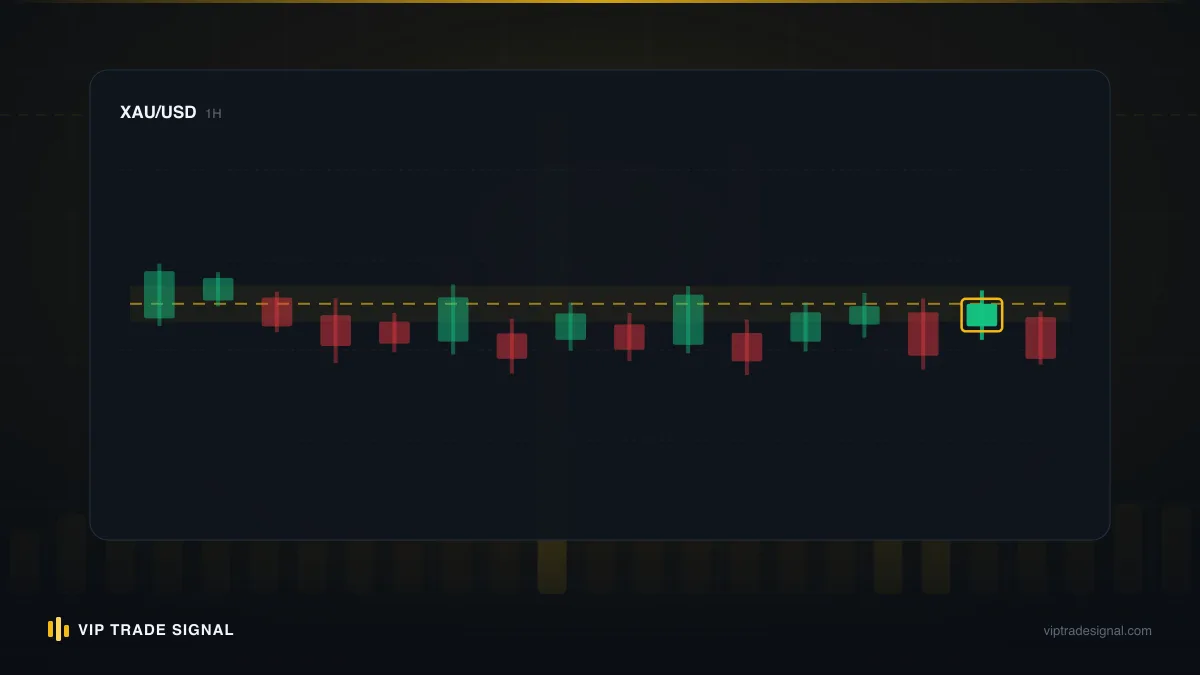
Why so "low"? Because accuracy is a dial, not a talent. Any trader can manufacture a 90% win rate tomorrow: set a take-profit one dollar away and a stop fifty dollars away, and you'll win constantly until the one loss that erases three months. Conversely a trend-following approach might win 40% of the time and be handsomely profitable because winners run four times as far as losers. The win rate a strategy sustains is mostly a function of its reward-to-risk geometry, and the geometry that makes sense for short-term gold trading (targets and stops of broadly comparable size, tilted a bit in your favour) mathematically caps sustainable accuracy in that 55–70% band.
| Advertised claim | What it usually means | Sustainable per-trade reality |
|---|---|---|
| "90–95% accurate" | Per-TP counting, curated history, or fiction | No |
| "80–85% accurate" | Tiny TPs vs huge stops, or a lucky short sample | Rarely, and rarely profitably |
| "70–75% accurate" | Possible with tight geometry, watch the R:R | Occasionally, in stretches |
| "55–70% accurate" | Nobody advertises this | Yes, this is the honest band |
Notice the tragedy in that table. The honest range is the one nobody puts on a landing page, because it loses the marketing war to the fiction. A provider telling you the truth ("we win a bit under two trades in three, and some months we don't") is competing against a dozen channels claiming 92%. The market for the most accurate forex signals is, in practice, a market for the most confident liars. That's not cynicism; it's selection pressure. The channels that survive on paid ads are the ones whose claims convert, and 92% converts.
A quick story that stuck with me. Years back, before the desk, I subscribed to two services in the same month; call them the Peacock and the Plodder. The Peacock advertised 91%, posted trophy screenshots hourly, and had forty thousand Telegram members. The Plodder advertised nothing, published a dry monthly spreadsheet, and admitted in its own FAQ to a win rate "around 60% in a good year". Three months later my Peacock sub-account was down 14% and the channel was celebrating its "best month ever". The Plodder account was up a little under 4%, which felt like nothing, until I annualised it and remembered what my own trading had been doing at the time. The lesson wasn't that modest numbers are always honest, since plenty of mediocre services hide behind humility too. The lesson was that the advertised number and my account balance were two unrelated quantities, and only one of them was ever going to pay my rent. I've checked every accuracy claim against a calculator since, and the habit has saved me more money than any signal ever made me.
Our own numbers, published and unedited
Time to eat our own cooking. VIP Trade Signal is a gold-only service (every signal we issue is XAU/USD), and every signal we have ever closed sits on our signal history page with its entry, stop, targets, and outcome. Wins and losses, in the order they happened, with nothing removed. Month by month you can compute our accuracy yourself under whichever definition you prefer, which is exactly how it should be.
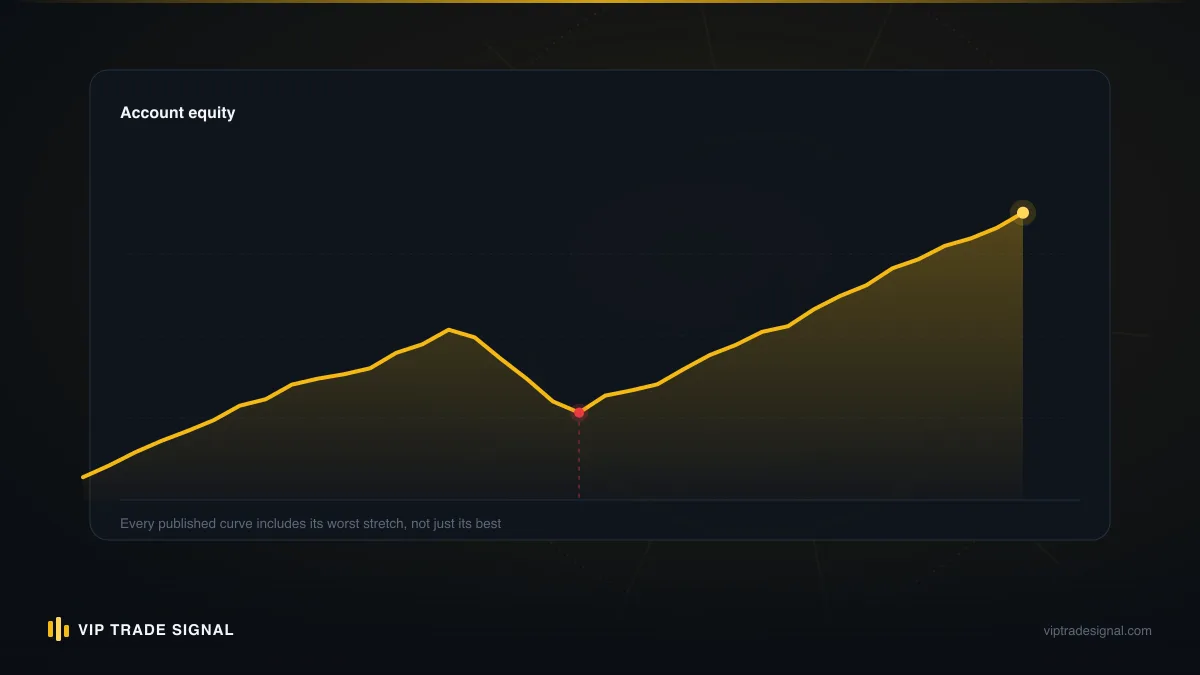
I'm deliberately not going to quote you a single headline percentage in this article, and the reason is the whole thesis of the piece: a number I type here is marketing, while a full trade log you can count yourself is evidence. What I will tell you is what you'll find when you count. You'll find months that sit comfortably in the honest band described above. You'll find months at the bottom of it. You'll find losing trades in clusters — three, four in a row sometimes — because that's what a real distribution of outcomes looks like, and any log without such clusters has been edited. And you'll find the occasional rough month sitting there in public, unexplained and undeleted, because a track record that only contains the good bits isn't a track record.
That's the deal we've chosen: publish everything, let the log argue for us, and accept that a real log will never look as pretty as an invented one. Trading gold is high-risk, losing trades are a permanent feature of the service, and anyone who joins expecting the green-tick channels' fantasy will be disappointed inside a fortnight. We'd rather disappoint that person on the pricing page than after they've funded an account.
Why sustained 80%+ claims deserve suspicion
Let me be precise about the claim I'm making, because it's often misread. I am not saying an 80% month is impossible. Over 20 trades, an honest 62% provider will occasionally print 16 winners; that's ordinary variance, and any provider with a long log can show you such months. I'm saying that sustained 80%+, across hundreds of trades and a year or more, measured per trade, is so rare that the claim itself is evidence against the claimant.
Think about what sustained 82% per-trade accuracy with sane reward-to-risk would actually mean. It would mean an edge so large that the person holding it has no rational reason to sell it to strangers for $30 a month on Telegram. Scale it privately, or sell it to a prop firm for real money. The economics of signal selling only make sense for edges that are real but modest: good enough to be worth paying for, not good enough to print money silently. So the bigger the advertised number, the worse the business logic of selling it, and the more likely you're looking at one of four things: per-TP counting, deleted losers, a stop-to-target ratio that guarantees eventual ruin, or an account that has simply never been through a hostile market.
There's a fifth possibility worth naming: the short lucky streak, honestly reported. A new provider three months in, riding a trending market that suits their style, can genuinely be at 78% and genuinely believe it's skill. The market will educate them. Your job is not to pay tuition for their education. Anything above roughly 75% sustained deserves suspicion (not outrage, suspicion), and the response to suspicion is an audit, which we'll get to. We wrote up the broader anatomy of dishonest providers in our piece on forex signal scams, and inflated accuracy is the front door to nearly all of them.
A 92% win rate isn't a track record. It's a definition of "win" you haven't been shown yet.
Accuracy by signal style: scalps vs swings
Accuracy also isn't one number per provider; it's one number per style, and comparing across styles without adjusting is how people end up subscribed to the wrong service.
Scalp-style signals (in gold terms, targets of maybe $3–5 against stops of similar or slightly larger size, held minutes to hours) naturally run higher win rates. The target is close, so price tags it often. A scalping approach sustaining 65–70% per trade is plausible. But each win is small, spreads and slippage eat a meaningful slice of every trade, and the occasional stop-out takes back several wins at once. High accuracy, thin margins, brutal sensitivity to execution quality. If your broker's gold spread is 35 cents instead of 20, a scalp service's edge can vanish entirely for you while remaining real for someone else. Which is one reason two subscribers to the same "accurate" service report opposite results.
Swing-style signals (targets of $15–40, stops of $8–15, held days) run lower win rates, often 45–60%, because the target is far away and plenty of good entries get shaken out en route. But each winner pays for two or three losers, execution costs are a rounding error, and the equity curve depends far less on catching the entry within seconds.
Picture a trader we'll call Sam, who works shifts and checks his phone on breaks. Sam subscribes to a scalp channel with a genuinely honest 67% record. The signals land at 9:40, Sam sees them at 10:15, and gold has already travelled $6. Half the time the trade is over; the other half Sam enters late at a worse price, which converts winners into breakeven trades and breakeven trades into losers. After two months Sam's personal win rate on the same signals is under 50%, and he concludes the service lied. It didn't. The accuracy was real and structurally unavailable to him. Had Sam picked a swing service with a "worse" 55% record and entries that stay valid for hours, he'd likely have captured nearly all of it. Accuracy you can't execute is a rumour.
Neither style is "more accurate" in any sense that should matter to you. A 68% scalper and a 52% swing trader can produce identical returns with identical risk. The question is which style fits your life. If you can't be at a screen within a minute of a signal landing, a scalp service's accuracy is unreachable for you no matter what the channel's history says: the wins happen, just not in your account. We covered that gap in detail in why your results differ from the provider's, and it's a bigger driver of subscriber outcomes than the headline win rate ever is. Our own signals sit mostly in the middle of this spectrum, and the mix is visible in the history log.
Gold-specific accuracy: what volatility does to win rates
Since we trade nothing but gold, it's worth being specific about what XAU/USD does to accuracy, because gold signals accuracy has its own physics, and numbers imported from EUR/USD comparisons mislead.
Gold moves. A normal day's range is routinely $20–40; a data-driven day can triple that. Volatility cuts both ways for a win rate. In its favour: targets get reached. A $10 target on gold is an ordinary afternoon, where the equivalent-percentage move on a major pair might take a week. Trends, when they arrive, extend far enough to pay a laddered exit handsomely. Against it: stops get reached too. Gold's habit of spiking through a level and reversing (tagging your stop by 40 cents before running to the target without you) is legendary among people who trade it and invisible in any provider's advertised number. Wider stops defend against the spikes, but wider stops mean bigger losses per stop-out and force smaller position sizes.
The practical consequence: honest gold services tend to sit in the same 55–70% band as everything else, but with more month-to-month wobble around the average. A quiet, rangey summer month can print a lovely win rate; a month with a hot CPI print and a geopolitical scare can drag the same strategy briefly under 50% without anything being broken. So when you evaluate the most accurate gold signals on offer, weight the sample-size question (coming next) even more heavily than you would for a slower instrument. A gold provider's 30-trade hot streak means even less than usual. And distrust any gold service whose monthly accuracy barely moves; on this instrument, a flat line is the fingerprint of curation, not consistency.
Sample size: when an accuracy number becomes meaningful
Here's a quick exercise that recalibrates people. Take a coin weighted to 60% heads, a genuinely good signal service in effect. Flip it 20 times. You'll get 20 heads out of 20 essentially never, but you'll get 15 or more (75%+) about one time in five, and 10 or fewer (50% or worse, i.e. the good service looking bad) roughly one time in eight. Twenty trades tells you almost nothing. It can dress a decent service up as a miracle or down as a dud, and it does both constantly.
At 100 trades the picture sharpens but doesn't settle: a true 60% service will still land anywhere between the low 50s and high 60s fairly often. It takes 200–300 trades before the measured rate reliably sits within a few points of the truth, and that's assuming the strategy itself isn't drifting underneath the measurement, which it always somewhat is.
Now hold that against how accuracy is actually marketed. "87% win rate last month": perhaps 22 trades. "9 wins in a row this week": nine trades, and streaks of nine happen routinely to 60% coins. The screenshot economy runs almost entirely on sample sizes that a first-year statistics student would laugh out of the room. Some rules of thumb worth keeping:
- Under 50 trades: ignore the number entirely. It's weather, not climate.
- 50–150 trades: read it as a wide range, mentally add "give or take ten points".
- 200+ trades across different market regimes: now it's evidence.
- Any sample that starts at a suspiciously convenient date ("since March") is a cropped sample. Ask what happened before March.
There's a subtler sample-size trap worth flagging too: survivorship across providers, not just across trades. Imagine a hundred mediocre channels launch this year, each a true coin-flip. After 30 trades, pure chance hands a dozen of them win rates above 65%; those dozen screenshot their luck, buy ads, and grow. The rest die quietly. Next year the survivors' luck reverts, a new lucky dozen replaces them, and the directory of "top-performing signal providers" refreshes itself with fresh accidents. Nobody in this pipeline needs to lie for the visible market to be systematically flattered. When you browse a list of high-accuracy services, you are not sampling the industry; you are sampling its luckiest recent tail. Which is one more reason a long, dull, continuous log beats a spectacular short one every single time.
The regime point matters as much as the count. Three hundred trades logged entirely inside one smooth uptrend still constitute one observation of one market. You want to see the number survive a rate-shock month, a dead-quiet range, and a trend reversal before you believe it belongs to the provider rather than to the conditions.
Accuracy vs profitability: the missing link is expectancy
And now the section that should honestly have come first, except nobody would have read it: accuracy, even measured honestly over a proper sample, is the wrong headline number. The number that decides whether a service makes money is expectancy: average win times win rate, minus average loss times loss rate.
Two illustrative services. Service A wins 80% of the time; average winner $4 (on one lot, say), average loser $18. Expectancy per trade: 0.8 × 4 − 0.2 × 18 = 3.20 − 3.60 = −$0.40. Eighty percent accurate and a guaranteed slow bleed, before you've paid the subscription. Service B wins 50% of the time; average winner $14, average loser $8. Expectancy: 0.5 × 14 − 0.5 × 8 = +$3.00 per trade. Half the accuracy, infinitely better service.
This is not a contrived edge case. Service A is a fair sketch of the standard high-accuracy Telegram channel: tight TP1, distant stop, glowing win rate, negative expectancy. Its subscribers experience months of small pleasant wins punctuated by stop-outs that mysteriously seem to erase everything, and because each individual week felt fine, they blame themselves. The win rate was the anaesthetic.
So when someone asks me what is a good win rate for forex signals, my honest answer is: on its own, there isn't one. A 45% win rate can be excellent and a 90% one can be poison. The pair of numbers you actually want from any provider is win rate and average-win-to-average-loss ratio, over 200+ trades. From those two you can compute expectancy in thirty seconds, and expectancy, minus your costs (which is where our piece on what signals cost all-in picks up the thread), is the number your account balance obeys. Everything else is decoration.
How to measure a provider's true accuracy yourself
Enough theory. Here's the audit procedure, and it works on any provider with a visible history, including us.
- Fix the sample before you look at it. Decide in advance: every signal issued between two dates, no exceptions. If the provider's history can't give you that, because signals are only visible for a week or the channel's old messages are deleted, the audit is over and so is your interest. A history that can't be sampled can't be trusted.
- Log every signal into a spreadsheet: date, direction, entry, stop, each TP, and the outcome. Tedious? Yes, about an hour per hundred trades. It's also the only hour of due diligence most subscribers never spend, on a service they'll pay hundreds a year for.
- Score per trade, once. A trade that hit any TP before the stop is one win; record which TP, and what the realistic exit was. A trade that hit the stop is one loss. A trade that was "cancelled" after moving against the entry is a loss for audit purposes; watch how often that category appears, because "cancelled" is where embarrassing trades go to die.
- Compute three numbers: per-trade win rate, average win in dollars-per-lot, average loss in dollars-per-lot. Then expectancy. Then, separately, compute the provider's advertised accuracy under their own counting method and see how far apart the two figures sit. The gap is the marketing coefficient.
- Check the clustering. Real trading produces losing streaks; a 60% service will run four losses in a row somewhere in any 100-trade sample, and five or six across a few hundred. A log with no streaks has been laundered.
Two refinements make the audit sharper. First, score each trade at the price you could plausibly have got, not the provider's stamped entry. If signals routinely arrive after the move has started, knock a realistic amount of slippage off every result and watch how many marginal winners flip. An audit at the provider's prices measures their trading; an audit at your prices measures your future. Second, forward-test rather than back-read where you can. Reading a history invites hindsight comfort; logging signals live for a few weeks on a demo account, executing them exactly as instructed, gives you the same numbers plus the one thing no history page contains: how the service feels to follow at 2 a.m. when a stop is three dollars away. Plenty of subscribers can afford a service's losses and can't stomach its open drawdowns. Better to learn that on paper.
Do this over at least two months of live signals (free channels, trial periods and public history pages make it costless) before a penny changes hands. Our signal history is laid out precisely so this exercise takes minutes rather than hours, and if you're comparing several services at once, the provider comparison framework turns the same audit into a side-by-side scorecard.
Questions to ask about any advertised accuracy figure
If the full audit is more than you'll realistically do (fine, most people won't), then at minimum put these questions to any provider whose number you're tempted to believe. The answers matter less than the manner of answering. Honest providers find these questions boring; dishonest ones find them offensive.
- "Is that figure per trade, per TP level, or per week?" One sentence should suffice. Watch for a paragraph.
- "Over how many signals, and between which dates?" A number and two dates. "Since we started" with no start date is not an answer.
- "What's your average winner and average loser, in pips or dollars?" This is the expectancy question wearing a casual shirt. A provider who tracks their own performance knows these numbers cold.
- "What was your worst month, and can I see it?" Every honest track record has one. A provider with no worst month has no track record.
- "How do you count trades where TP1 hit and the remainder stopped out at entry or below?" This single question exposes the ladder-counting scheme faster than any other.
- "Where can I see every signal from a month of my choosing?" Not their choosing. Yours.
Six questions, two minutes to ask. In my experience the field of candidates thins by about ninety percent at question two, an industry commonplace I'd love to be wrong about. The providers still standing afterwards may not advertise the shiniest numbers. That's rather the point. You're not looking for the biggest number; you're looking for the provider whose number survives contact with its own definition.
Reading our history page like an auditor
Let me close by turning the audit gun on ourselves, because if this article has a thesis it's that no provider, us included, deserves belief without verification.
Open /signals/history and read it the way this article taught you to. Fix a window: say, the last full quarter. Count per trade, not per tick of TP1. Note which TP each winner reached, and what each stop-out cost against what the winners paid. Find the losing streaks; they're there, in public, because gold hands them to everyone eventually and we don't delete ours. Compute the win rate for your window, then compute it again for a different window and notice that the two numbers differ, because real performance breathes. Then do the expectancy arithmetic and decide whether the geometry, not the green ticks, earns a place in your trading.
While you're at it, hold us to the economics too. The service is $99 a month for unlimited gold signals, or free if you trade through one of our partner brokers with $250 maintained, and that fee sits at the high end of the market precisely because everything is pay-as-you-go with low minimums, which we're upfront about on the about page. Whether that's worth it isn't a function of any accuracy claim we could make. It's a function of the log, your costs, and your honesty with yourself about whether you'll follow the signals as issued (stop, targets, sizing and all), since a subscriber who overrides half the trades has an accuracy rate all of their own, and it's rarely better.
One last thing. If you take nothing else from five thousand words: the next time a number like "94% accurate" crosses your screen, don't ask whether it's true. Ask what it's counting. The first question has no checkable answer. The second one always does, and the industry is banking, literally, on you never asking it.