A trader we'll call Priya messaged us last spring, genuinely confused. CPI had come in hot. Inflation up, gold is an inflation hedge, so gold should rally. She bought the print. Gold dropped $28 in forty minutes and stopped her out, and she wanted to know whether the market was broken or she was.
Neither. She just had the causal chain wrong, and she's in good company, because most of what retail traders believe about what moves gold prices is a half-truth wearing a suit. Gold rises with inflation, except when it doesn't. Gold moves opposite the dollar, except on the days both rally together. Gold loves a crisis, except for the crises where it sells off first. If you trade XAUUSD on the slogans, the market will invoice you for the difference between the slogan and the mechanism.
This piece is the mechanism. Not an economics lecture, a mapping: each driver, what it actually is, how gold tends to behave on the chart when that driver fires, and, crucially, when the textbook relationship breaks. It's the same framework our desk uses before any signal goes out, and by the end you should be able to look at a trading day and name which driver is holding the steering wheel. That alone puts you ahead of most people paying for a signal service, including, frankly, some people paying for ours.
What moves gold prices: the five drivers ranked by force
Strip away the noise and five forces account for nearly everything gold does on a weekly timeframe. Ranked roughly by how much force each exerts, most days:
- Real yields: the return on US government bonds after inflation. The gravitational field everything else operates inside.
- The US dollar: gold is priced in dollars, so the dollar's own strength is baked into every tick.
- Federal Reserve policy: the machine that manufactures both of the above, which is why Fed days are the loudest days on the gold calendar.
- Fear: geopolitics, banking wobbles, safe-haven flows. Violent but usually short-lived.
- Central bank buying: the slow, structural bid underneath the market. Barely visible intraday, enormous over years.
Notice what's not on the list. Jewellery demand. Mining supply. Indian wedding season. These matter to the physical market over decades, but if you're trading XAUUSD on a four-hour chart they are close to irrelevant. Annual mine production adds roughly 1.5% to the total above-ground stock of gold in a good year. A commodity where almost all historical supply still exists in vaults and drawers doesn't trade on this year's supply. It trades on how badly the world's money wants to own it, and that want is set by the five forces above.
One more framing before we go driver by driver. Gold pays you nothing. No dividend, no coupon, no rent. Every valuation argument for gold is really an argument about the cost of holding it instead of something that pays. Hold that thought, because it's the key that unlocks nothing (sorry, wrong register) — it's the thought that makes the first and heaviest driver make sense.
Real yields: the driver professionals watch first
Ask a retail trader what moves gold and you'll hear "the dollar" or "inflation". Ask someone at a macro fund and you'll hear two words: real yields.
A real yield is a bond yield minus expected inflation. The cleanest proxy is the yield on 10-year US Treasury Inflation-Protected Securities, TIPS, which you can look up free on the St. Louis Fed's FRED database under DFII10. When the 10-year TIPS yield is 2%, an investor can park money with the US government and earn 2% above inflation, risk-free in nominal terms. When it's minus 1%, as it was for stretches of 2020 to 2022, holding government bonds guarantees losing purchasing power.
Now apply the earlier thought. Gold yields zero. Zero is a terrible return when the risk-free alternative pays +2% real. Zero is a magnificent return when the alternative pays −1% real. So gold tends to move inversely to real yields: real yields fall, the opportunity cost of holding gold falls, gold rises. Real yields rise, gold gets expensive to hold, gold falls. Overlay a gold chart on an inverted DFII10 chart from 2007 onwards and the fit is uncomfortably good for anyone who thought gold traded on mystique.
How does this cash out intraday? Real yields don't just drift, they jump on data. A hot US jobs report pushes rate expectations up, nominal yields up, usually real yields up, and gold gets hit, often within seconds of the 13:30 London print. A soft CPI number does the opposite. The gold candle you see at 13:30 on a data day is mostly a real-yield candle wearing a gold costume.
Two practical notes. First, the relationship is about changes, not levels. Gold rallied through 2023 and 2024 with real yields near 2%, which broke a lot of models, and we'll get to why in the central bank section. Second, watch the 10-year TIPS yield rather than the headline 10-year Treasury. The nominal yield can rise because inflation expectations rose, which is roughly neutral-to-positive for gold, or because real yields rose, which is negative. Same headline, opposite trade. Traders who only watch nominal yields get whipsawed by exactly this and blame the market for it.
If you follow signals, ours or anyone's, this driver explains something that puzzles newcomers: why a technically perfect setup gets cancelled an hour before a big US data release. It isn't cowardice. It's that a support level built during a quiet real-yield regime carries no information about where price goes when the regime lurches. We'd rather skip a trade than sell you confidence we don't have, which is roughly the whole philosophy behind how we run the signal desk.
The dollar correlation, and when it inverts
Gold is quoted in US dollars, so XAUUSD is really two prices stapled together: what gold is worth, and what a dollar is worth. If the dollar weakens against everything, gold "rises" in dollar terms even if nothing changed in gold itself, the same way your height in centimetres goes up if someone shortens the centimetre.
That's the mechanical part of the famous gold and US dollar inverse correlation, and it's real. Over most rolling one-year windows, gold and the dollar index (DXY) are negatively correlated, often in the region of −0.3 to −0.5. Dollar down days are, more often than not, gold up days. If you take one rule from this section, take the boring one: before you act on any gold setup, glance at DXY. A gold long into a dollar that's breaking out upwards is a tug-of-war where you've picked the lighter team.
But the correlation is a tendency, not a law, and it inverts in exactly the conditions people most need it to hold. Genuine fear is the classic case. In a proper risk-off event, a war escalation, a banking scare, global money runs to both classic havens at once: US dollars and gold. March 2022 after the invasion of Ukraine saw gold and DXY rallying together for days. Anyone short gold "because the dollar's strong" was mixing up a fair-weather correlation with a mechanism, and it cost them.
The other inversion is when the dollar's move is driven by weakness elsewhere. DXY is 57.6% euro. If the euro slides because the ECB turned dovish, DXY rises without US real yields moving at all, and gold often just shrugs. Dollar strength born in Washington, from hawkish Fed policy, hits gold hard. Dollar strength born in Frankfurt or Tokyo frequently doesn't. Same DXY candle, different gold outcome, and the difference is which central bank caused it.
So use the dollar as a headwind-or-tailwind check, not a signal generator. When DXY and real yields point the same direction, gold usually obeys. When they argue, real yields win more often than not, and when fear is on the table, fear outranks both.
Fed decisions: the path from statement to gold candle
Eight times a year the Federal Open Market Committee meets, and those Wednesdays are reliably among the most violent on the gold calendar. It's worth walking the whole chain slowly, because how Fed rate decisions affect gold is less about the decision than about the surprise, and traders who don't grasp that keep getting run over by moves that look irrational.
Start with the boring truth: the rate decision itself is usually priced in. Markets trade probabilities continuously via fed funds futures (the CME FedWatch tool shows them free), so if a cut is 95% expected and delivered, the delivery itself moves nothing. What moves gold is the gap between what was priced and what arrived, across four releases that hit in sequence:
- 19:00 London: the statement. Algorithms parse the changed words within milliseconds. A single softened phrase about inflation can be worth $15 on gold before a human finishes reading the sentence.
- 19:00, quarterly: the dot plot. Each member's projection of future rates. Dots shifting lower means lower expected yields, gold positive. The dot plot regularly matters more than the decision.
- 19:30: the press conference. Forty-five minutes of a Fed chair answering questions, any one of which can flip the market. It is completely normal for gold to fully reverse its statement move during the presser.
- The days after. Other Fed speakers "clarify", and the market settles on its considered interpretation, which sometimes contradicts the first reaction entirely.
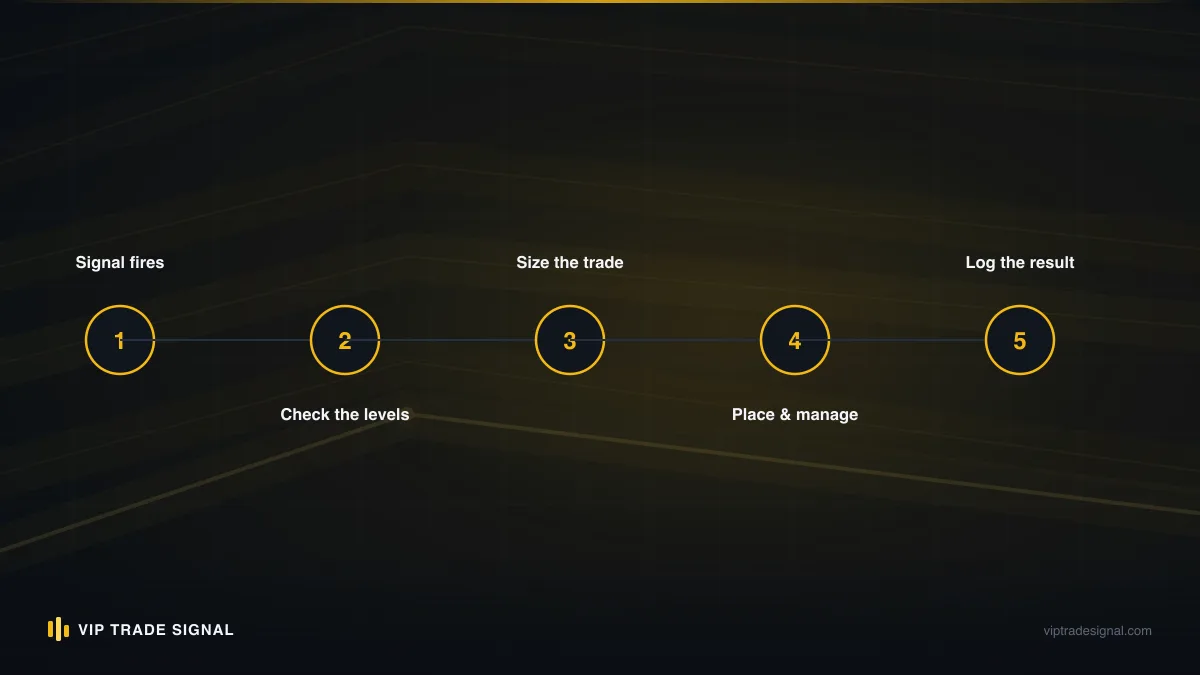
The tradeable insight sits in that structure: the first move is frequently the false move. A classic Fed Wednesday sees gold spike $20 on the statement, give it all back during the press conference, then spend two days grinding in the opposite direction to the initial pop. The spike was algorithms reading keywords; the grind was humans reading meaning. Spreads on XAUUSD also blow out around the release, sometimes from 20 cents to $2 or more, so a stop that looked sensible at 18:55 can be executed dollars away from where you placed it.
Our house rule, and we'd argue it should be yours: no fresh positions in the last hour before an FOMC statement, and no faith in the first fifteen minutes after it. Say you're long from 3,320 with the statement due and price at 3,338. Flat-out closing, or at minimum banking half and moving the stop to entry, beats "let's see what happens" nine times out of ten in expectancy terms, even though the tenth time will annoy you for a week. Nobody's win rate survives routinely gambling through binary events, and if you want the arithmetic on why, the piece on win rate versus risk-reward walks through it properly.
One more Fed subtlety: cuts are not automatically bullish for gold. A cut delivered because inflation is beaten, with the Fed signalling a long pause, can raise real yields at the long end and knock gold down. A cut delivered in a panic, with more promised, crushes real yields and sends gold vertical. The word matters more than the number. Always has.
The inflation hedge: the truth behind the slogan
"Gold is an inflation hedge" is the most repeated sentence in gold marketing, and it's the one most likely to lose you money if you trade it literally, as Priya found out at the top of this article.
Over decades, the slogan holds up reasonably well. Gold has broadly kept pace with, and often beaten, inflation across the last half century, and it did so spectacularly across the 1970s. If your horizon is twenty years, fine, gold as an inflation hedge is a defensible idea.
Over the horizon you actually trade, it's nearly backwards. Recall the chain from the real-yields section: what matters is inflation relative to the policy response. When inflation runs hot and the central bank chases it with aggressive hikes, real yields rise, and rising real yields are gold's kryptonite. That is precisely what happened in 2022. US inflation hit 9.1%, its highest in four decades, textbook gold heaven, and gold fell from around $2,070 in March to under $1,630 by November, a drawdown north of 20%, because the Fed hiked harder than inflation rose. Everyone positioned for the slogan got the mechanism instead.
So when does inflation genuinely light gold up? When the market believes the central bank can't or won't fight it. Inflation running at 6% with rates pinned near zero, the 2021 configuration, means deeply negative real yields, and gold loves nothing more. The slogan should really read: gold hedges the suspicion that your central bank has lost the plot. Less catchy. More accurate.
For the trader, this collapses to one habit: never trade the CPI number, trade the number through the expected Fed response. A hot print that markets think forces another hike is gold-negative on the day, whatever the slogan says. A hot print landing when the Fed has already signalled it's done hiking means real yields fall while inflation runs, and gold flies. Same headline, opposite candle, and the difference is entirely about what the print does to the policy path.
Geopolitics and safe-haven spikes: tradeable or not
Missiles fly, gold jumps. This is the driver everyone knows, the one that writes its own headlines, and it's the one we'd tell you to be most careful trading.
The pattern is real. Major geopolitical shocks reliably produce a gold spike: money wants an asset with no counterparty, no government, no default risk, and five thousand years of habit says that asset is gold. The spike is usually violent, often $30 to $50 inside a session for a serious escalation, and it frequently happens in thin hours, Sunday opens and Asian sessions, when the news breaks and liquidity hasn't arrived to absorb it.
Here's the uncomfortable statistics of it, though: most pure fear spikes retrace, and quickly. The market's dark little proverb is "buy the rumour of war, sell the first shot". Once an event is on every front page, the fear is priced within hours, and unless the situation keeps escalating, gold bleeds back toward where the drivers that actually hold it, real yields, the dollar, the structural bid, say it belongs. Trace enough of these events and the shape repeats: vertical spike, a day or two of headline chop, then a fortnight of slow retracement as attention fades. Chasing the spike two hours after the headline is buying the top of a move built on emotion with your entry provided by someone exiting theirs.
What fear can do is more subtle and more useful. A drawn-out conflict resets the floor. Rather than one spike, you get a persistent bid under every dip, because a slice of global capital has permanently decided to hold more gold until the world calms down. You see it in the character of the chart: pullbacks get shallower, support levels hold on the first touch, bad-for-gold data produces smaller down candles than it should. That regime change is tradeable. The headline spike mostly isn't.
Run the scenario as a trader rather than a spectator and the problem gets clearer. A headline breaks at 02:00 London, gold gaps $18 in ninety seconds, and your finger hovers over buy. Ask three questions first. What's the spread right now? In those minutes it can be five times normal, so your effective entry is worse than the chart shows. Where does a stop go? Under a spike low that formed in panic liquidity is not a level, it's a lottery ticket, and a stop wide enough to be meaningful makes the position enormous in risk terms. And who's selling to you? Often someone who bought the first headline two hours ago at $25 lower and is delighted you've arrived. None of that means fear moves are untradeable, but it means the honest trade is usually the second reaction: wait for the spike, wait for the retrace, and if the situation is genuinely still escalating, buy the higher low it leaves behind, with a stop that lives at a level rather than a memory.
Our desk's rule of thumb: we don't chase headlines, ever, and any signal live when a genuine shock hits gets managed defensively rather than greedily, because spread and slippage in those minutes can double your intended risk without asking permission. Every one of those decisions ends up in the open ledger at /signals/history, including the ones where caution cost us a winner. It does, sometimes. We'd rather show you that than pretend.
Central bank buying: the slow structural bid
Now for the quiet driver, the one that broke everybody's models in 2023 and 2024, ours included for a stretch.
Since 2022, central banks, led by China, Poland, Turkey, India and a rotating cast of others, have been buying gold at a pace of roughly a thousand tonnes a year, about double the average of the preceding decade. The stated and unstated reasons vary: reserve diversification, de-dollarisation after Western sanctions froze Russia's currency reserves, plain institutional caution. The effect on the chart doesn't vary. It's a huge, price-insensitive, one-directional bid sitting under the market.
Price-insensitive is the phrase to hold onto. A central bank rebalancing reserves doesn't wait for a pullback to 3,280 or fret about the RSI. It buys, on schedule, in size, through good prices and bad. And that rewrote the rulebook: 2023 and 2024 delivered gold at all-time highs while real yields sat near 2%, a combination the previous fifteen years of data said shouldn't happen. Anyone mechanically shorting gold because "real yields say it's overvalued", and plenty of professionals did, spent two years being carried out sideways. The correlation hadn't died. It was overpowered by a buyer the regression never met.
You can't trade this driver day to day. Reserve data arrives quarterly, partially, and some buyers under-report as policy. What it changes is your prior. In a heavy central-bank-buying regime, dips get bought harder than models predict, breakdowns fail more often than they should, and the pain trade lives on the short side. It shifts the baseline that every faster driver oscillates around. Ignore it and every technical short you take is fighting a bidder with a printing press and no stop loss.
Why correlations break exactly when you need them most
By now you've noticed every section carries an exception clause. Dollar inverse, except in crises. Inflation hedge, except when the Fed fights back. Real yields rule, except when central banks overpower them. This isn't sloppy writing. It's the single most important thing on this page.
Every gold correlation is a fair-weather friend: reliable in the regimes that formed it, and absent the day the regime changes.
Correlations aren't physics, they're by-products of whichever driver currently dominates. When real yields are the market's obsession, the gold and dollar relationship looks beautifully inverse, because both are being driven by the same Fed expectations. Then a war starts, fear takes the wheel, and the correlation flips overnight, not because anything "broke" but because the driver generating it got shoved aside. The correlation was never the cause. It was the shadow of the cause, and shadows move when the light does.
This is why regime change is where accounts die. A trader spends six months profitably fading gold every time DXY pops, the pattern works twenty times, position sizes creep up, and then the one day both rally together, usually a dramatic day with spreads wide and stops slipping, hands back months of profit. The strategy didn't gradually decay. It worked right up until the regime that powered it ended, and the ending arrived without a press release.
The defence isn't clairvoyance, it's humility, applied in three ways. Size every trade as if the correlation could fail on this one, because eventually it will; risking 1% instead of 3% is the whole difference between a regime change that bruises you and one that removes you, and if you're unsure what that means in lots on gold, the XAUUSD lot size calculator guide exists for exactly that. Watch for early tells that the driver hierarchy is shifting: gold ignoring a data point that "should" have moved it $15 is the market quietly telling you the old driver has lost the wheel. And treat any strategy back-tested inside one regime as unproven outside it, because that's precisely what it is.
From driver to trade: reading today's dominant driver
Theory's lovely. Here's the Monday-morning version, the part we actually do before the week's first signal is even considered.
The question is never "is gold bullish or bearish". The question is "which driver is dominant right now, and what does gold do when that driver fires". Answering it takes four checks and maybe ten minutes:
- The calendar. Is this a Fed week, a CPI week, a jobs-Friday week? If yes, the event is the sun and everything orbits it: expect drift and chop before, violence during, and a real move after. A quiet calendar hands the wheel to flows and technicals, and ranges get respected far more.
- The 10-year real yield, five-day trend. DFII10 on FRED, thirty seconds. Falling steadily equals tailwind for longs. Rising steadily, headwind. Flat, this driver is off duty today.
- DXY versus gold, last week. Moving opposite? Normal regime, the correlation is your friend. Moving together? Fear is in charge, and every mean-reversion assumption gets suspended until they decouple.
- The fear temperature. Anything actively escalating? Not "does something bad exist somewhere", something always does; is a specific situation getting worse this week? Only escalation moves price. Steady-state bad news is already in it.
Run the checks and most weeks sort themselves into one of three postures. Aligned: real yields falling, dollar soft, calendar quiet, and dips into support are buyable with the current at your back. Conflicted: drivers arguing, say yields falling but DXY grinding up, and you halve size or stand aside, because chop is the natural output of a divided market. Event-dominated: a Fed or CPI date mid-week, and you trade small before it, never through it, and let the post-event dust settle before trusting a level again.
Worth making concrete. Take a hypothetical Tuesday: FOMC tomorrow, DFII10 has ticked down four sessions running, DXY is drifting lower, no live escalation anywhere. That's aligned-but-event-dominated, and the read writes itself: the drivers lean bullish, so a dip into a clean four-hour support this morning is takeable, but at half size, with the position closed or trimmed to a free trade by tonight, because whatever the chart says at 18:00 tomorrow, the statement at 19:00 outranks it. Compare that with the same chart on a quiet week and the identical setup deserves full size and room to run for days. Same candles, same level, completely different trade, and the difference came entirely from ten minutes of driver-reading that never touched an indicator.
The reverse case matters just as much. Suppose the setup is gorgeous, a textbook double bottom at prior support, but real yields have risen all week and DXY just broke out of a two-month range to the upside. That long can still work. Levels do hold against the current sometimes. But you're now betting on the exception, so either skip it or cut the size until being wrong is boring. Most of the improvement available to a retail gold trader isn't finding better entries. It's declining good-looking entries that swim against the dominant driver.
Notice what this does to your psychology, too. When you know a $12 red candle at 13:31 was a real-yield reaction to a data beat, you stop experiencing gold as random malice and start experiencing it as a machine with inputs. Traders who can name the driver hold their plan through noise. Traders who can't see every candle as a personal message and trade accordingly, which is to say, badly.
Why we don't publish "buy or sell today" forecasts
Type "XAUUSD forecast today" into a search engine, plenty of people find this article that way, and you'll get pages of confident daily calls: gold will test 3,350, buy above 3,342, target 3,367. Precision everywhere. Accountability nowhere. Almost none of those sites keep a public record of yesterday's confident call, for the excellent commercial reason that the record would be roughly a coin flip and the product would die of honesty. A daily directional forecast is content marketing wearing a lab coat.
We don't publish them, and after everything above you can see why it's a structural refusal, not false modesty. Gold's next move belongs to whichever driver fires next, and nobody knows Thursday's CPI print or Saturday's headlines on Monday. What a professional desk actually produces isn't prophecy, it's conditional trades: a defined entry that's only taken if price gets there, a stop that caps the damage when the read is wrong, a target that pays for the times it's right, sized so that no single outcome matters much. The honest unit of output is not "gold will rise". It's "here is a spot where the drivers and the level line up well enough that risking one unit to make two is a good bet, and here is exactly where we're wrong".
That's the entire difference between a forecast and a signal, and it's why every one of ours arrives with the stop and target attached and lands in a public ledger afterwards, losers included. If someone selling you daily certainty won't show you their last hundred calls with dates on, you already know what the record looks like. What a properly structured gold signal contains, and how to judge one, is a topic we've covered on its own at /blog/xauusd-signals.
A weekly driver review that takes twenty minutes
You don't need a Bloomberg terminal to trade gold with the drivers instead of against them. You need a Sunday-evening habit. Here's ours, trimmed to what a signal follower genuinely needs, twenty minutes with free tools:
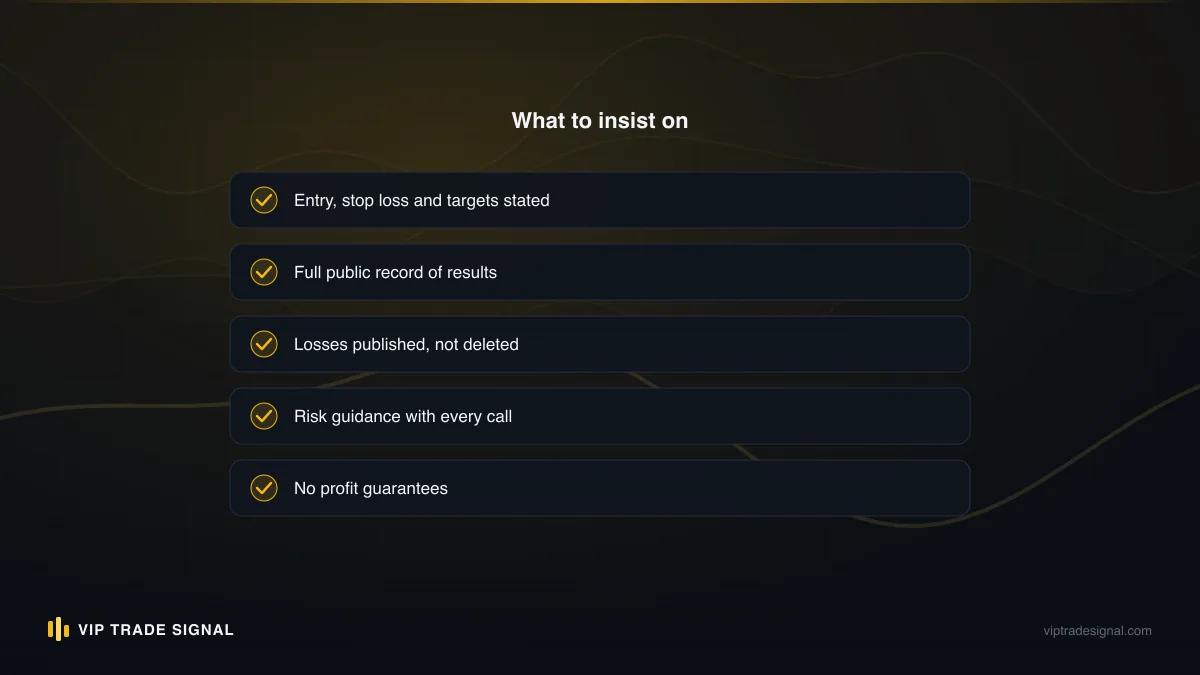
- Mark the landmines (5 min). Open any free economic calendar, filter for high-impact USD events, and write the times of FOMC, CPI, NFP and PCE releases where you'll see them. These are the hours you won't open fresh risk, decided now, calmly, not at 13:25 with a setup glowing at you.
- Check real yields (3 min). FRED, DFII10, five-day and one-month view. Direction, not level. Write one word: tailwind, headwind, or neutral.
- Check the dollar (3 min). Weekly DXY candle, and whether it's confirming or fighting gold. Note which regime you're in: normal inverse, or moving-together fear mode.
- Scan the fear (4 min). Two minutes of headlines with one question only: is anything escalating? Resist the doom-scroll; you're taking a temperature, not writing a thesis.
- Write the bias (5 min). One sentence, before the week opens: "Drivers lean bullish, quiet calendar until Thursday CPI, longs at support preferred, flat by Wednesday night." Ten seconds to read on Wednesday when a candle is trying to talk you out of your plan, and worth more then than any indicator on your chart.
The point of writing it down isn't ceremony. It's that mid-week you will be tempted to improvise, and the note is a message from a calmer version of you who had all the information and none of the adrenaline. When a signal arrives mid-week, ours land as exact levels with the reasoning attached over at /signals, you'll find you read it differently: not "do I feel lucky", but "does this align with the tailwind I already identified, and does the timing avoid the landmines I already marked". Same signal, better follower. And since gold and leveraged CFDs on it remain genuinely high-risk instruments, the weeks this routine keeps you out of the market are quietly the weeks it earns its keep. Losing weeks still come either way. Anyone who implies otherwise is selling something other than trading.
The cheat sheet, and where this leaves you
As promised, the one-pager. Print it, pin it, glance at it before you act on anything in gold:
| Driver | Watch | Gold usually does | Breaks when |
|---|---|---|---|
| Real yields | 10yr TIPS (FRED: DFII10) | Falls when yields rise, rises when they fall | Central bank buying overpowers it |
| US dollar | DXY, especially vs gold direction | Moves inversely, roughly −0.3 to −0.5 | Fear sends both up; non-US weakness lifts DXY |
| Fed policy | FedWatch odds, statement, dots, presser | Trades the surprise, not the decision | First reaction reverses in the presser |
| Fear | Escalation, not existence, of crises | Spikes fast, retraces most spikes | Conflict persists and resets the floor instead |
| CB buying | Quarterly reserve data, dip behaviour | Shallow pullbacks, failed breakdowns | Purchases pause; old correlations reassert |
And the honest summary in three lines. Real yields are the tide. The dollar and the Fed are the waves. Fear is the occasional rogue swell, central banks are the sea level slowly rising underneath, and no correlation among any of them survives a regime change with its dignity intact.
So, the hard question to leave you with. The next time gold drops $30 in an afternoon, will you be able to name which driver did it? Not guess, name it, with the release time or the headline or the yield move to point at. If yes, you'll trade the next candle with something resembling composure. If no, you'll be where Priya was at the top of this piece: right about the slogan, wrong about the mechanism, and paying for the difference. Nobody, us included, knows where gold closes on Friday. But knowing why it moves is available to anyone willing to spend twenty minutes a week, and in this business that's about as close to an edge as the truth allows.