A signal lands in your feed. BUY XAU/USD at 3,320. SL 3,308. Then three more numbers: TP1 3,328, TP2 3,338, TP3 3,352. You take the trade with one lot, price runs to 3,330, pulls back, stops you out at 3,308. The provider posts "TP1 HIT" with a row of fire symbols. You lost money on a trade they're celebrating.
If that's ever happened to you, this article is for you. The tp1 tp2 tp3 meaning in trading signals is one of those things everyone assumes they understand and almost nobody actually operationalises. Most subscribers know that TP1 is the nearest target and TP3 the furthest. Far fewer know how to split their lots across the three, when to move the stop, what the ladder does to their average winner, and — this is the ugly part — how a three-target format lets a mediocre provider advertise an 85% win rate while their subscribers quietly bleed.
We run a gold signal desk, so we live inside this format every day. What follows is the operational playbook: the definitions, the splits, the breakeven rules, the maths, the MT4 mechanics, and the tricks to watch for. Some of it will make signal sellers uncomfortable. Good.
TP1, TP2, TP3 meaning in trading signals, in plain English
A take profit (TP) is a price at which some or all of your position closes automatically in profit. A signal with three of them is telling you: this trade has three exit stations, and you're meant to get off partially at each one.
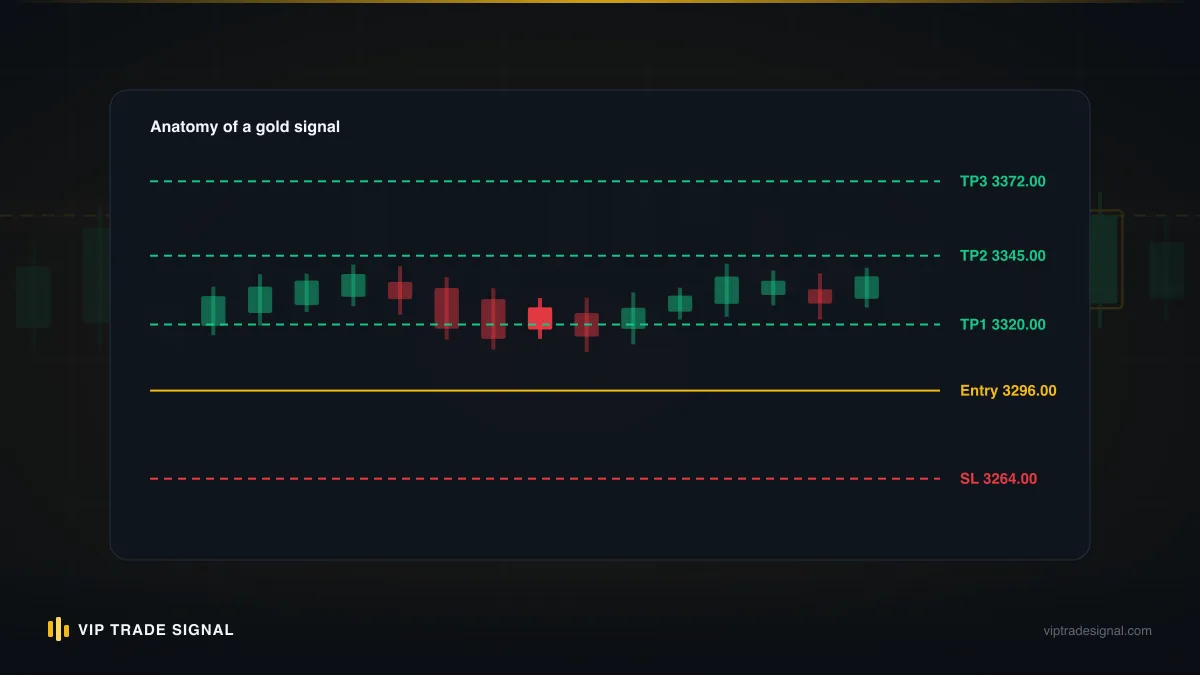
Take that gold signal again. BUY at 3,320, stop loss at 3,308, targets at 3,328, 3,338 and 3,352. Reading it as a structure rather than a list of numbers:
- TP1 (3,328) — the near target, 8 dollars away. High probability, small payoff. Its job is to bank something early and pay for the trade's risk.
- TP2 (3,338) — the main target, 18 dollars away. This is usually where the trade idea "works" in the provider's mind. Often it sits at a prior swing high or a round number.
- TP3 (3,352) — the runner, 32 dollars away. Lower probability, big payoff. It only gets hit when the move really extends, and its job is to make the occasional monster winner pull the whole month up.
- SL (3,308) — 12 dollars of risk, the one number that applies to the entire position no matter what.
Notice the risk-to-reward per level: TP1 is 0.67R (8 risked-dollars of reward against 12 of risk), TP2 is 1.5R, TP3 is 2.67R. That first number should stop you cold. On its own, TP1 pays less than the stop costs. A trade that only ever reaches TP1 and then reverses to the stop is a losing proposition unless you took partial profit there. The ladder is not three independent trades; it's one trade with a staged exit, and it only makes sense if you actually stage the exit.
One more definitional point, because it trips people up constantly: the targets are for portions of your position, not alternatives to choose between. A three-TP signal executed as "I'll just use TP3 because it pays most" is a different trade — with a different win rate — than the one the provider is publishing. More on that later, because it's the root of half the "your results don't match your history page" complaints in this industry. We wrote about the other half in why your results differ from the provider's territory before, but the ladder deserves its own treatment.
Why providers quote three targets instead of one
The charitable answer: because markets are messy. Nobody knows in advance whether a gold breakout will run 8 dollars or 40. A single target forces a binary bet on move size. Three targets let a trade be partially right. Price runs 15 dollars and reverses? With one target at +30 you made nothing; with a ladder you banked TP1 and maybe trailed the rest out around breakeven. Over hundreds of trades, that difference in exit structure matters more than most entry tweaks people obsess over.
There's also a psychological answer, and it's not entirely cynical. Subscribers who bank profit early stay calmer and follow the plan on the rest of the position. A trader who's already locked in something at TP1 doesn't panic-close the remainder on the first 5-dollar pullback. The ladder is partly a behaviour-management device, and honestly, it works. We've watched people who couldn't hold a winner for twenty minutes suddenly manage to hold a runner for six hours because two-thirds of the position was already cashed and their nerves had something to eat.
And then there's the marketing answer. A near target gets hit a lot. If your accounting counts every TP1 touch as a "win", your posted win rate inflates dramatically, and win rate is the number that sells subscriptions. Three targets give a provider three chances per trade to post something green in the channel. Some services structure their ladders almost entirely around this — TP1 sits 4 or 5 dollars from entry on gold, close enough that ordinary spread noise practically guarantees a touch. That's not a take profit strategy. That's a screenshot factory.
So when you evaluate a service, look at the geometry. Is TP1 at least meaningfully far from entry relative to the stop — say, half the stop distance or more? Does TP2 land at a level you can see on the chart, a prior high or low, rather than a random round figure? Does TP3 get hit sometimes, or is it a fantasy number that exists to make the signal look ambitious? A ladder built by a trader looks different from a ladder built by a marketer, and after you've stared at twenty of each, you can tell them apart at a glance.
Splitting your position across targets: the standard splits
Right, the practical bit. You've got a three-target signal and a risk budget. Say your account is $5,000 and you risk 1% per trade, so $50. On our example (12-dollar stop on gold, where one standard lot moves $100 per dollar), that's about 0.04 lots total. Now: how do you divide 0.04 lots across three targets?
There are three splits you'll see in the wild, and each has a personality.
| Split (TP1/TP2/TP3) | Character | Best for |
|---|---|---|
| 50% / 30% / 20% | Front-loaded, banks early | Choppy conditions, nervous traders, small accounts |
| 33% / 33% / 33% | Neutral, no opinion on move size | Default when you have no view |
| 25% / 35% / 40% | Back-loaded, chases the runner | Strong trends, patient traders |
The front-loaded 50/30/20 split is the most forgiving. Half your position banks at the high-probability near target, so even a trade that stalls after TP1 usually ends around flat or slightly green. Its cost is that your rare big winners are small, because only 20% of the position was still alive when TP3 printed. The back-loaded split is the mirror image: your TP3 days are glorious and your TP1-then-reversal days genuinely hurt.
For most subscribers, on most gold signals, we'd argue for front-loaded or equal thirds, and here's the reasoning rather than just the rule. Gold spends far more time chopping between levels than trending cleanly through them. The distribution of outcomes on a typical intraday gold signal is heavily weighted toward "reached TP1, maybe TP2, then died". A split that pays well in the most common outcome and acceptably in the rare one beats a split that does the reverse. You are not trying to maximise your best month. You're trying to make your median month positive.
One hard rule regardless of split: size the whole position off the stop, never off TP1. Your $50 of risk covers all 0.04 lots to 3,308. Some people size each "leg" as if it were a separate trade and end up risking triple what they think. If the maths of this feels shaky, our guide to risk per trade sizing sits underneath everything here — get that right first, ladders second.
And a practical footnote for small accounts: splits need lots to split. If your correct total size is 0.01 lots, you cannot divide it. You're a one-target trader whether you like it or not, and the honest move is to pick TP2 as your single target (we'll defend that choice in the maths section) rather than pretending to run a ladder you can't actually execute.
The maths: what splits do to your average winner
This is the section that changes how people trade ladders, so let's do actual arithmetic instead of vibes.
Same trade: 12-dollar stop, targets at +8, +18, +32 dollars. Suppose price cooperates fully and all three targets get hit. What did you actually make, per unit of risk?
With equal thirds: a third of the position makes 8, a third makes 18, a third makes 32. Average winner: (8 + 18 + 32) / 3 = 19.3 dollars per full-position-equivalent, or about 1.6R against the 12-dollar stop. Notice that's below TP2's 1.5R... no wait, it's slightly above — 19.3 versus 18. Barely. The headline TP3 at 2.67R was never available to you as an average. The ladder mathematically caps your best case well below the furthest target, because most of your position left early.
Front-loaded 50/30/20 on a full run: 0.5 × 8 + 0.3 × 18 + 0.2 × 32 = 4 + 5.4 + 6.4 = 15.8 dollars, roughly 1.3R. Back-loaded 25/35/40: 2 + 6.3 + 12.8 = 21.1 dollars, about 1.75R.
Now the more common scenario — TP1 hits, then price reverses to the original stop:
- Equal thirds: +8/3 on the first leg, minus 12 × (2/3) on the rest. Net: 2.67 − 8 = −5.3 dollars. A loss, but less than half a full loss.
- Front-loaded: 4 − 6 = −2 dollars. Nearly flat.
- Back-loaded: 2 − 9 = −7 dollars. Ouch.
Stack those two scenarios side by side and the trade-off is naked: every bit of extra payoff in the dream scenario is purchased with extra pain in the ordinary one. There is no free split. Anyone who tells you their split "optimises" the ladder without telling you which scenario it optimises for hasn't done the arithmetic.
A TP ladder doesn't make a strategy more profitable. It redistributes the same expectancy into smaller, more frequent wins — and that redistribution is either worth it to you or it isn't.
Here's the uncomfortable corollary. Take the full outcome distribution of a decent signal service and compute expectancy under "all-in at TP2" versus any ladder split. They usually land within spitting distance of each other. The ladder's genuine edge isn't expectancy; it's variance. Smaller swings, shallower losing streaks, an equity curve you can emotionally survive. That's worth real money to a human trader, because the biggest drawdowns most retail traders suffer come from abandoning a sound plan mid-losing-streak. But be clear-eyed about what you're buying. You're paying a slice of your average winner for smoothness. Fair trade, mostly. Just know you're making it.
Moving your stop to breakeven after TP1 — rules and risks
"SL to BE" might be the most-typed phrase in signal Telegram channels, and moving stop loss to breakeven after TP1 is treated as gospel: the moment the first target prints, slide your stop from 3,308 up to 3,320, and now the trade "can't lose".
It's a good rule. It is not a free one, and pretending it's free is how people end up resenting it.
The case for: once TP1 is banked, moving to breakeven means the worst remaining outcome on the trade is a small net profit (the TP1 portion) instead of a net loss. Rerun the equal-thirds arithmetic from above with a breakeven stop: TP1-then-reversal goes from −5.3 dollars to +2.67. Your distribution of outcomes loses its left tail below zero-after-TP1. Psychologically, that's enormous. Trades that can no longer hurt you are trades you can leave alone, and leaving trades alone is most of what separates people who follow signals successfully from people who don't.
The case against, which nobody in those channels mentions: markets retest. Gold especially. A breakout through 3,320 that runs to 3,329 will, very often, come back and kiss 3,319 or 3,318 before the real move to 3,338 begins. A stop parked exactly at entry gets collected by that retest with almost comic reliability. You bank TP1, get "stopped at breakeven", feel clever — and then watch the trade march to TP3 without you. Do that eleven times in a month and the ladder's economics quietly collapse, because you've kept all the small TP1 wins and surrendered every runner.
So here's the version of the rule we actually run:
- Don't move the stop to entry. Move it to entry minus a buffer. On gold, 2 to 4 dollars below entry for an intraday trade. You're capping the loss on the remainder at pocket change, not at zero, and in exchange you survive the ordinary retest.
- Wait for TP1 to close, not to touch. Price wicking 3,328.1 for one tick isn't TP1; your partial actually filling is. Manage off fills, not off the provider's celebration post.
- After TP2, breakeven-plus becomes mandatory, not optional. By then price is 18 dollars in your favour; giving the last leg room is fine, giving back the whole trade is amateurish. Stop goes to entry +4 or better and follows structure upward from there.
- If the provider posts a stop adjustment, take it. A desk watching the trade live has information you don't. Every signal we publish carries its management updates in-channel, and the closed result — including the ones where breakeven logic cost us a runner — lands on the signal history page either way.
The buffer point deserves one more sentence, because it's the difference between the rule working and the rule being a donation to your spread. Breakeven is not a magic price. The market does not know your entry. 3,320 matters to you and to nobody else on earth, so anchoring your stop there is sentiment, not analysis. Anchor it below the level that would actually invalidate the continuation, then round in your favour.
The TP1 win-rate inflation trick, exposed
Now the part some providers would rather you skipped.
Ask a multi-target signal service their win rate and you'll hear numbers like 85, 88, 92 percent. Ask them what counts as a win and the room goes quiet. Because in most of these operations, the definition is: any trade where TP1 was touched. Not "the trade made money for a subscriber following the posted plan". Just: price grazed the nearest target at some point before the stop.
Watch what that definition does. Build a deliberately ugly ladder: TP1 at 0.4R, stop at 1R. Gold wobbles enough that a target 5 dollars from entry gets touched on maybe 85% of entries regardless of direction — you could flip a coin for the bias and still hit it most of the time. So the channel posts "TP1 HIT ✅" 85 times out of 100. The other 15 are full stops. Now follow a subscriber running equal thirds without breakeven: 85 trades netting roughly +0.4R on a third and −1R on two-thirds when the reversal comes (call the blended result of that population somewhere around zero to slightly negative, depending how often TP2 and TP3 rescue it), and 15 trades at −1R flat. An "85% win rate" service whose median follower loses money slowly is not a hypothetical. It's a template. Whole businesses run on it.
The tell isn't the win rate itself — genuine services with tight near targets can post high touch rates honestly. The tell is what's missing:
- No R numbers. Wins counted, magnitudes never mentioned. If every result is a green tick and never "+0.6R" or "−1R", the accounting is decorative.
- No losses in the feed. Scroll their history. A month of unbroken green on a three-target format means stopped trades are being deleted or never posted.
- TP1 suspiciously close. Under half the stop distance on a routine basis. Ask yourself who benefits from a target that spread noise can reach.
- No answer to "what's the average win versus average loss?" A real desk knows this number cold. A marketing operation has never computed it.
The defence is simple and boring: recompute their performance yourself, in R, counting each signal once with the full ladder applied. Twenty trades of history is enough to expose the trick. We've written a step-by-step method for this in how to verify a signal provider's track record, and it takes an evening. If a provider won't give you the raw entries, stops and exits needed to do it — every price, wins and losses, timestamped — you have your answer about them, and it didn't cost you a subscription fee.
We'll say the quiet part as a vendor: publishing full results is annoying. Losing streaks look bad, subscribers ask hard questions in red weeks, and a competitor posting only ticks will always out-screenshot you. We publish everything anyway, because the alternative is selling a number we know is fiction. High risk is the nature of leveraged gold trading; anyone whose feed suggests otherwise is describing a product that does not exist.
When to bank everything at TP1 instead
The ladder is a default, not a law. There are situations where the correct execution of a three-target signal is a single full close at the first target, and knowing them beats following any split blindly.
When your size can't split. Covered above, but it's the most common case so it bears repeating. A 0.01-lot position is indivisible. Trying to ladder it means either oversizing (never) or fantasy. Pick one target and be honest with yourself that your results will differ from the provider's published ladder outcomes.
Ahead of scheduled news. Long gold at 3,320, TP1 printing at 3,328 at 13:25 New York time with CPI due at 13:30? Bank it. All of it. The 8 dollars in hand beats a coin-flip through a number that routinely moves gold 20 dollars in ninety seconds. Runners are for clean tape, not for holding through data releases with a market-execution exit as your only protection.
Late-session moves. A signal that reaches TP1 at 4:45pm New York, fifteen minutes before liquidity evaporates, is not going to grind to TP3 tonight. Spreads on gold widen sharply into the daily close and through the Asian handover; a resting stop near breakeven can be filled dollars away from where you placed it. Take the money, sleep, and let tomorrow's signal be tomorrow's trade.
When the move arrives all wrong. There's a difference between price walking to TP1 in a steady grind and price spiking there in one violent bar that immediately stalls. The spike-and-stall pattern into a known resistance level is distribution as often as it's continuation. If TP1 gets hit by an exhaustion move, the runner thesis is weaker than the ladder assumes. This one takes chart time to judge, and if you can't judge it yet, fine — follow the standard split and you'll be no worse than the plan.
When your month needs it. Unpopular opinion: drawdown state is a legitimate input to exit policy. If you're four losers deep and your discipline is fraying, a couple of banked TP1s that turn the streak's emotional tide are worth more than their R-value. The maths purists will object that expectancy doesn't care about your feelings. The maths purists have never watched someone revenge-trade a fifth loss into a blown account. Protect the trader first; the expectancy needs you functional to collect it.
What you should not do is flip between "all out at TP1" and "hold everything for TP3" based on mood. That's not a take profit strategy, that's a slot machine with extra steps. Pick your exceptions in advance, write them down, and the rest of the time run the ladder.
Gold ladders are wider than forex ladders, and it matters
If you've come to gold signals from EUR/USD, recalibrate. A respectable ladder on a major forex pair might span 15/30/50 pips. A gold signal with TP and SL built the same way would be stopped by lunchtime noise. XAU/USD routinely travels 25 to 40 dollars in a day — the equivalent of a couple of hundred pips in old money — and its intraday pullbacks are proportionally violent.
So a properly built gold ladder looks like our running example or wider: stops 10 to 15 dollars from entry on intraday setups, TP1 around 7 to 10, TP2 in the high teens or twenties, TP3 anywhere from 30 to 50 out. Swing signals stretch further still. Three practical consequences fall out of that geometry.
First, your lot sizes must shrink to match. A 12-dollar gold stop is $1,200 of risk per standard lot. The trader who moves from EUR/USD at 0.10 lots to gold at 0.10 lots without redoing the arithmetic has silently quadrupled their risk, and this single error accounts for a remarkable share of the blown accounts we get asked to look at. Size from the stop in dollars, every trade, no exceptions.
Second, breakeven buffers scale up. The 2-to-4-dollar buffer we suggested is a gold number. It exists because gold's ordinary retest depth is dollars, not cents. Copy a forex habit of moving stops to entry plus one pip and gold will pick your pocket daily.
Third, time-to-target stretches. TP3 on a wide gold ladder can take a full session or two to print, through pullbacks deep enough to feel like the trade is failing. Between TP2 and TP3, a retrace of half the open gains is normal, not a crisis. Subscribers who don't internalise this close every runner manually at the worst possible moment and then wonder why their results trail the published signal history. The ladder assumed you'd hold the last leg; you have to actually hold it.
The compensation for all this width is that gold trends hard when it trends. The TP3 leg exists in this market in a way it barely does on ranging forex pairs. Fewer, wider, better-paid targets — that's the character of the instrument, and a provider whose gold ladders look like forex ladders with the decimal moved is showing you they haven't traded it much.
Executing ladders on MT4 and MT5: the mechanics
MetaTrader was not designed with TP ladders in mind, so here's the workaround everyone uses: don't place one order. Place one order per leg.
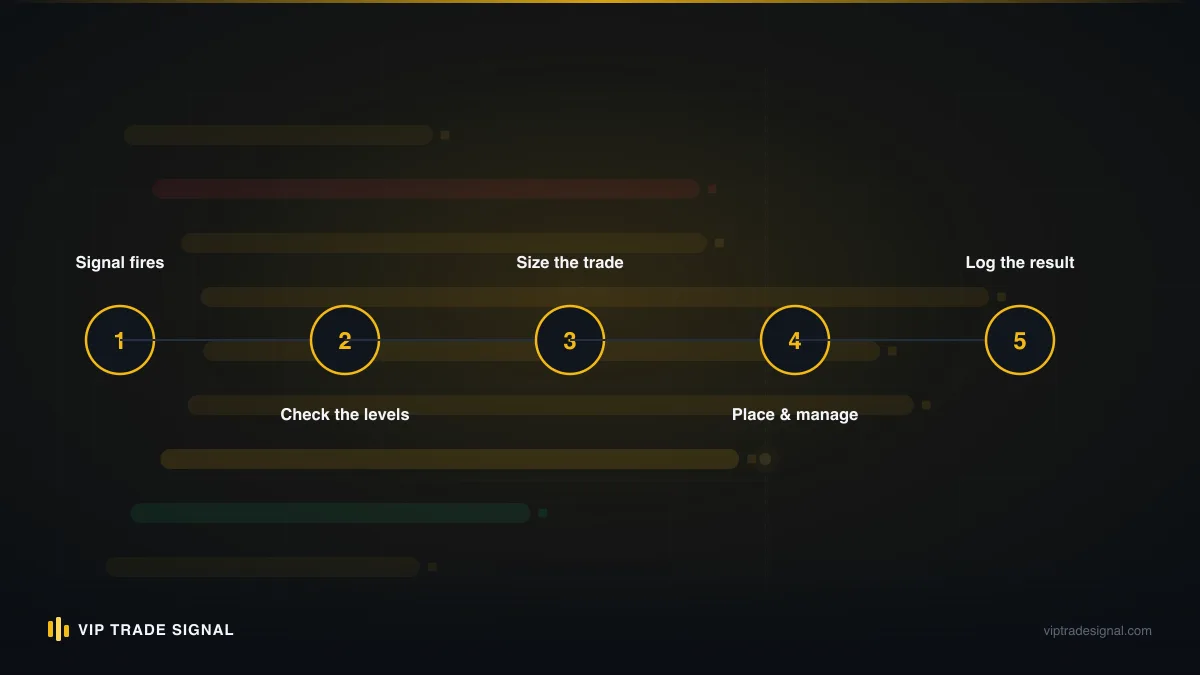
Our example, front-loaded, 0.04 lots total: instead of a single 0.04-lot buy, you place three positions at the same entry — 0.02 lots with TP 3,328, 0.01 with TP 3,338, 0.01 with TP 3,352. Every one carries the same stop, 3,308. Each leg now closes itself at its own target with no further input from you. Moving to breakeven after TP1 means modifying the stop on the two surviving positions, which takes ten seconds.
If the signal is at-market, fire the three orders back to back; on gold your fills will land within a few cents of each other, which is noise at this ladder's scale. If it's a pending-order signal, place three pendings at the same trigger price with the three different TPs. (Whether to take a signal at market or on a pending at all is its own decision with its own trade-offs, and the answer changes your fills more than any split does.)
The alternative is one position with manual partial closes: open the full 0.04 lots with SL and the final TP attached, then, as price reaches each intermediate target, right-click, select partial close, close 0.02, then 0.01. It works, and some traders prefer having a single ticket. But it requires you to be at the screen when targets hit, and gold reaches targets at 3am with some regularity. Sleep is an execution risk. The three-position method turns the whole ladder into resting orders and lets the platform do the night shift.
A few sharp edges worth knowing before they cut you. Minimum lot is 0.01, so the smallest true three-leg ladder is 0.03 lots total — if your risk maths says less, you're back to single-target execution. Your broker's stop level may forbid TPs within a few cents of current price, which matters when you're filling late and TP1 is already close. Commission-per-lot brokers charge the same total across three small tickets as one big one, but minimum-commission-per-ticket structures will nibble you three times, so check. And on MT4 specifically, watch your account's position accounting when you're in other trades; three tickets on one idea plus two on another gets visually confusing fast, and closing the wrong ticket in a hurry is a self-inflicted wound we've all managed at least once.
Copiers and TP ladders: where the settings bite
A large share of signal subscribers now execute through Telegram copiers, and copiers meet TP ladders the way rakes meet lawns. The defaults are where it goes wrong.
The core question: when your copier parses a message with three TPs, what does it do? The good ones split the position into multiple orders, one per target, exactly like the manual method above — and let you configure the split percentages. The mediocre ones take TP1 only and ignore the rest, turning every signal into a 0.67R scalp. Some default to TP3 only, which converts a high-touch-rate service into a low-win-rate lottery. All three behaviours produce months of results that look nothing like the provider's history, and the subscriber usually blames the provider. Check the setting. It's one dropdown, and it's the single highest-impact configuration in the whole tool.
Second trap: management-message parsing. When the provider posts "move SL to breakeven" or "close half", does your copier act on it? Some parse those edits beautifully; some only read the original signal and go deaf afterwards. A ladder without its management updates is a different, worse strategy. If your copier can't follow edits, you must do the breakeven moves manually, which means knowing they happened, which means actually reading the channel rather than letting it run like a vending machine.
Third: sizing mode. Copiers offering "fixed lot per signal" will apply that lot to each leg on some platforms — a 0.03 configured size becoming 0.09 across three orders. Risk-percent modes mostly handle ladders correctly, but verify on a demo account before real money touches it. Run five signals on demo, compare your fills, splits and exits against the provider's posts line by line, and only then go live. An evening of demo tedium is cheap insurance against a month of mystery losses. Our FAQ covers the copier settings we see mangle our own signals most often, because we'd genuinely rather you configure it right than churn out in confusion three weeks in.
Two worked examples, start to finish
Theory's done. Let's walk two trades through the whole machine — generic examples, illustrative numbers, but shaped exactly like the gold signals you'll actually meet.
Trade one: the full run. Signal: BUY XAU/USD 3,304, SL 3,292, TP1 3,312, TP2 3,322, TP3 3,336. Account $5,000, risk 1% = $50, stop is 12 dollars, so 0.04 lots. Front-loaded split: 0.02 / 0.01 / 0.01, three positions, one shared stop. London morning grinds up; TP1 fills at 3,312 (+$16 on the 0.02 leg). Stop on the survivors moves to 3,301 — entry minus three dollars of buffer. Price retests 3,302.5, which would have collected a stop parked at entry exactly, then New York bids it through 3,322: TP2 fills (+$18). Stop to 3,310. Late session extension prints 3,336: TP3 fills (+$32). Total: $66 banked against $50 risked, about 1.3R, no moment of drama after the first hour. The all-in-at-TP3 fantasy version made $128. It also would have made you sit through the 3,302.5 retest with the entire position open and nothing banked, and we both know how that usually ends for a human being.
Trade two: the ordinary disappointment. Signal: SELL XAU/USD 3,341, SL 3,352, TP1 3,334, TP2 3,326, TP3 3,314. Same sizing logic: 11-dollar stop, $50 risk, 0.04 lots, split 0.02 / 0.01 / 0.01. Price sells off to 3,333.8; TP1 fills (+$14). Stop comes down to 3,344 — entry plus buffer, this being a short. Then the bounce: 3,338, 3,342, 3,344 tags the stop, both remaining legs close at −$3 each. Net: +$8. The channel posts "TP1 HIT ✅". This time the tick is technically true and your account is technically green, but let's file it honestly: a trade that risked $50 to make $8 is a scratch, not a win, and if you'd run no partial and no breakeven you'd be down the full $50. This exact shape — the biggest single outcome-category on most gold signal services — is why the ladder and the breakeven rule exist, and also why a provider's tick-count tells you nothing. Score it in R, in your own journal, every time.
Two trades, $74 combined, one celebration-worthy and one a shrug. Across a month, the shrugs outnumber the runs. The ladder's whole purpose is making sure the shrugs cost little and the runs get paid.
Write your ladder policy before the next signal arrives
Everything above collapses into a half-page document you should write tonight and then obey. Decisions made calmly, in advance, are the only ones worth having in this game; decisions made with a position open and price moving are just adrenaline wearing a spreadsheet costume.
Your ladder policy needs six lines:
- Total risk per signal: ___% of account, sized off the stop, always. (1% is our answer for most people; argue for less before you argue for more.)
- Default split: 50/30/20, thirds, or single-target-at-TP2 if my size can't divide. Circle one. Stop re-litigating it per trade.
- Breakeven rule: after TP1 fills, stop moves to entry ± ___ dollars of buffer. After TP2, breakeven-plus, no exceptions.
- Bank-everything exceptions: major news inside 30 minutes, final hour of New York, size too small to split. Anything else on this list you must add in writing, on a weekend, not mid-trade.
- Execution method: three positions in MT4/MT5, or copier configured to split with management-message parsing verified on demo. Named, tested, done.
- Scoring: every signal journalled once, in R, full ladder counted, wins and losses both. My numbers, not the channel's ticks.
Print it. Tape it to the monitor if you have to. The subscribers who make signal services work for them are, almost without exception, the ones running a fixed personal policy against a provider they've independently verified — and the ones it fails are winging both halves.
A last word on choosing whose ladders to follow at all. The format is neutral; the operator isn't. Judge any multi-target service by whether its full results are public and scoreable, whether its TP1 does honest work or just harvests screenshots, and whether its management calls arrive in real time. That's the standard we hold our own gold signals to — every closed trade on the history page, losses included, because a ladder you can't audit is a story, not a track record. And whether you ever subscribe to us or to anyone: three targets on a signal are an instruction set, not a decoration. Execute them like one.