Somewhere on YouTube right now, a man in a rented Lamborghini is explaining that stop losses are for amateurs. His alternative has a name that sounds like a military operation: the zone recovery strategy. Take a losing trade, he says, bracket it with an opposite position, size the legs correctly, and the market pays you back no matter which way it goes. Mathematically guaranteed. Click below for the EA.
We should be the last people to sneer at this, because we actually use zone recovery structures. Not from an EA, and not the way the Lamborghini man sells it, but by hand, on rescue accounts that come to our drawdown management desk already deep underwater. When you spend your working week inside other people's blown-up terminals, you get intimately familiar with what this technique can do and, more usefully, with the precise market condition that turns it into a shredder.
So this piece is neither a sales page nor a hit job. It's the article we wish existed when clients ask us "should I just run a zone recovery EA on this?" The answer needs the actual arithmetic, including the exponential lot growth every vendor buries on slide fourteen, and a straight look at the whipsaw scenario that no backtest ever seems to include. By the end you'll know exactly how the machine works, exactly where it breaks, and why we'd rather build one manually twice a year than let software run one unsupervised for a single afternoon.
The idea: turning a loss into a bracketed zone
Start with the problem zone recovery claims to solve. You're long gold from 3,300 and it drops to 3,270. Standard practice says take the loss or hold and hope. Zone recovery says: do neither. Instead, sell at 3,270 with a larger position, so that you're now net short. If price keeps falling, the short earns more than the long bleeds, and at some point down there you close everything for a profit. If price turns and climbs back, you buy again at 3,300, bigger still, flipping net long. Repeat as needed.
The two prices, 3,300 and 3,270 in this example, define the zone. Above the zone sits a take-profit level for the long side; below it, one for the short side. The whole structure is a bracket: whichever target price reaches first, the winning legs are sized to pay for every losing leg plus a little on top. On paper, the trade literally cannot lose. It can only take longer to win.
That paper logic is genuinely sound, which is what makes this strategy so seductive and so persistent. It isn't a scam in the way a fake signal room is a scam. The geometry works. If gold leaves the zone in either direction and travels far enough, you exit whole. Every zone recovery hedging EA on the market is just this bracket automated, with the lot multipliers pre-programmed and a settings panel to make you feel in control.
The catch is not in the geometry. The catch is in the word "if". Price has to leave the zone, and it has to do so before your lot sizes, your margin, or your nerve give out. And there's one market condition, the most common condition there is, in which price does not leave the zone. It just oscillates through it, forcing you to add a bigger position at every crossing. We'll get to that. First, the mechanics deserve a proper walkthrough, because most people arguing about zone recovery online have clearly never built one.
The mechanics, step by step
Let's build the bracket properly, on gold, since that's all we trade. Numbers first, commentary after.
- Initial trade. Buy 0.10 lots XAU/USD at 3,300. This is the trade that went wrong; everything after this is the recovery.
- Define the zone. You pick a zone height. Say $30: the zone runs from 3,270 to 3,300. Zone height is the single most important setting you'll choose, and almost nobody chooses it thoughtfully.
- Set the targets. Place the upside target one zone-height above the top: 3,330. Downside target one zone-height below the bottom: 3,240. (Some traders use wider targets; the arithmetic below assumes target distance equals zone height, which is the common default.)
- First recovery leg. Price falls to 3,270. You sell 0.30 lots. You're now net short 0.20.
- Second recovery leg. Price climbs back to 3,300. You buy 0.60 lots. Net long 0.40.
- Repeat. Every time price touches the far side of the zone, you add in that direction, always sized so the potential winner covers all accumulated losers plus your original profit target.
Exit happens the moment price closes through either target. At 3,330, all the buys win and all the sells lose, but the buys are sized to win more. At 3,240, mirror image. Everything closes at once, the account books a small net gain, and the story your EA vendor tells ends here with soft piano music.
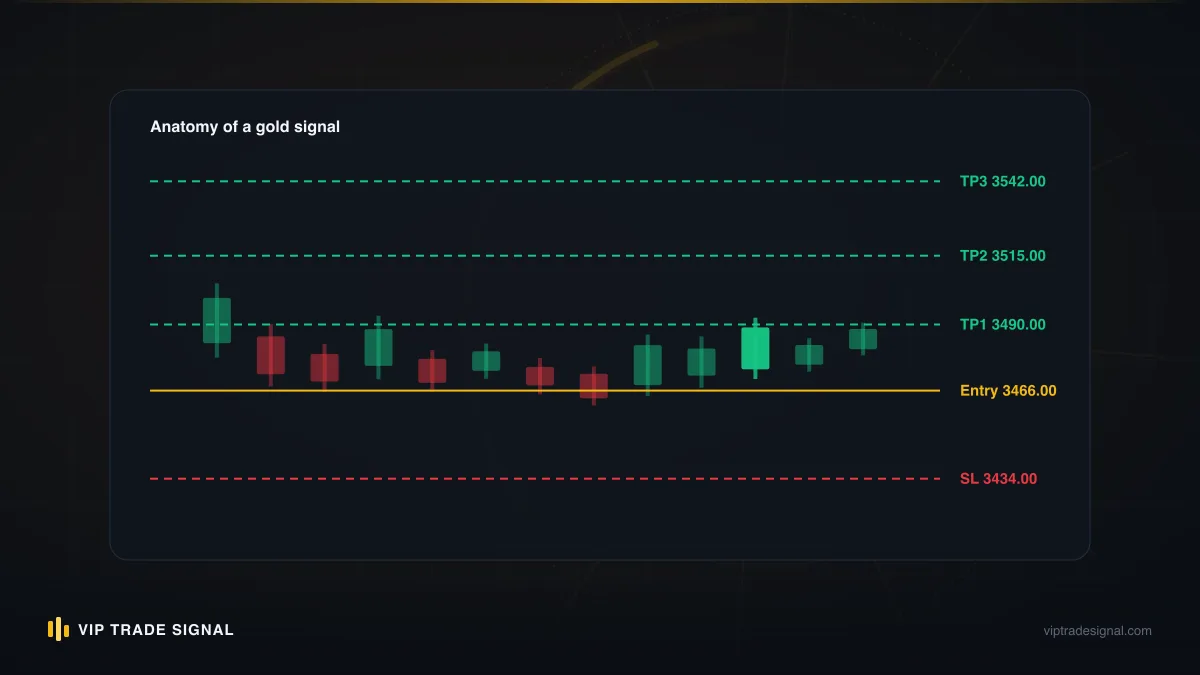
Notice what the structure really is, though. It's not a hedge in any meaningful sense, even though marketing calls it "zone recovery hedging". A true hedge reduces exposure. This increases it, on alternating sides, forever, until released. Each leg exists to bail out the ones before it, which means each leg has to be bigger than the ones before it. That single fact drives everything that follows, so let's put actual numbers on it.
Zone recovery lot sizing: where the exponent hides
Here is the maths the sales pages skip. On gold, one full lot moves $100 per $1 of price. Our zone is $30 tall, targets $30 beyond each edge, so a position opened at one zone boundary either gains $30 to its target or loses $60 to the opposite target. Gain 30, lose 60. Hold that ratio in your head, because it's the engine of the whole problem.
For the bracket to pay out at the lower target, total sell lots times 30 must exceed total buy lots times 60, plus whatever profit you want. Run that condition leg by leg, keeping a modest $300 profit target on the table, and you get this sequence:
| Leg | Direction | Price | Lots this leg | Total buys | Total sells |
|---|---|---|---|---|---|
| 1 | Buy | 3,300 | 0.10 | 0.10 | 0 |
| 2 | Sell | 3,270 | 0.30 | 0.10 | 0.30 |
| 3 | Buy | 3,300 | 0.60 | 0.70 | 0.30 |
| 4 | Sell | 3,270 | 1.20 | 0.70 | 1.50 |
| 5 | Buy | 3,300 | 2.40 | 3.10 | 1.50 |
| 6 | Sell | 3,270 | 4.80 | 3.10 | 6.30 |
| 7 | Buy | 3,300 | 9.60 | 12.70 | 6.30 |
Look at the third column of lots. 0.10, 0.30, 0.60, 1.20, 2.40, 4.80, 9.60. From leg two onward, every leg doubles. That's not an accident of my example; it falls straight out of the 30/60 ratio. When your target distance equals your zone height, each rescue position must be roughly twice the last, because it has to recover losses that themselves doubled last time. Widen the targets relative to the zone and the multiplier drops below two, but it never drops far, and wider targets mean price has to travel further to release you, which brings its own failure mode.
By leg seven you are buying 9.6 lots of gold to defend a position that started at 0.10. That is 960 ounces, a bit over three million dollars of notional exposure, riding on a trade whose original ambition was to make a few hundred dollars. And leg eight, if it comes, wants roughly 19 lots.
Zone recovery doesn't remove risk from a losing trade. It borrows against the future at a doubling rate and hopes the market repays the loan before the debt becomes unpayable.
This is the sentence to remember whenever someone shows you a zone recovery EA equity curve. Every smooth month on that curve was financed by exposure that doubled quietly in the background and happened, that month, to get repaid. The curve shows the repayments. It does not show the size of the loans.
A worked recovery, leg by leg
Fairness first: let's watch it work, because it does work, often, and pretending otherwise would be the mirror image of the vendor's dishonesty.
Say a trader we'll call Sam is long 0.10 lots from 3,300 on a Tuesday morning. US data disappoints, gold drops, and at 3,270 Sam's EA sells 0.30 lots. Price grinds down through the London afternoon, wobbles at 3,255, then New York sells it hard. At 3,240 the whole structure closes: the 0.30 sell has earned $30 of travel, $900; the 0.10 buy has lost $60 of travel, $600. Net, Sam pockets $300 before spread and commission. His original trade was wrong by $30 of price and he still got paid.
That's the honest best case, and it happens whenever the first recovery leg is also the last. One reversal, one added position, price follows through. In a trending market, most zone recovery cycles look exactly like this, which is why a backtest run over a trending year makes any zone recovery hedging EA look like a money printer.
It even works, sometimes, deeper into the sequence. Suppose price had bounced at 3,265 instead, climbed back, triggered the 0.60 buy at 3,300, then rallied clean to 3,330. Buys: 0.70 lots earning $30 each of travel on the final leg's terms, worth $2,100 against sell losses of $1,800. Net roughly $300 again. Two rescues, released on the third move. Sam's statement shows one modest winner and no drama, and if you saw only his closed-trade history, you'd think he was a tidy, disciplined trader.
What the statement doesn't show is what the account looked like mid-cycle. Between legs, with price sitting inside the zone, every open position is losing or barely breaking even. At the moment before the leg-three buy triggered, Sam's floating loss touched about $500 on a structure meant to earn $300. That ratio gets viciously worse each leg. And notice how much work the market did for him: two clean, prompt escapes from the zone. He didn't earn that. Gold's mood gifted it. The whole method is a bet that such gifts keep arriving, and the sequence table above prices what happens when they don't.
The same trade in a chop: a worked failure
Now run the identical setup through a week where gold does what gold does most of the time: nothing much, noisily.
Same start. Long 0.10 at 3,300, sell 0.30 at 3,270. But this week there's no follow-through. Price bases at 3,262, missing the 3,240 target by $22, then drifts back up. At 3,300: buy 0.60. It pokes to 3,318, twelve dollars shy of release, and fades. At 3,270: sell 1.20. Asian session ranges. London pushes it back up. At 3,300: buy 2.40. A headline knocks it down again. At 3,270: sell 4.80.
Five days, five legs, and price never once left the zone. Tally the damage with price sitting at 3,285, dead centre:
- Buys, 3.10 lots from 3,300, each $15 offside: floating minus $4,650.
- Sells, 6.30 lots from 3,270, each $15 offside: floating minus $9,450.
- Spread and commission across five gold entries at growing size: call it another $250 gone.
Total floating drawdown: about $14,350. On a structure built to recover a $300 problem, for a trader whose account might be $20,000 or might be $8,000. If it's $8,000, this story already ended at leg five with a margin call, and we haven't even reached leg six's 4.80-lot order, let alone leg seven's 9.60.
Here's the part that stings. At no point in that week did Sam make an obvious mistake by the strategy's own rules. Every entry was correct. The EA executed flawlessly. The zone was a sensible height by any tutorial's standard. The market simply chose a range whose width happened to match his zone, and the strategy's response to that condition is to double exposure at every oscillation until something external stops it. There is no setting that fixes this, only settings that change which range kills you.
Compare that with the boring alternative he rejected on Tuesday: take the $300 loss and re-enter when the chart earns it. We've written before about the close-or-wait decision, and this failure case is the strongest argument in that whole debate. A stop loss costs you a known $300. The recovery structure offered to refund it, and the true price of that offer turned out to be forty-seven times larger.
The ranging market: the zone recovery strategy's kill zone
Generalise the failure and you get the one sentence that should be stamped on every zone recovery product: this strategy is short volatility-of-direction, at doubling size, without a stop. It profits when price picks a direction and commits. It loses when price oscillates, and it loses fastest when the oscillation wavelength roughly matches your zone height.
Think about how often that condition occurs. Gold spends most of its life ranging. Consolidation after a move, dead summer weeks, the coil before FOMC, the two days either side of Non-Farm Payrolls where every push gets faded. Studies of price behaviour argue about the exact split, but nobody who has watched a chart for a living would put trending time above a third. The strategy's kill zone is not some rare storm. It's the default weather.
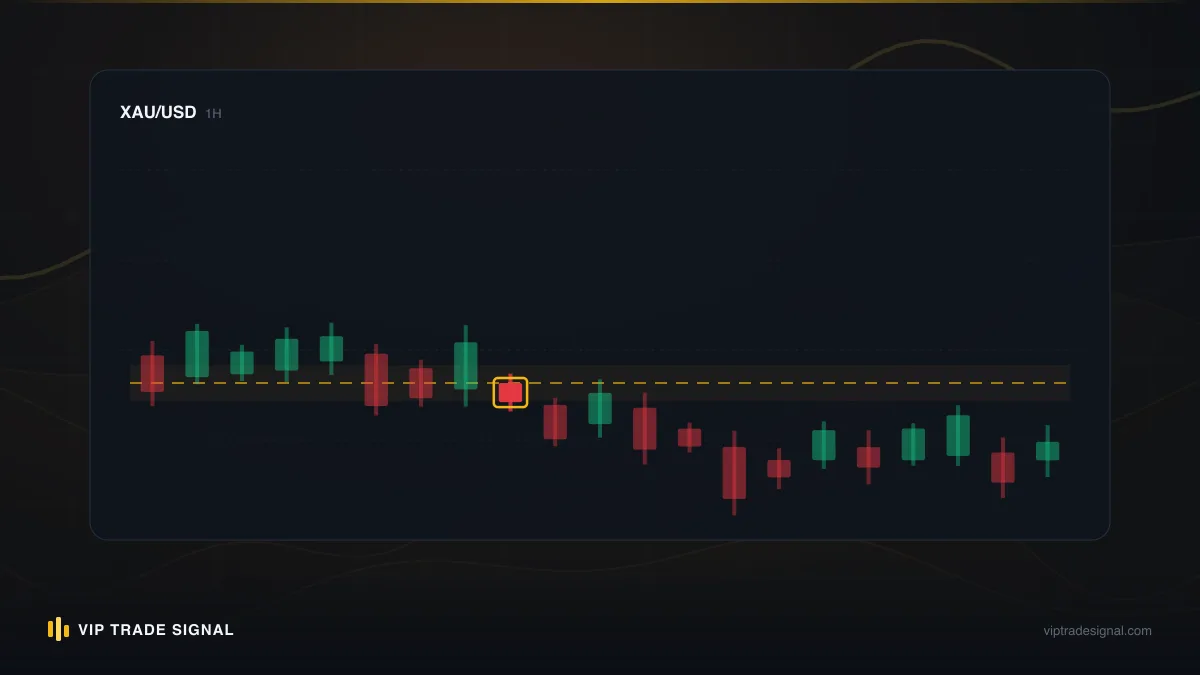
Worse, the zone height decision is a trap with two jaws. Make the zone tight, say $10 on gold, and ordinary hourly noise crosses it several times a session; you can burn through six legs before lunch. Make it wide, say $80, and crossings are rarer but each one is enormous: your positions sit $80 offside before rescue arrives, and the targets sit so far away that price might take weeks to release you, if it ever does. There is no width that is safe from ranges, because ranges come in every width. Whatever zone you pick, the market will eventually serve up a range that matches it. On gold, which loves to spike through a level, run the stops, and reverse, this isn't eventual. It's monthly.
Vendors know this, which is why the small print of every trade recovery expert advisor includes a "range filter" or an ADX threshold that pauses trading in quiet conditions. It sounds like a solution. It isn't, for a blunt reason: the strategy doesn't get to choose when it's in the market. It enters recovery mode because a trade is already losing, and then it's committed. A range filter can decline to start a cycle; it cannot exit one that a fresh range has swallowed mid-sequence. The filter guards the front door while the back wall is missing.
And ranges are precisely where losing trades happen most, because breakout entries fail in ranges. So the strategy is most likely to be activated at exactly the moment its kill condition is present. It's a machine that arms itself in its own worst environment.
Zone recovery EAs: what the backtests don't show
The zone recovery hedging EA market runs on backtests, and backtests flatter this strategy more than perhaps any other, for reasons worth spelling out one at a time.
First, survivorship in the test window. A vendor tests over 2023 or 2024, gold trends beautifully, the EA posts 80% months. The chop of a different year never appears. Where a bad patch does show up, the vendor quietly reruns with a tweaked zone height until the curve smooths, then presents the winning settings as if they'd been chosen in advance. That's curve-fitting an unstopped martingale-adjacent system, which is about the most dangerous thing you can curve-fit, because the failure it hides isn't a bad month. It's account death.
Second, hidden intra-cycle drawdown. Most published metrics report closed-trade drawdown. Zone recovery's closed trades are nearly all winners; the horror lives in floating losses mid-cycle, the $14,350 hole from our worked failure. Plenty of backtest reports simply never surface that number. The equity line looks serene while the balance-versus-equity gap yawns underneath, invisible unless you know to demand the floating-drawdown chart.
Third, execution fantasy. Backtests fill 4.8-lot gold orders at the touch of a level with zero slippage. Live, at 3,270 during a New York flush, that order fills $1.50 worse on a bad day, and the spread has widened from 20 cents to 80. Trivial at 0.10 lots. At leg six sizes, slippage alone can consume the entire cycle's profit target, which means the sequence maths silently stops closing and each "successful" cycle finishes at a small loss that demands, you guessed it, a slightly bigger next cycle.
Fourth, the weekend gap. The structure assumes it can always add the next leg at the zone boundary. Gold gaps $15 at Sunday open, price is suddenly beyond your intended entry, and the rescue leg fills far off-design. The neat 30/60 geometry that made each leg exactly twice the last is broken, and the EA's response, in every one we've dissected, is simply to size the next leg even larger to compensate. The exponent gets a promotion.
Fifth, and this one is subtle, the psychology of running one live is nothing like watching a backtest scroll by. In the test, leg six is a row in a table. On a Wednesday night with real money, leg six is a 4.8-lot gold order your finger has to approve while your account shows a five-figure floating loss, your partner is asleep, and every instinct you own is screaming to close it all. Plenty of people override the EA right there, at the maximum-pain point, and lock in exactly the disaster the sequence was designed, in theory, to trade through. The backtest never had a 2 a.m. The backtest never flinched.
None of this means every trade recovery expert advisor vendor is a liar. A few publish honest floating-drawdown figures. But the incentive structure is brutal: the honest backtest looks terrifying, the dishonest one looks like retirement, and both sell for $299 on the same marketplace. Guess which outsells which.
Margin: the arithmetic your broker runs
Even if your nerve survives the sequence, your margin might not, so let's run the broker's numbers on our table. Gold at 3,300, one lot equal to 100 ounces, so $330,000 notional per lot.
At 1:500 leverage, margin per lot is $660. Some brokers net the margin on hedged positions; the strict ones charge both sides. Take the friendlier netted case, where margin is charged on your larger side only:
| After leg | Larger side (lots) | Margin required | Floating DD mid-zone (approx) |
|---|---|---|---|
| 2 | 0.30 sell | $198 | $600 |
| 3 | 0.70 buy | $462 | $1,500 |
| 4 | 1.50 sell | $990 | $3,300 |
| 5 | 3.10 buy | $2,046 | $6,900 |
| 6 | 6.30 sell | $4,158 | $14,100 |
| 7 | 12.70 buy | $8,382 | $28,500 |
Now overlay a realistic account. $10,000, which is bigger than most retail accounts that run these EAs. After leg six, floating drawdown alone exceeds the account. Game over during leg five or six depending on where inside the zone price is sitting when equity crosses the stop-out threshold. The broker closes everything at the worst possible moment, mid-zone, where every position is offside, and does it in whatever order its liquidation engine fancies. On a strict both-sides-margined broker it ends a full leg earlier.
People sometimes comfort themselves that hedged positions can't blow up because the exposure "nets off". It nets in direction, not in loss: both sides of the zone are offside mid-cycle simultaneously, which is precisely the situation stop-out engines are built for. If you want the grim mechanics of what happens past stop-out, including when an account can finish below zero, we've covered that separately; gold's gap-and-spike habit makes it more than a theoretical footnote.
The margin table also exposes the vendor trick of demonstrating on cent accounts or $100k funded demos. Of course the sequence survives on a $100,000 account defending a 0.01-lot initial trade. Scale the initial trade to a size that would make the profit worth having, and the sequence's appetite scales with it. The strategy doesn't have a margin problem at any one size. It has a margin problem at every size, arriving a few legs later or earlier.
How we run zone logic by hand on rescue accounts
So why do we, professionally allergic to martingale-shaped risk, still use zone structures on the drawdown management desk? Because the accounts that reach us are already in the failure state. There's no clean $300 loss to take; there's a $7,000 floating hole dug by somebody else's averaging, and the client has usually rejected the take-the-loss option already, or they wouldn't be talking to us. Working inside an existing disaster, a hand-built bracket is sometimes the least bad tool. The differences between how we build one and what an EA does are the entire point, so here they are.
We cap the sequence before it starts. Two recovery legs, occasionally three on a deep account, then the structure closes at the planned partial loss, full stop. Writing down the maximum leg turns zone recovery from an open-ended doubling scheme into a defined-risk trade with an unusual shape. You know the worst case in dollars before the first order. An EA's worst case is a number the vendor won't print.
We don't recover the whole hole in one cycle. An EA sizes legs to erase the entire loss plus profit, which is what drives the doubling. We size to claw back maybe 15% of the drawdown per cycle, which keeps leg sizes almost flat, then we wait, sometimes days, for the next A-grade location. Ten small cycles across six weeks beats one heroic cycle that risks the account, every time, even though it looks painfully slow on a client call.
We choose when the market is allowed to trigger a leg. The EA adds at a price. We add at a price during conditions: London or New York liquidity, no red-calendar event inside four hours, and the zone boundary sitting at a level gold actually respects, a prior day's value edge or a swing that's held twice, not an arbitrary $30 offset. Half the whipsaw problem is that arbitrary zones sit in the middle of nowhere, where price has no reason to do anything but wander.
And we keep a human hand on the kill switch. When the structure is two legs deep and CPI lands tomorrow, we flatten or bank the smaller side, take the sting, and rebuild after. No EA does this, because "close everything at a loss because tomorrow is dangerous" cannot be coded as anything other than a rule that ruins the backtest. It's also, on live money, sometimes the best trade of the month. All of this is slower and less elegant than the automated version, and it carries no guarantee; some rescue attempts end at the cap, at a loss, and we say so up front. That's the honest shape of recovery work.
Zone recovery versus stop-and-reenter
Strip away the machinery and you're choosing between two responses to a losing trade, so put them side by side properly.
Stop-and-reenter: take the $300 loss at 3,270. Your account is down $300, your margin is free, your head is clear. If the short side was genuinely on, you can sell the retest with fresh size and a fresh stop, and you're paying $300 for the right to make that decision without a hostage situation running in the background. Cost: known, small, immediate, and psychologically horrible, which is the real reason people avoid it.
Zone recovery: refuse the $300 loss. In exchange, accept an open-ended sequence whose cost is unknown, potentially fifty times larger, and payable at the worst moment, in return for frequently, even usually, getting your $300 back plus change. It converts many small certain losses into rare enormous ones. That is the exact risk profile of selling deep out-of-the-money options, or of averaging down, which is zone recovery's unhedged cousin and fails for the same reason on a slower fuse.
Here's the uncomfortable truth about which one traders pick. The stop loses in public, on your statement, today. The zone loses in private, later, occasionally, catastrophically. Human beings will pay astonishing premiums to move a loss from the first category to the second, and the entire recovery-EA industry is that premium, collected monthly. Over any horizon long enough to include one proper range, the boring stop wins on the arithmetic. We've never once seen it lose on the arithmetic across a full year of gold. But it loses on feelings every single day, and feelings place most retail orders.
If you take one thing from this comparison: the fair question is never "did the zone recover this trade?" It usually does. The fair question is "what does this method cost per year, including the cycle that fails?" Ask any vendor for that number and enjoy the silence.
Rules if you insist on trying it
You may run it anyway. Fine. We'd rather you did it with eyes open than off a YouTube tutorial, so here is the checklist we'd hand a stubborn friend, and we'd make him read it twice.
- Write down the maximum leg before the first trade. Three legs, maybe four. Compute the worst-case dollar loss at that cap, including spread, and if that number exceeds 5% of the account, your initial size is too big. This single rule deletes the account-death scenario and, yes, deletes the "never take a loss" fantasy with it. That fantasy was the bug, not the feature.
- Test the sequence maths with your real costs. Rebuild my table with your broker's gold spread and commission at each leg size. If the cycle profit goes negative by leg four, your zone-to-target ratio doesn't survive contact with your actual costs. Most don't.
- Anchor the zone to structure, not to a fixed dollar height. A boundary at a level gold has defended twice this week gets crossed less often than one placed $30 away because a settings box said so.
- Forbid it around scheduled events. No cycle may be open through FOMC, CPI, or NFP. If you're mid-sequence the day before, close or reduce. A $10 gold spike through your zone at 8:31 New York time adds a leg at terrible fill and can do it twice in a minute.
- Watch equity, not balance. Set a hard equity floor, 10% below start-of-cycle equity is reasonable, and if the structure drags you there, everything closes, no debate. Mid-cycle balance is fiction; equity is the account.
- Demo it through a range, deliberately. Not a month of trending backtest. Find last year's ugliest six-week gold consolidation, run the exact settings through it, and look at the floating drawdown, not the finish line.
- If you're using an EA, read the sizing code or don't run it. You need the multiplier, the cap if any, and what it does after a gapped fill. "It's encrypted for IP protection" is a complete answer, and the answer is no.
Follow all seven and you'll have converted zone recovery into a small, capped, occasionally useful tactic that wins modestly in trends and takes planned losses in chop. Which is to say, you'll have turned it into a normal trading strategy with normal drawdowns, because that's the only honest thing it can be. The version with no cap and no losses exists only in the backtest and the rented Lamborghini.
Where this leaves you
The zone recovery strategy is the rare piece of retail folklore that's neither nonsense nor safe. The geometry is real. The worked recovery above is real. And the doubling sequence, the mid-cycle drawdown, and the ranging market that triggers both are just as real, and arrive on no schedule you control. Any presentation of this method that shows you the first list without the second is selling something, usually an EA, sometimes a course, occasionally just engagement.
Our position, after years of rescue work: zone logic is a scalpel for cleaning up existing wounds, wielded slowly, with a cap and a calendar and a human being watching. It is a terrible way to trade fresh capital, and an unsupervised EA running it on a live account is a countdown with a pleasant interface. Losses are part of this business; the whole game is keeping them the small kind, and this strategy's core promise is to abolish the small kind. Read that sentence again and notice what's left.
If your account is already deep in the hole and you're eyeing a recovery EA as the way out, that's the moment to slow down, because you'd be arming the machine in exactly the conditions that feed it. Talk to us about structured drawdown management if you want experienced hands on it, on a recovered-profit fee with no guarantees pretended. Or simply take the loss you've been avoiding and keep the account. Both options are unglamorous. Both beat leg seven.