There's a moment every leveraged trader knows. You're short gold from 3,340, price is at 3,352, and the loss on screen is real but survivable. Then a thought arrives, wearing the costume of intelligence: if I liked selling at 3,340, I should love selling at 3,352. Add here and my break-even drops to 3,346. Price only needs to come back half as far.
That thought is averaging down, and in forex it fails far more often than it saves. It has ended more retail accounts than any broker, any spread, any news spike. And the maddening part is that it usually works. You add, price retraces, you close flat or slightly green, and you learn the worst possible lesson: that adding to losers is clever. You'll keep collecting those small saves until the one day it doesn't retrace, and that day takes back every save plus the account itself.
The logic behind the habit is imported from stock investing, where dollar cost averaging genuinely works, and it breaks the moment leverage enters the room. So we'll do the actual margin arithmetic, walk a full worked collapse, and then be fair about the narrow cases where scaling into a position is legitimate. Because there are some. They just don't look anything like what most people do at 2am with a red position and a racing pulse.
Why averaging down feels so reasonable
Start with a bit of sympathy for the idea, because it doesn't come from stupidity. It comes from three places that are each individually sensible.
First, value logic. If a thing was worth buying at 100, it's a better deal at 95. That's true for a house, roughly true for a share of a profitable company, and it feels like it should be true for a currency pair or an ounce of gold. Cheaper is better. Everyone's grandmother believes this.
Second, the break-even maths genuinely improves. Buy one lot at 100 and one at 95 and your average entry is 97.5. Price no longer needs to reach 100 for you to escape; it needs 97.5. Each add pulls the exit closer. On paper you are making the trade easier to win.
Third, and this is the one nobody admits, adding lets you avoid being wrong. Closing the trade converts a floating loss into a realized one, and a realized loss is a verdict. Adding postpones the verdict. It reframes the losing trade as a bigger, smarter trade still in progress. Your ego gets to stay long even when your thesis is being dismantled candle by candle.
Put those three together and averaging down doesn't feel like a gamble. It feels like conviction plus arithmetic. Which is exactly why it's dangerous: the arguments are all true as far as they go. They just stop one step short of the part that matters, which is what happens to your margin and your survivability while your break-even is busy improving.
The break-even moves closer. The stop-out moves closer faster. Everything in this article hangs off that one asymmetry, so let's earn it properly.
DCA on an index fund vs averaging a leveraged trade
The respectable ancestor of averaging down is dollar cost averaging, and the comparison of dollar cost averaging vs averaging down in trading is where most of the confusion starts. People hear that Warren Buffett endorses buying more when prices fall, and they carry that permission slip into a 1:500 leveraged gold trade. So let's lay out exactly what makes DCA work, because averaging a forex position violates every single condition.
DCA on an index fund works because of four structural facts:
- No leverage. You buy with money you have. A 40% drawdown in the index is a 40% drawdown in your holding, and nothing forces you out. There is no margin call on a cash purchase of an ETF. Time is genuinely on your side because nobody can take the position away from you.
- The asset has positive drift. A broad index is a claim on the earnings of hundreds of companies that retain profits and grow. Over decades it goes up, not because of charts but because of dividends and reinvestment. "It'll come back" is a statistically defensible statement about the S&P 500 over twenty years.
- The asset can't go to a level that ruins you. Diversification means the index doesn't go to zero short of civilisational collapse, at which point your brokerage statement is not your main problem.
- The buying is scheduled, not reactive. Real DCA buys on the 1st of the month whether the market is up or down. It is emotionless by design. It isn't a response to being in pain; it's a calendar entry.
Now hold your leveraged forex add up against that list. You're using borrowed exposure, so an adverse move doesn't just shrink your holding, it eats the collateral that keeps every position alive. The asset has no reliable drift on your timeframe: EUR/USD is not a claim on anyone's earnings, and gold on a four-hour chart owes you nothing. The move against you can absolutely run far enough to ruin you, not because price goes to zero but because you go to zero long before price does anything historic. And the add is the opposite of scheduled: it's a reaction to pain, made at the precise moment your judgement is most compromised.
So when someone says "I'm just dollar cost averaging my short," they are using the vocabulary of a strategy whose every load-bearing assumption they have removed. It's like saying you're free soloing "the same way" a climber uses ropes. The word "climbing" appears in both. Nothing else does.
One more distinction worth pinning down. The DCA investor's worst case is waiting. The leveraged averager's worst case is forced liquidation at the bottom, which is not a longer wait but a permanent conversion of a temporary drawdown into a realized ruin. Markets do usually come back eventually. Accounts don't come back from zero, ever. If you want the grim mechanics of how far past zero things can technically go, we've written up whether a forex account can go negative separately, and it's not comforting reading.
The margin math: risk grows exactly as your buffer shrinks
Here's the engine room of the whole problem, and it fits in one sentence: every add increases your required margin at the same moment your equity is falling, so your survivable range collapses from both ends at once.
Let's make that concrete with numbers, because "collapses from both ends" is exactly the kind of abstraction this desk doesn't trust. Say you have a $5,000 account trading XAU/USD at 1:100 leverage. One standard lot of gold at 3,340 controls roughly $334,000 of exposure and requires about $3,340 of margin, which is far too much for this account, so you're sensibly trading 0.10 lots. Margin per 0.10 lot: about $334. On a 0.10 lot position, each dollar of movement in gold is worth $10 to you.
You short 0.10 at 3,340. Price rises to 3,352. You're down $120 and your equity is $4,880. Free margin: $4,880 minus $334, about $4,546. Annoying, entirely survivable. Your broker stops you out when equity falls to some percentage of used margin, commonly 50%, meaning this position dies only if equity reaches $167. That's $4,713 of adverse movement away, which on 0.10 lots is roughly 471 dollars of gold price. Gold would need to rally past 3,823. Practically speaking, you cannot be margin-called on this trade this week. You have room to be wrong.
Now you add 0.10 at 3,352. Watch three numbers move at once:
- Used margin doubles to about $668, because the broker doesn't care that the new position "hedges your average"; it's more exposure and it needs more collateral.
- Equity keeps falling twice as fast, because you now lose $20 per dollar of adverse movement instead of $10.
- Your stop-out equity level doubles to $334, because it's a percentage of used margin, which just doubled.
Read that third one again, because almost nobody prices it in. Averaging down doesn't just spend your free margin buying new exposure. It raises the floor at which the broker pulls the plug. Your survivable band gets squeezed from above (equity falling faster) and from below (stop-out threshold rising) simultaneously. Two hands around the same throat.
And notice what you got in exchange for all of it: your break-even moved from 3,340 to 3,346. Six dollars of convenience purchased with a doubling of your risk exposure, a doubling of your bleed rate, and a doubling of the level at which you get liquidated. Nobody who wrote those terms on paper and read them aloud would sign them. People sign them every day because the only number on the screen is the break-even.
Why averaging down in forex fails: the two distances
This asymmetry deserves its own section because it is the mathematical heart of the whole problem, and once you see it you can't unsee it on your own platform.
Each add is a trade between two distances. The distance from current price to your break-even shrinks. Good. The distance from current price to your stop-out also shrinks, and it shrinks more, because the add attacks the stop-out distance twice: it accelerates equity loss per pip and simultaneously raises the equity threshold at which liquidation triggers.
Run the gold short forward. Price is now 3,364, another $12 against you. On the doubled position that's $240 more damage: equity $4,640. You add a third 0.10 at 3,364, telling yourself this rally is exhausted, look at that wick.
Where do things stand? Average entry 3,352, so break-even is 12 dollars away instead of 24. Feels like progress. But used margin is now about $1,002, stop-out equity is about $501, and you're bleeding $30 per dollar of gold movement. Distance to stop-out: ($4,640 − $501) / 30, roughly 138 dollars of price. Before the first add it was 471. Your break-even got 2x closer while your ruin got 3.4x closer, and every subsequent add worsens the ratio, because equity keeps falling while margin keeps stacking.
Here's the same collapse as a table, because it's clearer than prose:
| Adds | Lots | Avg entry | Break-even dist. | Bleed per $1 move | Stop-out equity | Price dist. to stop-out |
|---|---|---|---|---|---|---|
| 0 | 0.10 | 3,340 | 0 at entry | $10 | ~$167 | ~$471 |
| 1 | 0.20 | 3,346 | $6 | $20 | ~$334 | ~$225 |
| 2 | 0.30 | 3,352 | $12 | $30 | ~$501 | ~$138 |
| 3 | 0.40 | 3,358 | $18* | $40 | ~$668 | ~$90 |
*Assuming a fourth add at 3,376 in the sequence we're about to walk. The exact figures wobble with your broker's margin model and where price sits when you add; the shape never does. Break-even distance creeps down arithmetically. Stop-out distance falls off a cliff.
Averaging down sells you a closer exit and quietly repossesses the road you'd need to reach it.
That's the trade you're actually making, every time. And the cruellest detail is that the person making it believes they're reducing risk. They can see the friendlier break-even. The stop-out maths lives three menus deep in the platform, and nobody opens that menu while adding. They open it after.
A worked collapse: three adds, one stop-out
Numbers in a table are one thing. Let's watch it happen to a person, because the sequence of feelings is as much a part of the mechanism as the margin formula. Call him Sam, $5,000 account, the gold short from above. Everything here is illustrative, but if you've traded leveraged products for more than a year you will recognise every beat.
Tuesday, 14:00. Sam shorts 0.10 XAU/USD at 3,340 off a resistance level he's watched for a week. Stop loss? He has one "in mind" at 3,355. In mind. Remember that.
Tuesday, 16:30. Price grinds to 3,352. The mental stop at 3,355 is three dollars away and Sam does not want to take a $150 loss on a setup he still believes in. Instead: add 0.10 at 3,352. Break-even now 3,346. The loss on screen halves in significance. Relief, which the brain files as evidence of a good decision. The mental stop quietly relocates to "above 3,360, if it closes there."
Tuesday, 21:00. A US session push tags 3,364. Down $360 now. Sam adds a third 0.10, because the daily RSI is stretched and "this is exactly where the retracement starts." Notice the thesis has changed without anyone announcing it. He shorted 3,340 because of resistance. He's shorting 3,364 because he's short from 3,340. The market is now being analysed for its ability to rescue him, which is not analysis.
Wednesday, 03:40. Asia takes it to 3,376. Equity is around $4,280 and falling $30 per dollar. Sam has stopped calculating anything. He adds a fourth 0.10 here, the "final bullet," a phrase that should be a fire alarm whenever you hear yourself think it. Used margin roughly $1,336. Stop-out equity roughly $668. He is now bleeding $40 per dollar of gold price and his survivable distance is about 90 dollars of movement, a liquidation price sitting just past 3,466. Twelve hours ago that distance was 471.
Wednesday, 08:15. A stronger-than-expected data print, gold pops $40 in forty minutes and then keeps grinding higher through London as the shorts get squeezed. By early afternoon it prints 3,466. That's $3,600 gone since the last add. Equity punches through the stop-out threshold and the broker's computer, which has no ego invested in 3,340 being resistance, liquidates the whole stack. Account remainder: roughly $650. The position Sam originally opened, 0.10 lots with a $150 stop, would have cost him 3% of the account. The averaged version cost him about 87%.
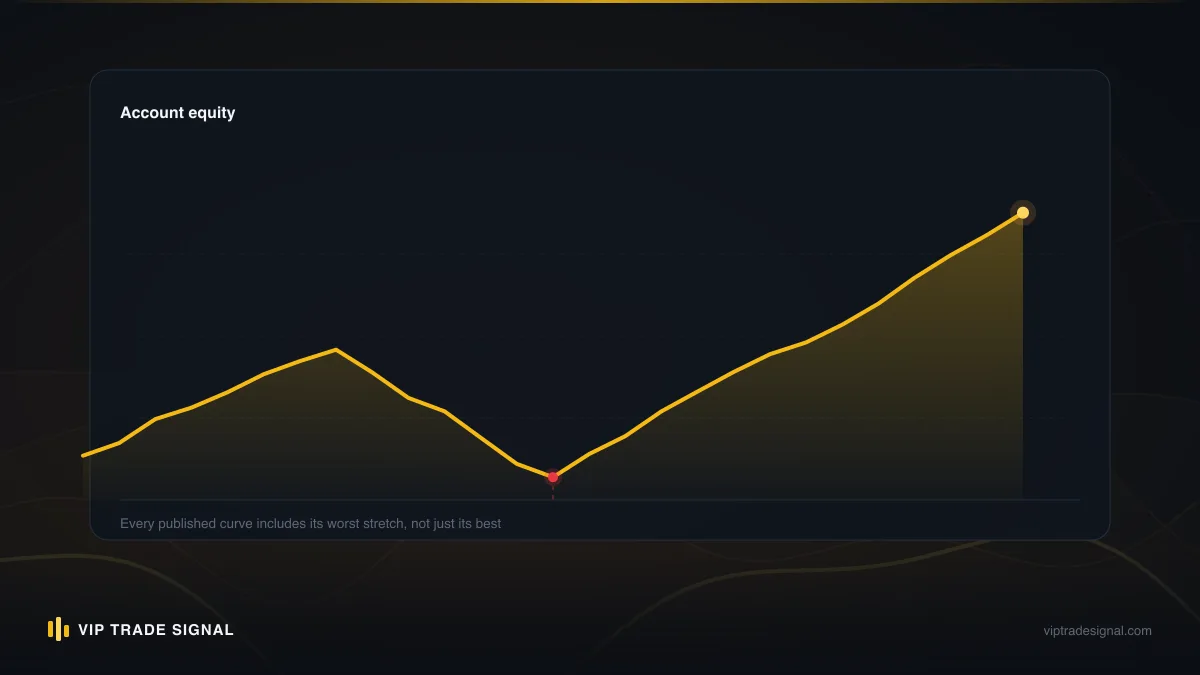
Thursday. Gold tops out a few dollars above the liquidation print and spends the next week falling all the way back to 3,330. Sam's directional read was eventually right. The disciplined version of this trade takes its $150 stop on Tuesday, shrugs, and is flat and solvent when the real reversal arrives, free to short it again. This is the part that breaks people, so say it plainly: averaging down doesn't just lose money, it converts a survivable wrong into ruin, and it makes sure you're not around for the move you predicted. The market did come back. Sam wasn't there.
If you want the general framework for that fork in the road, the moment where you're deciding whether to close the losing trade or wait it out, we've gone deep on it elsewhere. The short version: the decision has to be made on the trade's forward-looking merit, and averaging down is what happens when it's made on backward-looking pain instead.
Sunk cost in a strategy costume
Everything above is arithmetic, and arithmetic alone doesn't explain why smart people do this repeatedly. The engine is psychological, and it has a name older than any trading platform: the sunk cost fallacy. You've already committed money to this view, so abandoning the view feels like wasting what's committed, so you commit more to protect it. Casinos, failing renovations, six-year relationships and forex accounts all run on the same firmware.
But trading adds two accelerants that make the ordinary fallacy so much worse.
The first is that averaging down provides instant relief. The moment you add, your average entry improves and the per-unit loss shrinks on screen. Nothing about your situation has improved. Your total dollar loss is identical, your risk has multiplied. But the screen looks better, and the screen is where the feelings live. It's the only strategy failure I know of that pays out a hit of comfort at the exact moment you deepen the hole, which makes it less like a mistake and more like a substance.
The second accelerant is intermittent reinforcement, the most powerful training schedule known to behavioural science. Averaging down works most of the time. Markets chop. Price revisits levels. Maybe seven or eight times out of ten, the add gets you out flat or better, and each save deepens the habit. Then the trending day arrives, the one that doesn't come back, and it collects everything. The maths of this payoff profile is brutal: many small wins, rare total losses. It's a picked-up-pennies-in-front-of-a-steamroller distribution, and the seven saves make the steamroller more likely to hit you, because by then you're adding with confidence and size.
There's a self-diagnosis that cuts through all of it, and we'd suggest actually asking it, out loud, before any add: "If I had no position right now, flat, fresh eyes, would I open a short of this size at this exact price?" If the honest answer is no, then the add isn't a trade. It's a payment to avoid feeling wrong, and it's the most expensive purchase in the building. The market does not know your average entry. It does not owe your break-even a visit. Every candle is being auctioned to people with no knowledge of, or interest in, the price you need.
One more tell. Listen for vocabulary changes. Traders opening positions say "setup," "level," "risk." Traders averaging down say "recovery," "get back to break-even," "it has to bounce eventually." When the goal of a trade becomes escaping the trade, the strategy has already died and you're negotiating with its ghost.
When scaling in is legitimate
Now the honest part, because "never add to a losing position" shouted as an absolute would be tidy but slightly false, and this desk doesn't do tidy over true. There are professional contexts where entering a position in pieces, some of those pieces at worse prices than the first, is a sound plan. What matters is that legitimate scaling differs from averaging down structurally, not by degree. Different species, not a milder version.
Planned scaling into a position looks like this:
- The full size is decided before the first order. You want 0.30 lots short between 3,340 and 3,364, and you split it 0.10/0.10/0.10 at levels chosen in advance. The last add doesn't take you to a size you'd never have opened in one go. It completes a position you always intended.
- The risk is computed on the full stack at the final average, before entry. If all three tranches fill and the stop is hit, you lose a known, pre-accepted amount, say 2% of the account. Sam's risk was computed nowhere, by nobody, at any point.
- There is one hard stop for the whole structure and it never moves. This is the bright line. A scaled entry has a price at which the entire idea is declared wrong and the whole position closes. Averaging down is defined by the absence, or the migration, of that price. Show me the stop and I'll tell you which one you're doing.
- The adds are at levels, not at pain. Tranche two fills because price reached a pre-chosen zone that was on the chart before entry, not because the drawdown reached a number your stomach couldn't hold.
- A missed fill is fine. If price runs from tranche one and the other adds never fill, a scaler shrugs and takes the win at reduced size. Someone averaging down never has this experience, because their adds are triggered by losing, and losing always shows up to trigger them.
Frame it this way: scaling in buys a pre-sized position at an average price. Averaging down grows an unbounded position to defend an old price. One has a ceiling and an exit. The other has a floor made of hope.
There's also the trend-following tradition of adding to winners, pyramiding into a position as it proves itself, which is close to the exact photographic negative of averaging down: size grows as evidence accumulates that you're right, with stops trailing so the whole stack risks initial capital only. Notice the pattern. The traders with the longest track records add when winning and cut when losing; the accounts that vanish in a weekend do precisely the reverse.
If you can't state, in one sentence, the full planned size and the single price at which everything closes, you are not scaling in. You're averaging down and dressing it up.
Averaging down vs zone recovery vs cutting
Once a trade is underwater, there are really four families of response, and it's worth lining them up honestly, because two of them get sold hard by people with something to sell.
Cutting. Close at the planned stop, take the small realized loss, re-evaluate flat. Cost: known, capped, paid immediately, plus the emotional tax of being visibly wrong. This is the boring correct answer roughly 90% of the time, which is exactly why it has no marketing budget. Nobody sells a $499 course called "Take Your Stop."
Averaging down. Covered above. Uncapped cost, deferred payment, compounding risk, high short-term success rate concealing catastrophic tail risk.
Zone recovery / hedged "no-loss" systems. The sophisticated cousin, beloved of EA vendors: when the trade goes against you, open an opposite position of larger size, and if that goes against you, flip again bigger, ping-ponging with growing size until one leg's profit covers the accumulated losses. It demos beautifully in ranging markets. In practice it's averaging down with extra steps and worse spread costs: the position sizes grow geometrically, the margin load stacks just like our table, and a market that chops precisely across your recovery zone (which markets do, spitefully often) grinds the account down through spreads and swaps until the same margin wall arrives. Anything marketed as "no loss" should be read as "no realized loss until the one very large one." The loss isn't eliminated; it's stored, with interest.
Structured repair with a baseline. Reduce exposure to survivable levels first, define a hard risk boundary, then work the remaining position within strict rules and accept that the outcome may still be a managed loss. Less exciting than "no loss." Considerably more compatible with still having an account in December.
The honest summary: everything except cutting is a way of paying for the loss later instead of now, and the market charges savage interest on deferred losses. The only defensible versions are the ones where the deferral is bounded, sized, and supervised by rules written when you were calm.
Repairing an already-averaged stack
Fine, but what if you're reading this while holding one? A stack of averaged entries, floating loss big enough that closing it all feels like amputation. This is the situation we see most weeks, so here's the sequence we'd actually apply, in order, no steps skipped.
First, stop adding. Now. Whatever the level looks like, whatever the RSI says. The next add is not a decision you're qualified to make while holding this position, and the maths above explains why: you'd be spending your last survivable distance to move break-even a few dollars. Out of ammunition beats out of account.
Second, measure reality. Write down, on paper, off the platform: equity, used margin, stop-out level in actual price, swap cost per day, and the exact distance to liquidation. Most people in an averaged hole have never computed the liquidation price. The number is usually closer and the daily swap bleed usually larger than they'd have guessed, and seeing it in your own handwriting does something the platform's cheerful red number doesn't.
Third, cut the stack down to a survivable core. This is the step everyone resists, because closing part of the position realizes part of the loss. Do it anyway. If you're holding 0.40 lots of pain, getting to 0.10 or 0.15 quadruples your survivable distance and drops your bleed rate to where a normal retracement, the thing you've been praying for, can actually matter before the margin wall arrives. Partial realized losses are the price of buying back time, and time is the only asset that helps you now.
Fourth, set a real stop on what remains and write down a baseline. The remaining position gets a hard invalidation price, entered on the platform, not held "in mind" (we saw how that goes for Sam). And record your current equity as a baseline, because from here the goal is measured recovery from this point, not teleportation back to the old high-water mark. Chasing the old break-even is how the stack got built.
Fifth, decide whether you should be the one doing this. Honest self-assessment: the person who built the stack is usually the worst-placed person to unwind it, for the same reason you don't mark your own exam. If the account is deep enough underwater that the maths genuinely needs professional handling, this is exactly the situation our drawdown management service exists for: accounts floating roughly $5k to $10k down, worked on your own MT4/MT5 account with a jointly recorded baseline, and we take a flat 50% of whatever is actually recovered above it. Nothing recovered, nothing owed, and we will not pretend recovery is guaranteed, because sometimes the correct professional action is an orderly managed exit that saves what remains. Anyone who does guarantee recovery of an underwater account is describing a miracle for money, and you should walk away at whatever speed feels natural. We've written up the whole approach as a drawdown management playbook if you'd rather steal the method and run it yourself.
What you should not do is the thing the forum threads suggest at 3am: hold everything, hedge with an equal opposite position "to freeze it," and wait for clarity. A full hedge locks the loss, doubles the margin footprint at many brokers, bleeds two spreads and two swaps, and mostly functions as a way to stop looking at the problem. Frozen losses don't heal. They just wait, and cost rent.
The rule that replaces the habit
Rules that survive contact with a live losing position have to be short, binary, and decided in advance. "Be disciplined" is not a rule; it's a wish. Here's the one we'd tattoo on the platform if brokers allowed it:
Size and stop are decided before entry. After entry, position size only ever goes down.
That's it. Two sentences. You can scale out, take partials, trail the stop, close early. You can never make the position bigger once it exists, unless the add was written into the plan, with its level and the whole structure's single stop, before the first order went in. This single constraint makes the Sam sequence impossible. Not unlikely. Impossible. The 16:30 add can't happen, so the 21:00 add has nothing to rescue, so Wednesday morning is a $150 stop-loss and a shrug instead of a funeral.
And notice what the rule quietly enforces: if you can never add, then your first entry has to be sized as though it's your only one, which means sizing it to survive being wrong. A $5,000 account risking 1% has $50 of room per trade; on a 0.10 gold lot that's a $5 stop, so either the stop widens and the size drops to 0.02, or the setup doesn't offer a sane stop and doesn't get traded. Averaging down and oversizing are the same disease at different stages. The averager's first position was usually too big for its stop, which is why honouring the stop felt unbearable, which is why the mental stop existed, which is why the add happened. Fix the first domino and the rest never line up.
A few supporting habits that make the rule hold under fire:
- Put the stop in the platform at entry, every time. A stop in your head is a stop the 2am version of you gets to renegotiate, and that person has terrible judgement and your password.
- Pre-write your averaging excuse. Seriously. On a sticky note: "You will want to add because break-even moves closer. Remember the stop-out moves closer faster." Reading your own calm handwriting mid-drawdown is oddly effective.
- Log every urge to add, even the ones you resist. A month of entries shows you exactly which market conditions and account states trigger it. Ours mostly said: after two prior losing days, in the New York afternoon. Forewarned is forearmed.
- If you follow signals, follow their stops. Every gold signal we publish carries a defined stop, and every closed one, wins and losses both, sits publicly at /signals/history precisely because losses taken at planned stops are the normal cost of trading, not an emergency to be averaged out of existence. A signal service that never shows a loss is showing you marketing, not trading. There's more on how our stops and entries are structured over in the FAQ if you want the mechanics.
None of this makes losing pleasant. It makes losing cheap, which is the entire game. Gold and forex trading on leverage is high-risk by nature and a percentage of your trades will lose no matter who you are; the only thing actually under your control is whether a loss costs you 1% or the account.
Where this leaves you
Strip everything back and averaging down in forex fails for one structural reason: it deploys your defensive resources, margin and equity, as ammunition for offence, at the precise moment your defence is weakest and against a market that has just demonstrated it disagrees with you. The stock investor's version survives because nothing can force them out. Your version dies because something can, and every add invites it closer while whispering that it's helping.
So here's the audit, and it takes ten minutes. Open your trading history, the real one, and find every trade where you added after the position went against you. Not the ones you remember. All of them. Total the outcomes honestly, including the account that stopped existing, if there is one. Nearly everyone who runs this exercise finds the same shape we've described: a pleasing string of small saves, and one or two entries whose losses swallow the string whole and then keep going.
If your history shows that shape, you don't have an analysis problem. Your entries might genuinely be good; Sam's was. You have a surviving-your-own-position problem, and no amount of extra chart study fixes it, because the leak isn't in the finding of trades. It's in the holding of them. The fix is the two-sentence rule, sized-down first entries, and stops that live in the platform rather than in your head.
And if you're past prevention, if you're currently sitting inside an averaged stack reading this with that specific cold feeling in your stomach, then triage beats theory: stop adding, measure the real liquidation distance, cut to a survivable core, set the baseline. Get help with the unwinding if the hole is deep, whether from us or from anyone competent who will look you in the eye and refuse to promise you a recovery.
The market will offer you the averaging-down trade again this week. Same seductive break-even maths, same costume. You know what's under it now.