Ask ten traders what a good maximum drawdown is and eight of them will say "under 20%" with the confidence of someone reciting a phone number. Ask the follow-up question (why 20%, why not 14% or 31%?) and the room goes quiet. The number gets passed around like folklore. Nobody remembers where it came from, and almost nobody has checked whether it applies to their account size, their strategy, or their actual tolerance for watching money disappear.
That's a problem, because maximum drawdown is probably the single most useful number on any trading track record. Return figures lie constantly. A 300% year tells you nothing on its own; it might be brilliance, it might be a martingale grid that hasn't detonated yet. Maximum drawdown is much harder to fake over a meaningful sample, and it answers the question that actually matters: what is the worst this thing has done to the people who trusted it?
So let's actually earn the benchmark instead of reciting it. The numbers worth trusting fall out of recovery arithmetic, drawdown duration, and what real funds, prop firms and retail traders demonstrably live with. Work through those and you can look at your own equity curve, or anyone else's, and judge it honestly instead of parroting a threshold you can't defend.
What maximum drawdown actually measures
Maximum drawdown is the largest peak-to-trough decline in the value of an account or strategy, expressed as a percentage of the peak. That's the whole definition, but each word in it is doing work, so let's slow down.
Peak-to-trough. Not start-to-worst-point, not high-to-close. You find every new equity high the account ever made, and for each one you measure how far the account fell before it made a newer high. The biggest of those falls is your max drawdown. If an account grew from $10,000 to $14,000, sank to $10,500, then recovered and pushed on to $16,000, the drawdown that matters is the slide from $14,000 to $10,500: a fall of $3,500 from a $14,000 peak, or 25%. The fact that the account never went below its starting balance is irrelevant. Someone who joined the strategy at the $14,000 peak lived through the full 25%, and plenty of people do join at peaks, because peaks are when the marketing looks best.
That last point deserves a second more of your attention. Max drawdown is an investor-experience metric. It measures the worst entry point in the strategy's history. When you see a track record with 22% maximum drawdown, the correct reading is: at least one person who started following this at the wrong moment watched more than a fifth of their money evaporate before things turned. And the past worst case is a floor, not a ceiling. A strategy that has drawn down 22% can draw down 35% next year. History only tells you what has already happened; it has no opinion about next month.
One more distinction before we move on: equity versus balance. Your balance only changes when trades close. Your equity moves tick by tick with open positions. A strategy can show a smooth balance curve while its equity is regularly plunging 30% intra-trade, because it holds losers open and only closes winners. Real maximum drawdown is measured on equity. Any figure measured on closed balance alone is, at best, half the story. We'll come back to this when we talk about how the number gets gamed.
Max drawdown vs absolute and relative drawdown
If you've ever opened an MT4 or MT5 strategy tester report, you've seen three drawdown figures sitting next to each other, and the terminology trips up almost everyone. They are not interchangeable, and comparing one seller's "absolute drawdown" against another's "maximal drawdown" is how people end up buying the wrong thing.
Absolute drawdown measures the drop below your initial deposit. Start with $10,000; if the lowest the account ever fell was $9,400, absolute drawdown is $600, full stop. It doesn't matter that the account later hit $25,000 and crashed back to $15,000. Absolute drawdown stays at $600, because the account never went below the starting line again. It's the friendliest of the three numbers, which is exactly why marketing material loves it. An account can lose 40% off its highs and still report a tiny absolute drawdown.
Maximal drawdown (MT4's slightly odd phrasing for maximum drawdown) is the biggest peak-to-trough fall anywhere in the history, in currency terms and as a percentage. This is the number that describes the worst ride anyone took.
Relative drawdown is the largest peak-to-trough fall expressed as a percentage of the equity at the time of the peak. In most retail contexts, relative and maximal drawdown percentages are effectively the same figure presented differently; the distinction that matters is currency versus percentage. A $2,000 drawdown on an account that peaked at $4,000 is a 50% relative drawdown and a survivable-sounding "$2,000 maximal drawdown" in the same report.
The absolute vs relative vs maximum drawdown distinction sounds academic until you watch it used against you. A seller quoting "drawdown: 4.2%" without specifying which measure, on which basis (balance or equity), over which period, is telling you roughly nothing. When we publish our own closed signals at /signals/history, the losers sit there next to the winners precisely because a track record that only shows one drawdown flavour, cherry-picked, isn't a track record. It's an advert.
Quick reference, because this genuinely trips people up:
| Measure | Baseline | What it tells you | How it gets abused |
|---|---|---|---|
| Absolute drawdown | Initial deposit | How far below the starting balance the account ever fell | Looks tiny once the account has grown; hides late-stage crashes entirely |
| Maximum (maximal) drawdown | Highest equity peak | The worst peak-to-trough loss in history | Quoted on closed balance instead of floating equity |
| Relative drawdown | Peak equity, as % | Same worst loss, scaled to account size at the time | Quoted in dollars on a big account to sound small |
The formula and a worked calculation
The formula itself is nothing:
Maximum drawdown = (peak value − trough value) / peak value × 100
The interesting part is applying it properly, because the peak and the trough have to be matched: the trough must come after the peak, and before the next equity high. Let's walk a full example, since this is where people make mechanical mistakes.
Say a trader we'll call Dan runs a gold strategy through eight months, and his month-end equity reads:
- $10,000 (start)
- $11,200
- $12,600 (new high)
- $11,100
- $10,300 (trough)
- $12,900 (new high)
- $12,100
- $14,400 (new high)
There are two drawdowns here. The first runs from the $12,600 peak in month three to the $10,300 trough in month five: (12,600 − 10,300) / 12,600 = 18.3%. The second runs from $12,900 to $12,100: (12,900 − 12,100) / 12,900 = 6.2%. Maximum drawdown is the bigger of the two, so Dan's figure is 18.3%, even though he finished the period up 44%, and even though his account never once dropped below its starting balance. Absolute drawdown here is zero. See how differently those two numbers describe the same eight months?
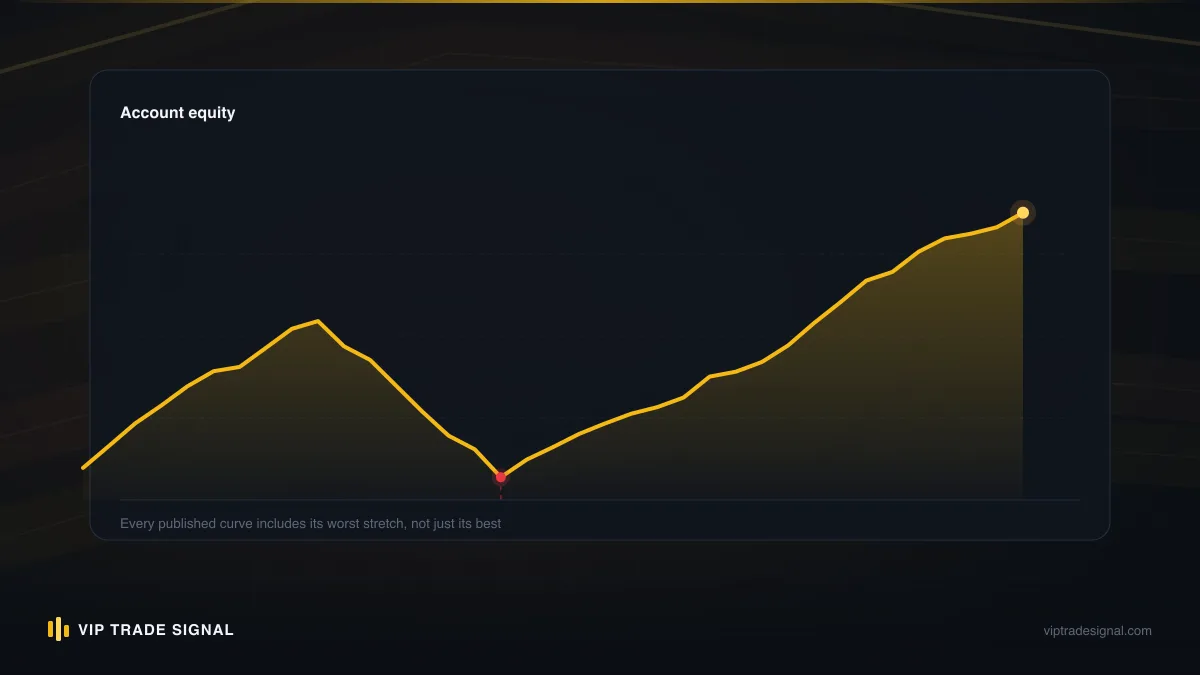
Now the part that turns the definition into a decision tool: recovery arithmetic. Losses and gains are not symmetrical, and the asymmetry gets vicious as drawdowns deepen. Lose 10% and you need 11.1% to get back to the peak. Lose 20% and you need 25%. Lose 33% and you need 50%. Lose 50% and you need a clean double, a full 100%, just to be back where you started, earning nothing for the entire journey.
Run those numbers against a realistic return expectation and the folklore benchmarks suddenly acquire a reason to exist. Suppose your strategy genuinely earns 25% a year, which would put you in rare company if sustained. A 20% max drawdown costs you a 25% recovery: a full year of your best-case performance spent climbing back to breakeven. A 35% drawdown demands 54%, call it two years underwater. A 50% drawdown wants 100%, which at 25% annually compounded is more than three years of flawless execution just to see the old peak again. And that assumes the strategy still works, and that you're still psychologically capable of executing it, neither of which is guaranteed after that kind of beating.
This is why "under 20%" became the folk threshold. It isn't magic. It's roughly the depth at which a good strategy can plausibly repair the damage within a year. Deeper than that, and the recovery time stops being a rough patch and starts being an era.
So what counts as a good maximum drawdown?
Now we can answer the actual question, and the honest answer is: it depends on who's trading, with what, for whom. But the ranges are knowable, so here they are.
Institutional funds and CTAs. The professional asset-management world generally treats anything beyond 15-20% as a career problem. Not because the maths is different for them, but because their investors are allocators who redeem at the first sign of trouble, and redemptions during a drawdown turn a bad patch into a death spiral. Many allocators screen out any manager whose max drawdown exceeds their annualised return. A large trend-following CTA might tolerate 20-25% because its investors sign up for lumpy returns, but a fund marketing itself on steady performance lives or dies inside single digits.
Prop firm traders. Funded-account programmes hard-code the answer into the contract: typically 8-12% maximum total drawdown and 4-5% daily, and breaching either doesn't dent the track record, it ends the account. Whatever you think of the prop-firm business model (and we think plenty), those thresholds are informative. Firms letting thousands of traders loose on their nominal capital, with real statistics on who blows up, concluded that beyond roughly 10% the odds of full recovery drop off a cliff. That's not marketing. That's an actuarial decision made by people who pay out when traders survive.
Retail self-directed traders. Here the honest range is wider and uglier. A disciplined retail trader risking 1-2% per trade will typically live with 15-30% max drawdown over a few years of trading, because retail strategies are less diversified and retail nerves produce worse execution during losing streaks. Most retail accounts, of course, don't have a "max drawdown" in any meaningful sense. They have a countdown. The commonplace that the majority of retail CFD accounts lose money is printed on every broker's own risk warning, and a max drawdown of 100% is just the technical description of how that usually ends.
Rough map of the territory:
| Trader type | Typical max drawdown | Beyond this, alarm bells |
|---|---|---|
| Conservative fund / allocator-facing | 5-15% | 20% |
| Trend-following CTA | 15-25% | 30% |
| Prop firm funded trader | capped at 8-12% | breach = account gone |
| Disciplined retail (1-2% risk) | 15-30% | 40% |
| Typical retail reality | 30-100% | it already rang |
So what is a good maximum drawdown percentage for you, reading this with a personal account? Our take, and it is a take: under 15% is genuinely good, 15-25% is normal and survivable, 25-40% is a warning that something in your sizing or method is oversized, and beyond 40% you no longer have a drawdown problem. You have a strategy problem wearing a drawdown costume. And one more rule that outranks all the ranges: your max drawdown should be smaller than your annual return. An account that returns 20% a year with a 45% historical drawdown isn't a growth story with a rough patch in it. It's a rough patch with occasional growth.
Duration: the half of drawdown nobody quotes
Depth gets all the attention because it's one dramatic number. But ask anyone who has actually sat through a long drawdown which part hurt, and they won't talk about the day the account hit its low. They'll talk about month four. The greyness of it. Logging in every day to an account that is simply still down, taking valid setups that go nowhere, while some bloke on a forum posts his third funded-account payout of the quarter.
Drawdown duration is the time from an equity peak to the next new equity high: the full round trip, not just the fall. And the durations are longer than almost anyone expects. A strategy with a genuine edge, say 55% win rate at even money, will still routinely produce losing streaks of six, seven, eight trades; chain a couple of those together with mediocre patches between them and a competent strategy can sit below its high-water mark for four to eight months without anything being wrong. Equity curves spend far more of their life below the last peak than at new highs. That's not a flaw. That's what the texture of real performance looks like.
As a working maximum drawdown duration benchmark: a strategy trading daily-to-weekly timeframes that recovers its drawdowns within three to six months is behaving well. Six to twelve months is uncomfortable but within the range a sound method can produce. Beyond twelve months underwater, you're entitled (obliged, really) to ask whether the edge still exists, because markets change and a drawdown of unprecedented length is often the first measurable symptom of an edge that has quietly died. Depth tells you about risk. Duration tells you about whether the thing still works.
A 15% drawdown recovered in six weeks and a 15% drawdown that grinds on for fourteen months are the same number and completely different diseases.
Duration is also where the psychological damage compounds, and psychology is a performance input, not a footnote. Traders in month one of a drawdown mostly follow their rules. Traders in month seven start "adjusting": skipping valid signals after losses, doubling size to hurry the recovery, adding a martingale "just temporarily". Every one of those adjustments makes the eventual outcome worse, and every one of them is a predictable response to duration, not depth. It's the same failure chain we described in our piece on overleveraging. The account rarely dies from the original losses. It dies from the recovery attempt.
Recovery factor: putting depth and return in one number
Max drawdown on its own has a blind spot. It says nothing about what you were paid for enduring it. A 10% drawdown sounds better than a 25% one, but not if the 10% strategy returned 6% over three years while the 25% strategy returned 180%. Risk means nothing without the reward it purchased, which is where the recovery factor comes in.
Recovery factor = net profit / maximum drawdown, both in currency terms over the same period. An account that made $30,000 against a worst drawdown of $10,000 has a recovery factor of 3. In plain speech: for every pound of worst-case pain, how many pounds of profit did you actually bank?
Reading it is refreshingly simple. Below 1, the strategy's worst moment was bigger than everything it ever earned; its history contains at least one point where a departing investor would have lost more than the strategy's whole net achievement. Between 1 and 3 is unremarkable: real edge, expensive to hold. Above 3 over a multi-year record is genuinely good. Above 5 across hundreds of trades and several market regimes is the kind of number serious allocators lean forward for. And above 10 on a young account is, bluntly, where our scepticism kicks in rather than our admiration, because short lucky streaks produce spectacular recovery factors right up until they produce a margin call. The recovery factor trading metric only means something once the track record is long enough to contain some genuine misery: two years or a few hundred trades, minimum.
One caution: recovery factor inherits every measurement flaw of its denominator. Feed it a fake max drawdown (balance-based, equity-hidden, conveniently windowed) and it returns a fake answer with an extra coat of authority. Fix the drawdown measurement first; the ratio is only ever as honest as the worst number in it.
Used honestly, though, it reframes the original question nicely. "Is 20% a good max drawdown?" has no answer. "Is 20% a good max drawdown for a strategy that netted 80% over the same period?" does. That's a recovery factor of 4, and yes, that's a strategy worth taking seriously.
Your position size already decided your max drawdown
Here's the part most drawdown articles skip entirely, and it's the most practically useful section in this one: your maximum drawdown isn't primarily a property of the market, or of your entries, or of gold's mood in any given quarter. It is mostly a mechanical consequence of your position sizing, and you can estimate it before you ever place a trade.
The engine is losing-streak maths. Any strategy with a win rate below 100% (so, any strategy) will produce consecutive losses, and the streak lengths are boringly predictable. Over a few hundred trades, a 50% win rate should expect a streak of eight or nine losses somewhere in the sample. A 60% win rate still delivers streaks of six. These aren't tail events to be shocked by; they are as close to scheduled as anything in trading gets. If you trade long enough, your streak is in the post.
Now multiply by your risk per trade. Risking 1% per trade, a nine-loss streak digs a hole of roughly 8.6% (the losses compound slightly in your favour as the base shrinks). Add the surrounding mediocre patches that always accompany a streak and a realistic max drawdown lands somewhere near 12-15%. At 2% risk, the same streak produces about 16.6%, with a realistic max in the mid-20s. At 5% risk, which is where an alarming number of retail traders actually operate, whether they admit it or not, nine straight losses is a 37% hole, and the realistic max drawdown is the kind of number that ends accounts. Same entries. Same market. Same streak. The only variable that changed is the size, and it took the outcome from "annoying quarter" to "start again".
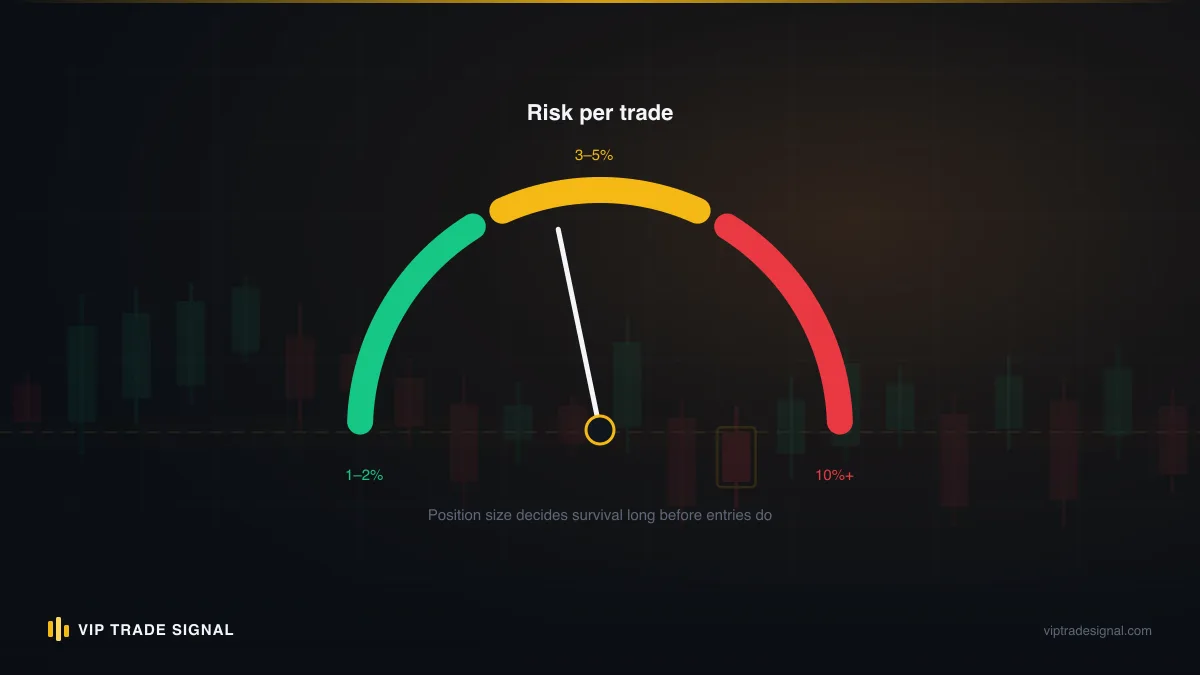
Run this backwards and you get something valuable: a personal drawdown budget. Decide the deepest drawdown you could endure without breaking (honestly, not aspirationally), then divide by your expected worst losing streak plus margin. If 20% is your ceiling and your method should expect nine straight losses, you can afford about 1.5% per trade, and not the 4% you've been risking because last month felt good. On a $5,000 account, that's $75 of risk per trade, sized in lots off your actual stop distance in dollars per pip. There's also a tactical layer on top: managing trades so full stops get hit less often, which is much of why we bang on about taking partials. A banked partial turns some would-be full losses into scratches, and shaves real depth off the drawdowns the streak maths predicts.
We trade gold exclusively, and gold makes this arithmetic less forgiving than the EUR/USD version of it. XAU/USD can travel $30 in an hour on a data print; stops need room, which means proper sizing means smaller lots than most people's instincts suggest. Half the blown gold accounts we've seen weren't wrong about direction. They were right about direction and wrong about size, which pays exactly the same as being wrong about everything.
Reading max drawdown on Myfxbook and MT4 reports
Theory into practice: here's how to actually read the number on the two report formats you'll meet most often, and where each one hides the bodies.
MT4/MT5 account statements and Strategy Tester reports give you the three figures we covered earlier: absolute, maximal, relative. The traps? First, the tester's drawdown on anything but tick-quality data understates intra-bar equity swings, sometimes badly. Second, and far more important on live statements, the report is built from closed trades. An account running a grid or averaging-down system can hold twenty open losers with equity down 45% while the statement's drawdown figures stay serene, because nothing has closed. On any MT4/MT5 record, before you look at a single ratio, look at the open trades and the floating P/L. If there's a wall of red positions with no stops, the drawdown statistics are fiction with a decimal point.
Myfxbook is better because, when properly connected, it tracks equity. The drawdown figure in the header is a peak-to-trough equity measure, which is the honest kind. But read past the headline. Open the interactive chart and toggle the equity line on alongside balance: a balance line marching smoothly upward above an equity line that keeps plunging into deep valleys is the visual signature of hidden floating losses, and it's unmissable once you know to look. Check the drawdown chart tab for duration, not just depth. How long were the underwater stretches? Check that the track record is verified on both "track record" and "trading privileges", because unverified accounts can be demo, and demo drawdowns are the least meaningful numbers in this entire industry. And check the account's age against its drawdown: 6% max drawdown over four months means nearly nothing; 16% over four years is a real, tested figure.
A workable checklist when someone shows you a track record:
- Is drawdown measured on equity, not just closed balance?
- Over how long, and how many trades? Under a year or a couple hundred trades, treat everything as provisional.
- What's the duration of the worst underwater stretch, not just its depth?
- Do open floating losses exist right now, and are they included?
- Does max drawdown stay comfortably below the annualised return?
- Are losses visible at all? A record with no red in it hasn't traded through anything.
Point six is the fastest filter in existence, and it's why every closed signal we issue, the stopped-out ones very much included, sits publicly at /signals/history. Any service that won't show you its drawdown has answered your question about its drawdown.
When a low max drawdown is a lie
Time to be blunt about the dark side of this metric, because a suspiciously low max drawdown is behind more retail wipeouts than any high one.
The classic mechanism is the one we keep circling: strategies that don't take losses. Martingale grids, averaging-down systems, no-stop "zone recovery" EAs. These produce beautiful statistics by construction (win rates in the high nineties, drawdown in low single digits, month after green month) because every losing position is held and doubled into until price comes back. And gold being gold, price usually does come back, which is why these systems run for one or two seductive years. Then comes the move that doesn't return: a 2020-style panic, a repricing after a Fed shock, one of those weeks where XAU/USD travels $150 without a meaningful pullback. The equity that was quietly floating 30% down goes to margin call in an afternoon, and the track record's final entry is a 100% drawdown arriving out of a clear blue 3% history. The low number wasn't risk management. It was risk deferral, with interest.
Other flavours of the same lie: the restarted account (blow up, open a fresh account, market the young clean one; serial restarters always have a track record that's eighteen months old, and always will); the convenient window ("12% max drawdown since January", where January sits just after the crater); the demo-to-live shuffle, where the published curve is demo and the live results are, mysteriously, different; and survivorship marketing, where a provider runs five internal strategies and only ever shows you whichever one is currently on a good run.
The tell across every variant is the same, and it's worth internalising: track records with real edges look slightly disappointing. They contain visible losses, drawdowns that took months to repair, flat stretches, the odd ugly quarter. A record that looks perfect is either too short to mean anything or constructed not to show you the truth. When you're choosing what to follow, an honest 20% max drawdown beats a fraudulent 3% every single time, because the honest number has already shown you the bill. The fraudulent one just hasn't invoiced you yet.
Setting a personal max drawdown limit
Everything so far has been about reading other people's numbers. The more important use of maximum drawdown is setting your own limit before the market sets one for you, because the market's version is 100%, and it's always accepting applications.
A personal max drawdown limit is a pre-committed equity level at which you stop trading and reassess. Not "trade more carefully". Stop. The reason it must be set now, in cold blood, is that the person who will actually be at the controls when the limit is hit (you, seven losses deep, sleep-deprived and furious) is the least qualified decision-maker you will ever be. Drawdown decisions made inside the drawdown are how 18% becomes 55%. You're legislating for a future self you shouldn't trust.
How to set the number, in four steps:
- Find your honest pain threshold. Take your account balance and write down actual currency amounts at 10%, 20%, 30% down. On a $10,000 account that's $1,000, $2,000, $3,000. Find the figure that would genuinely change your sleep, your mood at dinner, your judgement. For most people it's lower than their self-image suggests. Be one of the honest ones.
- Take about 80% of it as your hard limit. If 25% is where you'd crack, set the stop at 20%. You want the limit to trigger while you're still rational, not at the exact edge of your composure.
- Derive your risk per trade from it, using the streak maths from earlier: limit divided by expected worst streak, with margin. A 20% limit against a plausible nine-loss streak plus slop lands you at 1.5% per trade, give or take. If that produces position sizes that feel insultingly small, good. That feeling is the gap between your risk appetite and your risk capacity, and the account lives in that gap.
- Add a soft tripwire at half the limit. At 10% down, cut position size by half and review your last twenty trades against your rules. Most drawdowns that end accounts announced themselves at half depth, and were ignored.
And decide now what happens at the hard limit: a fortnight flat minimum, a written review of every trade in the drawdown, and a return at half size until a new equity high. The traders who survive twenty years in this business aren't the ones who never drew down. They're the ones who had a tripwire and respected it.
A word for anyone reading this from inside the hole rather than above it, floating $5,000 or $8,000 down, no stops, hoping. The rules change down there. Recovery from a deep floating drawdown is a different discipline from normal trading: it's triage, position by position, and the worst possible approach is doubling down to hurry it. That's the specific situation our drawdown management service exists for, and we run it on a no-recovery-no-fee basis — a flat 50% of whatever gets recovered above a baseline we record together, and nothing otherwise — for a reason we're upfront about: nobody can guarantee a recovery, and we won't pretend otherwise, so we only get paid if it works. We've written separately about how no-win-no-fee recovery works and, just as importantly, when it can't. But whether it's us, another professional, or you alone with a triage plan, the principle stands. A drawdown that big stops being a trading problem and becomes a capital-preservation problem, and it should be handled by whoever is calmest. Which, right now, is probably not you.
Where this leaves you
Strip the folklore away and maximum drawdown resolves into a few defensible claims. It measures the worst entry anyone ever made into a strategy, and only means something measured on equity over a record long enough to include real pain. Under 15% is genuinely good; 15-25% is the honest territory most sound strategies live in; anything approaching your annual return is a warning, and anything past 40% is a sizing failure that has already happened, whatever the entries looked like. Duration deserves equal billing with depth, because a fourteen-month underwater stretch says more about a dying edge than any single bad week. Recovery factor tells you what the pain purchased. And a low drawdown attached to a no-loss track record isn't safety. It's a bill that hasn't arrived.
But the claim we'd most like you to leave with is the uncomfortable one: your max drawdown was mostly decided the moment you chose your position size. The market supplies the losing streak; it always does, to everyone, on schedule. Your size decides whether that streak is a 12% drawdown you trade through or a 45% crater you write forum posts about. Which means the most useful thing you can do after reading this isn't bookmarking a benchmark table. It's opening your platform, looking at your actual risk per trade, running it against a nine-loss streak, and asking whether you could sit through the number that comes out.
If the answer is yes, carry on, and set the tripwire anyway. If the answer is no, you already know what to change, and you now know why. Nobody gets to skip the drawdown. You only get to choose, in advance, how deep yours is allowed to go.