There is a specific kind of account death we see over and over, and it almost always belongs to a trader who learned risk management on EUR/USD and then brought those habits to gold. The rules they learned were fine. Sensible, even. Risk 1-2%, put the stop behind the last swing, trail it as price moves. On a currency pair that ranges 60 pips a day, that framework holds up. On XAU/USD it gets you carried out.
Most of what passes for xauusd risk management online is a generic forex risk article with the word "gold" pasted in, written by someone who has clearly never sat through a Non-Farm Payrolls print with a full position on the metal. Gold is not a big forex pair. It's a different animal wearing a similar chart, and this piece is written accordingly. Our desk trades one instrument, gold, all day, every day, and every closed signal we've ever issued sits in public view with its result attached. What follows is the risk framework behind those numbers. Not theory. The actual rulebook.
Fair warning before we start: nothing here makes gold safe. Trading leveraged gold is high risk, losing trades are a permanent feature of doing it, and anyone who tells you otherwise is selling something. What good risk management does is make the losses survivable and boring. That's the whole job.
Why XAUUSD risk management starts where forex rules break
Start with the raw numbers, because they explain almost everything else. A quiet day on EUR/USD might cover 50-70 pips. A quiet day on gold, in the current regime, covers $20-$30, which in gold-pip terms is 200-300 pips. A loud day covers $60 or more. This year gold has run from the low 2,600s to above 4,200, and along the way it has produced single sessions with $80 ranges. That is not an occasional tail event any more. It's a Tuesday.
Now think about what that does to imported forex habits.
The trader who "always uses a 30-pip stop" because that worked on cable is now placing a $3 stop on an instrument that wobbles $5 while deciding what to do next. Their stop isn't a risk decision. It's a donation. The trader who sizes every position at 0.50 lots regardless of instrument has just discovered that 0.50 lots of gold moves $50 in P&L for every dollar of price movement, and gold moves a dollar in the time it takes to make coffee.
And it's not just the size of the moves. It's their shape. Gold trends harder than the majors and mean-reverts more violently inside those trends. It gaps at the Sunday open more often and more widely than any major pair. It has a nasty habit of sweeping an obvious level by $2-$4, hoovering up every stop parked there, and then reversing to do what the chart suggested all along. If you've traded gold for more than a month you have watched this happen. Probably to you.
So the first principle of gold trading risk management is humility about transfer. Whatever worked for you on currencies is a starting point for negotiation, not a rulebook. Gold sets its own terms. Your job is to read them before you size a single position.
None of this makes gold untradeable. Volatility is why the opportunity exists; a market that moves $50 a day pays much better per unit of being right than one that moves $6. But it pays that way in both directions, and the direction you have to plan for is the one that hurts.
Know your instrument: contract, pip value, typical range
You'd be amazed how many people trade gold daily and can't tell you what a one-dollar move costs them. So let's nail the mechanics down, because every sizing decision downstream depends on them.
On nearly every retail MT4/MT5 broker, one standard lot of XAU/USD represents 100 ounces of gold. That means a $1.00 move in the gold price is worth $100 per standard lot. Brokers usually quote gold to two decimals, and by convention a "pip" on gold is a $0.10 move, so one pip is worth $10 on a standard lot, $1 on a mini (0.10 lots), and $0.10 on a micro (0.01 lots).
Here's that as a table, because this one is worth pinning above your desk:
| Lot size | Ounces | Value of a $1.00 move | Value of a $10 move | Value of a $50 move |
|---|---|---|---|---|
| 1.00 (standard) | 100 | $100 | $1,000 | $5,000 |
| 0.10 (mini) | 10 | $10 | $100 | $500 |
| 0.01 (micro) | 1 | $1 | $10 | $50 |
Read the right-hand column twice. A $50 adverse move, which gold can produce inside a single New York session, costs a full lot holder five thousand dollars. On a $10,000 account that's half the equity, gone, from one position that probably felt reasonable when it was opened.
Now the ranges. Pull up a daily ATR (Average True Range, 14-period) on gold and look at where it's been living. Through the calmer stretches of recent years it sat around $18-$25. In the current regime it has spent long stretches at $35-$55, with spikes well beyond that around the sharpest legs of this year's rally. Compare that with the same indicator on EUR/USD, where the equivalent figure is a fraction of the dollar risk per lot, and you start to see why lot-size intuition doesn't transfer.
One more mechanical point people miss: spread and slippage scale with the drama. Gold's spread on a decent broker might be $0.20-$0.35 in quiet London hours. Around a red-folder news release it can stretch to $1.00-$3.00 for a few seconds, and stop orders fill at the market's whim, not at your number. Your risk calculations need slack for that, because the market will not extend you any.
Know these numbers cold. Not roughly. Cold. Everything from here builds on them.
ATR-based position sizing for XAUUSD
Fixed lot sizes are how gold accounts die. The instrument's volatility can double inside a fortnight, and a position size that was conservative in September is reckless by October. The fix is old, unglamorous, and works: size every trade off the current ATR and a fixed cash risk.
The procedure takes about ninety seconds:
- Decide your cash risk for the trade. Say your account is $5,000 and you risk 1%: that's $50. Write the dollar figure down, not the percentage.
- Read the 14-day ATR on the daily chart. Say it's $40 today.
- Set your stop distance as a fraction or multiple of ATR appropriate to the trade. For an intraday setup we typically use 0.3-0.5x daily ATR; for a swing trade held across sessions, 0.75-1.5x. Say this is an intraday trade and you choose 0.4x: a $16 stop.
- Divide cash risk by dollar stop distance to get ounces: $50 / $16 = 3.1 ounces, so 0.03 lots.
That's it. That's the whole engine. And notice what it just did: it looked at a $5,000 account, an account most brokers will happily lever 100:1 or more, and concluded that the correct position is three micro lots. Not half a lot. Not "0.10 because that's what I always trade." Three micros.
Most traders' first reaction to that output is that it's too small to be worth bothering with. Sit with that reaction for a second, because it's the exact instinct that fills the loss column. The position feels small because gold's moves are huge, and gold's moves being huge is precisely why the position must be small. A 0.03-lot position catching a $30 favourable move earns $90, which is 1.8% on the account from one trade. That is a perfectly good day at any professional desk on earth.
The beauty of ATR sizing is that it breathes with the market without you having to be clever. When gold goes quiet, ATR contracts, stops tighten, and your lot size drifts up. When gold goes berserk, ATR expands and the formula automatically cuts your size, often by half or more, at exactly the moment your gut is screaming to size up because "the moves are so big right now." The formula is smarter than the gut. Let it win.
Two refinements we use on the desk. First, recalculate weekly at minimum, and always before re-entering after a volatility event; an ATR reading from before an FOMC repricing is a historical artefact, not an input. Second, round lot sizes down, never up. The difference between 0.037 and 0.03 lots is small. The habit of shading risk downward, compounded over five hundred trades, is not.
Stop placement beyond the stop-hunt zones
Now the uncomfortable subject. Gold is the most stop-hunted instrument in retail trading, and it isn't close. The metal attracts enormous speculative flow, that flow clusters its stops at the same obvious places, and the market has a well-documented tendency to visit those places before doing anything else.
Where are the obvious places? You already know, because you've put stops there yourself:
- A dollar or two beyond the most recent swing high or low
- Just past round numbers: 4,200, 4,250, the ones everybody watches
- Just outside the Asian session's high and low
- At the edge of yesterday's range
The pattern repeats endlessly: price approaches the level, punches $2-$5 through it on a spike that lasts minutes, then reverses hard and runs the other way. The traders who were right about direction get taken out at the extreme, and then get to watch the move they called happen without them. If there is a worse feeling in trading, we haven't found it.
Your defence has two parts, and they work together.
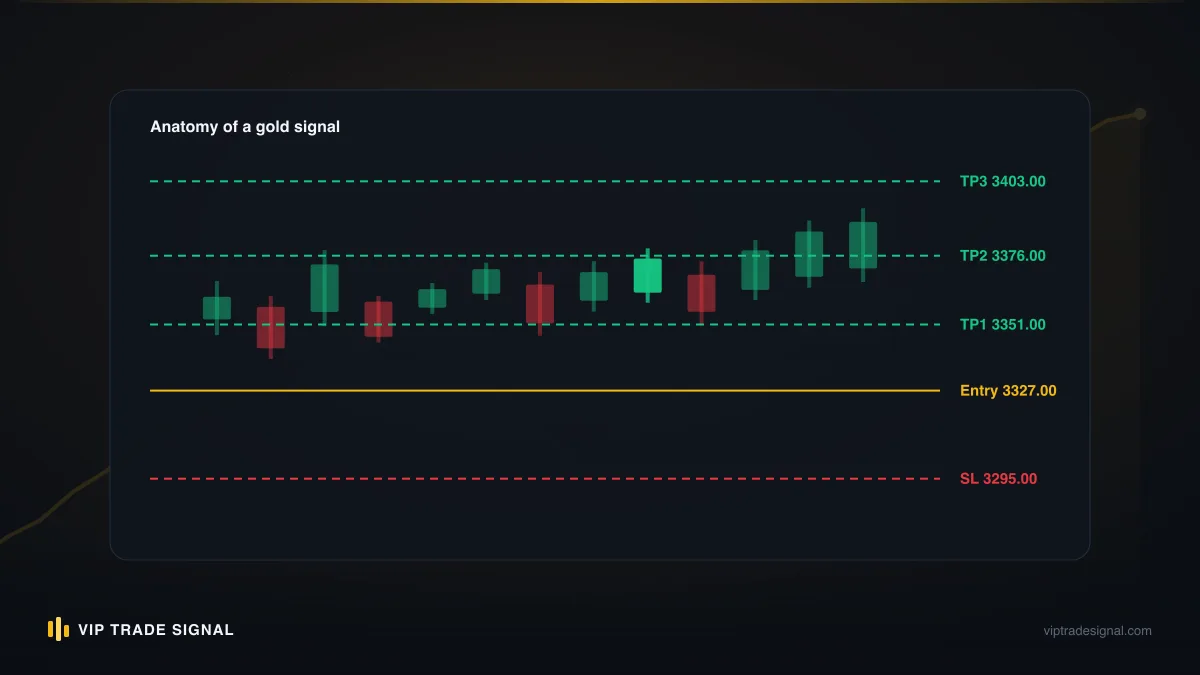
Part one: place stops beyond the hunt zone, not at its edge. If the technical invalidation for your long is the swing low at 4,182, the amateur stop goes at 4,180. The professional stop goes at 4,175 or 4,172, past the round number and the sweep-depth beyond the level, at a distance informed by ATR rather than by hope. A useful habit is to measure the recent sweeps yourself: pull up the last month of daily candles and note how far the spikes travelled beyond obvious levels before reversing. In the current regime that overshoot is routinely $3-$6. Your stop needs to live outside that, or it isn't a stop, it's an appointment.
Part two, and this is the one people resist: the wider stop must come with a smaller position. This is where stop placement and sizing lock together into one decision. If moving your stop from $8 away to $15 away is what the structure genuinely requires, then your size drops by nearly half, courtesy of the same formula from the last section. Traders hate this because it shrinks the win. But the alternative, a tight stop inside the hunt zone, doesn't produce bigger wins. It produces a long, demoralising sequence of small losses on trades whose direction was right, which is somehow worse for the psyche than being plainly wrong.
One thing we never do, and you shouldn't either: trade without a hard stop because "gold always comes back." Every martingale casualty and every blown "recovery" account started with that sentence. Mental stops don't survive contact with a $40 adverse hour. Put the order in the market.
Risk per trade on a violent instrument
The internet's standard answer to "how much should I risk per trade?" is 1-2%, said with great confidence and no reference to the instrument. On gold we think the honest answer is lower, and it's worth spelling out why.
Risk-per-trade rules exist to keep losing streaks survivable. And losing streaks are not rare accidents. Any strategy with a 50% win rate, which is respectable, will produce a streak of seven consecutive losses roughly once every couple of hundred trades, purely by chance. If you trade daily, you'll meet that streak within a year. The question isn't whether it comes. It's what's left of you when it does.
At 2% risk per trade, seven straight losses cost about 13% of the account. Painful, recoverable. But gold adds a complication the textbook doesn't price in: correlated failure and slippage. Gold's losses cluster around events, gaps and cascade moves, where fills degrade and one bad hour can catch two or three positions at once if you've let entries stack up. On this instrument, a "2% loss" has a habit of settling at 2.6% by the time the dust clears. Run a streak of those together with a Sunday gap somewhere in the middle and the textbook maths starts to flatter reality considerably.
So our rulebook is stricter, and we'd suggest yours should be too:
- 0.5-1% per trade as the standard risk unit on XAU/USD. Nudging toward 1% only for A-grade setups in clean conditions.
- 2% maximum total open risk across all gold positions at once. Two open trades means each one runs smaller.
- 3% daily loss limit. Hit it and the platform gets closed. Not "watched cautiously." Closed.
- 6% weekly limit, after which the week is over and the remaining days are for review, not revenge.
The daily limit deserves a word, because it's the one that saves accounts. Nobody makes their worst decisions on the first trade of the day. They make them on the fourth, after three losses, sized double to "get it back." Gold is uniquely dangerous for revenge trading because its volatility makes recovery feel plausible: one good $40 move undoes everything, and the tape dangles that possibility all session long. The daily limit exists to take the decision away from the version of you that appears after three losses. That version is not a trader. He's a gambler wearing your login.
Position sizing on gold isn't about maximising the win. It's about making sure no single hour of any single day can take you out of the game.
We'd add one honest note. Following these numbers means your equity grows slower than the screenshots on Instagram suggest is possible. Correct. Those screenshots are either demo accounts, cherry-picked weeks, or accounts that later died and didn't get a screenshot. Slow is what surviving looks like; you can browse our full signal history, losers included, to see what a survivable pace actually resembles on this instrument.
News protocol: NFP, CPI, FOMC windows
Three scheduled events move gold more than everything else on the calendar combined: US Non-Farm Payrolls, the CPI inflation print, and FOMC rate decisions with their press conferences. Gold is priced in dollars and trades substantially as an interest-rate instrument, so anything that repredicts the Fed reprices gold, instantly and violently. A CPI surprise of a couple of tenths can move the metal $30-$50 inside fifteen minutes. FOMC afternoons regularly produce a full-range move in each direction before choosing one.
You cannot manage risk through these windows in the ordinary way, because the ordinary tools stop working. Spreads widen to several dollars. Liquidity thins, so stops fill wherever the next real bid happens to be, occasionally $5-$10 past your level. The chart prints candles that would count as a full trading day in any other week. Whatever your plan was, the market's plan is louder.
So the desk runs a written protocol, the same one every time, and it's boringly mechanical:
| Window | Rule |
|---|---|
| 30+ minutes before release | Last chance to act deliberately: close, reduce, or accept defined risk |
| 15 minutes before | No new entries. No stop adjustments except tightening. Full stop. |
| Release + first 15 minutes | Hands off entirely. No entries, no "quick scalps" on the spike |
| 15-60 minutes after | Re-entry permitted only if spread has normalised and a real level has formed |
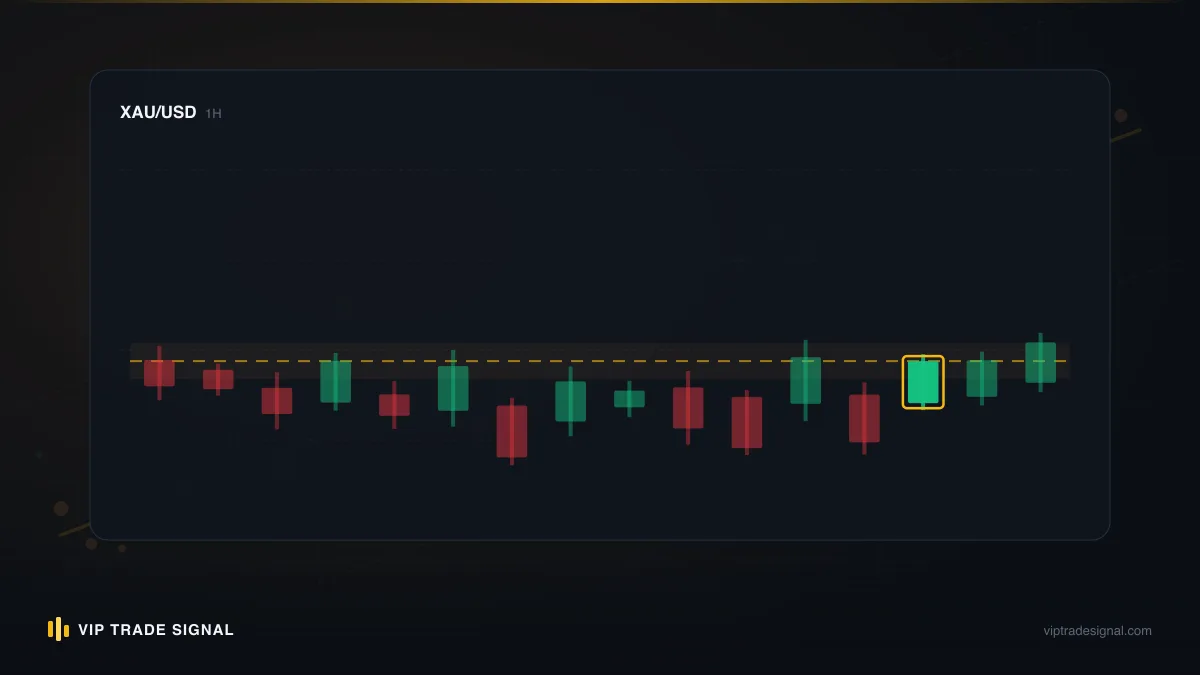
The single most important line is the ban on trading the release itself. The first spike after an NFP print is where retail accounts go to die: the move looks free, the fill is terrible, the reversal is instant, and the spread eats whatever the whipsaw doesn't. Waiting fifteen minutes costs you the worst fills of the month and almost nothing else. The genuine move, when there is one, lasts hours or days. You will not miss it by letting the first candle finish.
Mark the calendar every Sunday. NFP is the first Friday of the month at 8:30am New York time; CPI lands mid-month at the same hour; FOMC days are published a year ahead, decision at 2pm New York, press conference at 2:30. Ten minutes of Sunday admin, and the week's three most dangerous hours are ringed in red before they can ambush you. On our own desk, the live signals simply go quiet through those windows, and subscribers occasionally ask why. This section is why.
Session risk: Asia drift vs London/NY expansion
Gold does not carry the same risk at 3am as it does at 3pm, and a risk framework that ignores the clock is leaving information on the table.
The Asian session, roughly from the Sydney open until London wakes, is gold's quiet stretch. Volume is thinner, ranges compress, and the metal often drifts sideways in a $5-$10 band for hours. It's tempting to read that as "safe," and in one sense it is: adverse moves are smaller. But quiet sessions carry their own traps. The compressed range builds the very highs and lows that London will later sweep for stops, so positions opened on an Asian breakout have a poor habit of being early by exactly one stop-hunt. And thin liquidity means that when Asia does move, on a China headline or a yen event, the move travels further per unit of volume than it should.
London open changes the weather. From about 8am UK time, gold's real daily range starts printing, and the London morning routinely accounts for the first major directional push. Then the New York morning arrives, overlapping with London for a few hours, and that overlap, roughly 1:30pm to 4:30pm UK time, is the most liquid, most volatile window of the day. It's where the biggest moves happen and where the US data calendar lands. Most of gold's daily damage, in both directions, is done there.
What the desk does with this, practically:
- Position sizing is session-aware. A trade opened in Asia against a $12 expected range and a trade opened into the NY overlap against a $35 expected range are not the same trade, even at the same lot size. Use an intraday ATR (14-period on the 1-hour chart works fine) so the sizing formula sees the session, not just the day.
- Asian-range breakouts get treated as suspects, not signals. More often than not, the first break of the overnight range is the sweep, and the real move goes the other way after the stops are collected.
- New swing positions don't get opened in the last hour of New York. Whatever edge the setup has, it doesn't outrun the overnight drift and the gap risk you've just signed up for.
None of this means you can only trade the loud hours. It means the clock is an input. Same chart pattern, different hour, different risk. Treat it that way.
Managing open gold trades through events
Sizing new trades is the easy half of gold trading risk management. The harder half is the position you're already in when the calendar turns hostile: you're long from Tuesday, comfortably in profit, and tomorrow at 8:30am New York time the CPI print lands. What now?
Managing open positions during news events is where most traders improvise, and improvisation under adrenaline is just gambling with extra steps. So here is the decision tree we actually use, in order:
- If the position is at a loss going into the event, close it. All of it. An underwater position plus a binary event is a coin flip for double-or-nothing, and you didn't open the trade to flip coins. Take the small loss while it's still small and re-enter after the dust settles if the setup survives.
- If the position is modestly in profit, take at least half off and move the stop on the remainder to breakeven or better. You bank something whatever happens, and what remains is playing with house money through the spike.
- If the position is deeply in profit, with the stop already trailed well into profit, you can afford to hold through the event. But re-check the stop's placement against event-sized slippage: a stop $6 into profit can fill flat or slightly negative on a violent print. Assume the fill will be worse than the level, then decide if you're still happy.
- Never widen a stop because news is coming. Widening the stop to "give it room through the number" is asking to convert a planned $50 loss into an unplanned $180 one. If the current stop can't survive the event, the position shouldn't either.
Notice the pattern: every branch reduces exposure or defines it harder. There is no branch where you add. Adding to a position just before a binary event, even a winning position, is the same bet as opening a fresh full-size trade into the release, which we've already banned.
The psychology here deserves a sentence. Cutting a healthy position ahead of news feels like cowardice, and holding through the print feels like conviction. That's exactly backwards. Anyone can hold and hope. Ranking your exposure against a known event and trimming it on schedule is the discipline that separates a managed book from a lottery ticket. When we mark signals "reduce ahead of FOMC," a few subscribers always grumble that we cut their winner early. Some of those times, the trade would have run further. And sometimes the print goes the other way, the position they'd have held gaps through where the stop was, and the grumbling stops. You only need to be saved once to understand the arithmetic.
Weekend exposure decisions on metal
Every Friday afternoon, the same question: flat or carry? Gold makes this a sharper question than forex does, for a blunt reason. The metal's weekend gap risk is the worst of any retail instrument this side of crypto.
Gold closes on Friday at 5pm New York and reopens Sunday at 6pm New York. That's 49 hours in which the world keeps happening: geopolitical shocks, weekend elections, surprise announcements from central banks, and lately the sort of tariff and sanctions headlines that gold reacts to before any other market opens to react with it. When something lands in that window, gold doesn't trade its way to the new price. It teleports. Sunday opens $15, $25, sometimes $40 away from Friday's close, and every stop order in the gap fills at the open price, not at its level.
Sit with what that means mechanically. Your stop $10 under Friday's close is not a $10 risk over the weekend. If Sunday opens $35 lower, that stop fills $35 lower, and no broker's platform can do anything else. Gap risk is the one risk a stop-loss cannot cap. In extreme cases it's the mechanism by which retail accounts go below zero; we've written before about whether a forex account can actually go negative, and gold weekends are one of the clearest routes there on brokers without negative balance protection.
So the desk rule is unexciting and firm: intraday and short-swing positions go flat by Friday's New York afternoon, full stop. A swing position may carry the weekend only when all three of these are true: it's substantially in profit, the stop is locked at or beyond breakeven, and the position is small enough that a $40 gap against it costs under 1% of the account. If any leg fails, the position gets cut or trimmed until it passes.
Does going flat cost money sometimes? Of course. Gold has gapped in traders' favour plenty of times, and there's a version of this year where holding every Friday paid handsomely. But risk management isn't scored on the weekends that went well. It's scored on whether the one Sunday that opens $45 against you is an annoyance or an obituary. We'll take the annoyance, every Friday, without much thought. Flat is also a position, and on Friday at 4pm it's usually the best one on offer.
The averaging trap: when risk management gets replaced by hope
Before the summary, one section on the failure mode that produces most of the wrecked gold accounts we're asked to look at. It rarely starts with one bad trade. It starts with one bad response to a bad trade: adding.
The logic always sounds the same. Gold is down $25 from the entry, the trader still believes in the level, and a second position here "improves the average." Then it's down $45 and a third position improves it again. Each addition genuinely does bring the breakeven closer, and that's what makes the trap so effective: the maths flatters you right up until it kills you. Three stacked longs on a falling market is triple exposure to the next $20 drop, and gold serves up $20 drops the way other instruments serve up lunch. We've pulled the mechanics apart properly in our piece on averaging down in forex, and gold is that article's worst case, because the instrument's trends run further than any retail margin can outlast.
The same instinct wears a more sophisticated costume too: grid and zone-recovery systems that formalise the stacking with fixed spacings and doubled sizes. They produce beautiful equity curves for months, a smooth staircase of small wins, and then a single trending fortnight erases the lot. We've written a full breakdown of zone recovery if you want the anatomy; the short version is that on an instrument that can trend $400 in a quarter, any strategy whose plan B is "add until it turns" carries an unpriced catastrophic tail. The wins were real. So is the ending.
Why does this belong in a risk manual? Because everything earlier in this article, the ATR sizing, the total-open-risk cap, the daily loss limit, is functionally a set of walls around this exact instinct. The 2% open-risk ceiling is what makes the third average-down impossible. The daily limit is what sends you home before the martingale brain takes the wheel. If you take nothing else from this piece: on gold, the correct response to a position going wrong is less exposure, not more. Every time. The market does not care how close your breakeven is.
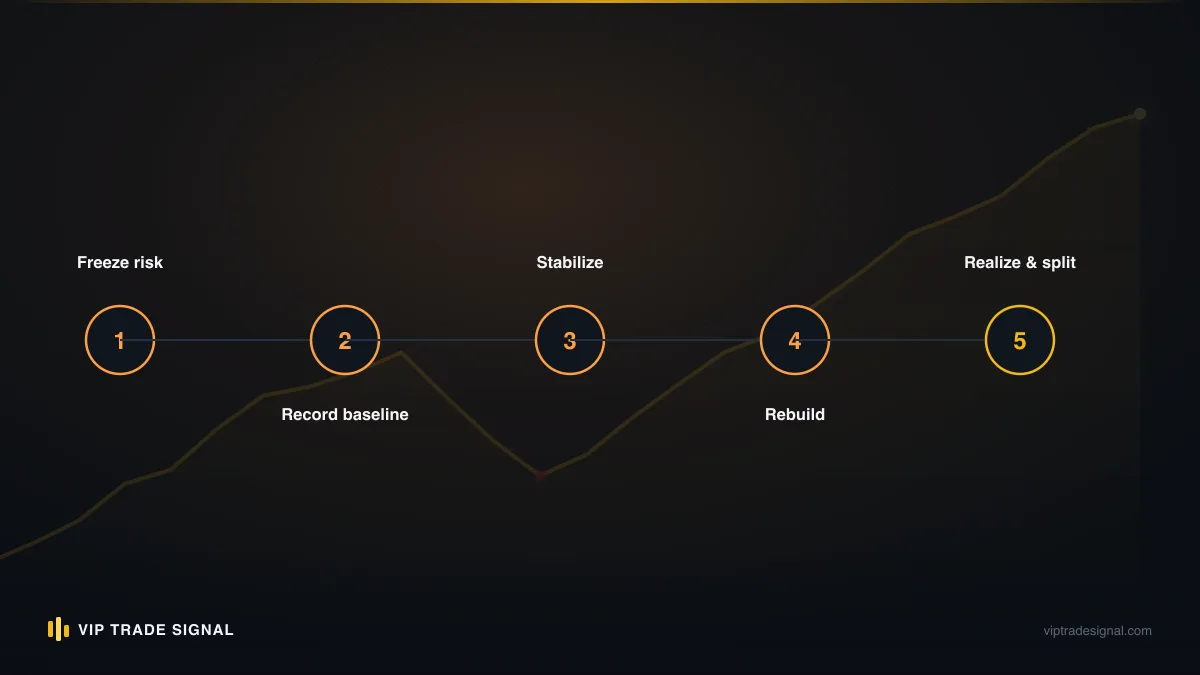
And if you're reading this from inside the hole, already floating a five-figure drawdown on stacked gold positions, understand that the instinct that dug it will not dig you out. That situation needs a plan built around the baseline you're actually at, not the one you wish you were at; structured drawdown management is a saner route than doubling again, though no route, ours included, comes with recovery guarantees. Anyone who does guarantee recovery has told you everything you need to know about them.
Our XAUUSD rulebook, summarized and sourced
Everything above compresses onto one page. This is the checklist version, close to what's pinned by the desk:
- Know the contract. 100 oz per lot, $100 per $1 move per lot. If you can't price a $50 move against your position from memory, you're not ready to open it.
- Size from ATR, not habit. Fixed cash risk divided by an ATR-derived stop distance. Recalculate weekly and after every volatility shift. Round down.
- Risk 0.5-1% per trade, 2% total open, 3% daily stop, 6% weekly stop. The limits are for the version of you that shows up after three losses.
- Stops live beyond the hunt zones. Past the swing, past the round number, past the measured sweep depth. Wider stop means smaller size, never bigger risk.
- Hard stops in the market, always. Mental stops are stories we tell ourselves.
- News protocol is mechanical. No entries from 15 minutes before NFP, CPI or FOMC; hands off through the first 15 minutes after; losing positions closed before the print, winners trimmed.
- Respect the clock. Asia is for patience, the London/NY overlap is where the range prints, and the first break of the overnight range is a suspect until proven otherwise.
- Friday afternoon is a risk decision. Flat unless the carry is profitable, protected, and small enough that a $40 gap is survivable.
- Never add to a loser. Not once, not "just this time," not with a system that renames it. Less exposure when wrong. Always.
- Log everything. Every trade, every rule breach, every slip. The log is where you find out which rule you actually need.
"Sourced" is in the heading for a reason. It's fair to ask whether any of this survives contact with the market, and you don't have to take our word for it: every signal our desk has closed, winner and loser, sits publicly at /signals/history with its entry, stop and result. The losing trades are there because the rulebook doesn't prevent losses. Nothing prevents losses. What it prevents is the one loss that ends the account, and across everything you'll find in that history, that trade doesn't appear. That's the entire claim.
Where this leaves you
Here's the honest summary of the whole manual: gold pays well for being right and charges brutally for being wrong at size, and you control exactly one of those variables. Not direction. Not the CPI print. Size, stop, and exposure. That's the whole toolkit, and it's enough.
So before your next XAU/USD trade, run the ninety-second version. What's the ATR today, in dollars? Where's the stop, and is it past the hunt zone or parked inside it with everyone else's? What does that stop distance make the position size, and did you round down? What's on the calendar in the next 48 hours, and what's the plan for the position when it hits? If you can answer those four questions before the order goes in, you're already managing risk better than most of the accounts that pass through this industry.
And if you'd rather see the framework running live than reconstruct it yourself, that's the service we sell, gold only, every result published. But subscribe or don't; the rulebook above works the same either way. What matters is that some rulebook is in charge before the next $60 day arrives. Because on this instrument, it's already on the calendar. You just don't know the date yet.