Nobody opens a trading account to learn what drawdown means. You learn it the way most of us did: you check MT4 on a Tuesday, the balance says $9,400, and the equity says $6,100, and you sit there trying to work out which of those numbers is real. Both are. That gap is drawdown, and understanding it properly is the difference between an account that survives a rough patch and one that quietly dies over six weeks.
So, what is drawdown in forex? It is the decline in your account from a peak to a subsequent low, usually expressed as a percentage of the peak. That's the glossary answer, and it's technically complete and practically useless. Because the definition doesn't tell you which number to measure it from, doesn't warn you that your platform shows two different versions of your account at all times, and says nothing about the point at which the recovery maths stops being your friend.
We spend a large part of our working week inside accounts that are 30%, 40%, sometimes 50% underwater. People send us their logins when things have gone properly wrong, and the first thing we do, every single time, is measure the drawdown correctly. Not the version the trader tells us. The real one. This article is that measurement process written down, plus everything around it that we wish traders knew before they got to us.
Drawdown in one sentence
Here it is: drawdown is the percentage distance between the highest point your account has ever reached and the lowest point it has fallen to since that high.
Every word in that sentence is load-bearing. "Highest point your account has ever reached" means the peak, not your deposit. If you funded with $5,000, ran it to $8,000, and you're now at $6,000, you are not "up $1,000". You are in a 25% drawdown from your $8,000 peak. Your account doesn't remember your deposit fondly. It only knows the high-water mark, and it measures every bad day from there.
"Lowest point it has fallen to since" matters too. Drawdown is peak-to-trough, not peak-to-now. If your account touched $5,500 last week before bouncing back to $6,000, your maximum drawdown in that episode was 31.25%, even though today's snapshot looks less ugly. The trough counts because the trough is where you almost got margin called, where you almost closed everything in a panic, where the account almost stopped existing. Risk lives at the trough.
And "your account" means equity, not balance. This is the part that catches nearly everyone, so it gets its own section.
One more thing before we move on. Drawdown is not a sign you're doing something wrong. Every trading account on the planet spends most of its life in some level of drawdown, because accounts only sit exactly at their high-water mark for the brief moments between making a new high and giving a little back. The question is never whether you'll have drawdown. It's how deep, how often, and whether you sized your trades knowing it was coming.
Balance vs equity: where drawdown hides
Open your platform right now and look at the bottom of the terminal. You'll see two numbers: balance and equity. If you have no trades open, they match. The moment you have an open position, they split, and the split is where drawdown does its best hiding.
Balance is the sum of your closed trades. It only moves when a position closes. Equity is balance plus the floating profit or loss on everything currently open. Equity is what your account is actually worth this second, the amount you'd have if every position closed at market right now.
Here's why the distinction is dangerous. A trader can hold a losing position for weeks and their balance never moves. It sits there, serene, showing $10,000 while the equity underneath it bleeds to $7,000, then $6,000. The trader tells themselves they haven't lost anything because "it's not a loss until you close it". We've heard that sentence more times than we can count, usually from someone whose equity is about to force the issue for them. The market does not care that you haven't clicked close. Your broker's margin calculation runs on equity, not balance, and when equity falls far enough, the broker closes the trades whether you've accepted the loss or not.
So when someone asks what is drawdown in trading and whether they're in one, the honest check is this: find your equity high-water mark, compare today's equity to it, and ignore the balance entirely. Balance-based drawdown is a comforting fiction for anyone holding open losers. Equity drawdown is the truth.
There's a practical habit worth building here. Once a week, write down your equity. Not your balance. One number, dated, in a notebook or a spreadsheet. It takes ten seconds, and after a couple of months you'll have something almost no retail trader has: an honest equity curve of your own account. Brokers show you trade history; almost none of them shows you a clean equity-over-time chart. The traders who come to us deepest in trouble are, almost without exception, the ones who never tracked equity and genuinely didn't know how bad it had got until the margin warnings started.
A worked example on a $10,000 account
Abstract definitions slide off. Let's run an account through six weeks and watch the drawdown happen, because this exact arc plays out in real accounts constantly. We'll call the trader Dan, he trades gold, and he starts with $10,000.
Week one goes well. Three winning trades, one small loser, and the account closes the week at $10,800. Balance $10,800, equity $10,800, no open positions. His high-water mark is now $10,800. Any future drawdown gets measured from here, not from the $10,000 he deposited.
Week two, Dan shorts gold at 3,340 with 0.50 lots and no stop, because he's "sure" it's topping. Gold goes to 3,365. That's 250 points against him at $0.50 per point per 0.01 lots, so 0.50 lots is $25 a point... call it a floating loss of $1,250. His balance still says $10,800. His equity says $9,550. He is in an 11.6% equity drawdown and his platform's most prominent number is telling him everything is fine.
Week three, gold grinds to 3,395. Floating loss now $2,750. Equity $8,050. Drawdown from the $10,800 peak: 25.5%. Dan does what traders in this position almost always do, which is add another 0.50 lots short at 3,395 to "average in". Now every further point costs him $50.
Week four, gold spikes to 3,430 on a data release. The first short is 450 points offside ($2,250), the second is 350 points offside ($1,750). Total floating loss $4,000. Equity: $6,800. Drawdown: 37%. His balance, for the record, still reads $10,800, and if you asked Dan how his trading was going, there's a decent chance he'd say "flat on the year".
Now the arithmetic that matters. For Dan to get back to his high-water mark from $6,800, he needs to make $4,000 on $6,800 of equity. That's a 58.8% gain. He lost 37% and must gain 58.8% just to be where he was. The percentages are not symmetric, and the asymmetry gets crueller the deeper you go. This is the single most important fact about drawdown and we'll give it its own numbers shortly.
Notice what created the damage here. Not the losing streak in the classical sense. Dan only had one bad idea. It was position size, the missing stop, and the decision to add to a loser, compounded by a balance line that kept whispering that nothing had happened yet. Drawdown is rarely one catastrophe. It's usually one mistake given room to grow.
The types of drawdown: absolute, relative and maximum
Platforms and reports throw around several kinds of drawdown, and they measure genuinely different things. If you've ever run a strategy report in MetaTrader or read a Myfxbook page, you've seen all three. Here's the map of the main types of drawdown in trading, with what each one is actually good for.
Absolute drawdown measures how far your account has fallen below its initial deposit, at the worst point. If you deposit $10,000 and the lowest your equity ever goes is $9,200, your absolute drawdown is $800, full stop, even if the account later runs to $15,000 and pulls back to $12,000. The absolute drawdown meaning is simply "how much of my original money was ever at risk of being gone". It answers one question: did this account ever eat into the deposit? Useful for judging how rough the early period of a strategy was. Nearly useless for judging ongoing risk, because once the account is above the deposit, absolute drawdown stops moving no matter how wild things get.
Relative drawdown (sometimes shown as maximal drawdown percentage) is the largest peak-to-trough fall expressed as a percentage of the peak. This is the one that matches how we defined drawdown above and the one professionals mean by default. A 40% relative drawdown means that at the worst moment, the account was worth 60% of its best moment.
Maximum drawdown is the deepest single peak-to-trough decline over the whole life of the account or strategy, in money or percentage. It's the record scar. Two strategies can have identical returns while one carries a 12% max drawdown and the other a 55% one, and they are not remotely the same strategy. The second one nearly died once, and things that nearly die once tend to get another opportunity.
| Type | Measured from | What it tells you | What it hides |
|---|---|---|---|
| Absolute | Initial deposit | Whether your original money was ever touched | Everything after the account grows past the deposit |
| Relative | Any equity peak | How severe declines are proportionally | When it happened and how long it lasted |
| Maximum | The worst peak-to-trough ever | The strategy's closest brush with death | Whether it was one event or a pattern |
There's a fourth dimension none of these capture: drawdown duration. How long did the account spend below its high-water mark? A strategy that dips 15% and recovers in two weeks is a different animal from one that dips 15% and takes eleven months to claw back. The second one tests something the numbers can't measure, which is you. Most traders don't abandon strategies at the bottom of a deep drawdown. They abandon them in month four of a shallow one that won't end.
How to calculate drawdown percentage, step by step
The formula is short. Getting the inputs right is where people go wrong, so let's do both.
The calculation itself:
Drawdown % = (Peak equity − Trough equity) ÷ Peak equity × 100
And the honest procedure for your own account:
- Find your true peak. Go through your account history and find the highest equity value the account has ever reached. If you've only got balance history, use the highest balance at a moment when no trades were open, because at that instant balance and equity were equal. This is your high-water mark.
- Find your trough. Identify the lowest equity since that peak. If you're currently in the drawdown, and your open positions are underwater, today's equity (or this week's low) is your working trough. Include floating losses. Always include floating losses.
- Subtract and divide. Peak minus trough, divided by peak, times 100.
- Write it down with the dates. Drawdown without dates is half a statistic. "22%, from 14 March to 2 May, recovered by 20 June" tells you depth and duration.
Worked numbers, because this is exactly where a how to calculate drawdown percentage search should end with you actually doing it. Peak equity $12,400. Current equity $9,300, including a floating loss of $1,100 on open trades. Drawdown = (12,400 − 9,300) ÷ 12,400 × 100 = 25%. If you'd used balance instead ($10,400), you'd have calculated 16.1% and felt considerably better than you should.
Now the companion calculation, the one that makes drawdown percentages mean something. The gain required to recover from a drawdown is:
Required gain % = Drawdown % ÷ (100 − Drawdown %) × 100
Run a few values through it and watch the curve bend:
| Drawdown | Gain needed to recover |
|---|---|
| 5% | 5.3% |
| 10% | 11.1% |
| 20% | 25% |
| 30% | 42.9% |
| 40% | 66.7% |
| 50% | 100% |
| 60% | 150% |
| 75% | 300% |
Look at the shape of that table rather than any single row. From 5% to 20%, recovery costs roughly what the drawdown took, plus a bit. From 30% onward, the required gain starts running away from the loss that caused it. At 50% you need to double the account. At 75% you need to quadruple it, using strategies and psychology that just proved capable of losing three quarters of your money. This is why we say drawdown depth decides survival. Not because the money is gone, but because past a certain depth, the maths of getting it back demands a level of performance the account has never once demonstrated.
Floating drawdown: the silent version
Of all the shapes drawdown takes, floating drawdown is the one that does the most damage, and it's the one your statement is designed to hide.
Floating drawdown is drawdown carried entirely in open positions. Closed-trade history looks fine. Balance looks fine. Some floating-drawdown accounts even show a rising balance, because the trader keeps taking small winners while the big open losers sit and fester. We've opened accounts where the trade history showed forty consecutive closed wins and the equity was down 45%. Forty wins. The trader was banking $30 scalps while two unhedged gold longs from months earlier sat $4,800 underwater.
Why does it happen? Because closing a loser converts a possibility into a fact, and human beings will pay almost any price to avoid that conversion. Holding the position keeps the story alive: it might come back, gold always comes back, I'll close it at breakeven. Meanwhile the position consumes margin, caps how much size you can deploy on new ideas, and hangs over every session like weather. And on gold specifically the "it always comes back" story is more dangerous than on any major pair, because gold trends hard and can walk away from your entry by 200 dollars without a meaningful pullback. We've written before about why gold blows accounts at a rate the majors can't match, and floating drawdown is the mechanism in most of those stories.
The insidious part is that floating drawdown compounds behavioural errors. A trader carrying a $3,000 floating loss doesn't evaluate new trades on their merits. Every new trade becomes part of the rescue plan. They take revenge setups, they oversize "to make it back faster", they close winners early because the account needs any green it can get. The open loser doesn't just cost its own points. It degrades every decision made in its shadow.
The fix is unglamorous: a hard rule that floating loss is loss. Count it in your drawdown number every single day. If your rule is that 20% drawdown means you stop and reassess, that rule fires on equity, floating losses included, not on whatever the balance line claims. Traders who adopt this one habit stop developing catastrophic drawdowns almost entirely, because the problem gets counted while it's still small enough to close.
What counts as normal, and what counts as dangerous
Every trader wants a single threshold, a number below which drawdown is fine and above which it's a crisis. There isn't one, but there are honest ranges, and we'll commit to them because vague answers help nobody.
Under 10%. Normal life. Any strategy that takes real positions in real markets will visit this range routinely. If a 7% drawdown makes you feel sick, the problem is position size or expectations, not the strategy. Reduce risk per trade until 7% feels like weather.
10-20%. Uncomfortable but recoverable, and for aggressive strategies, still within design. This is the range where your process gets tested for the first time: are you following the rules that got you here, or improvising? A 15% drawdown traded with discipline is a bruise. A 15% drawdown that triggers doubled position sizes is the first chapter of a much worse story.
20-30%. The amber zone. Recovery now requires 25-43% gains, and you should be asking hard questions: is this depth within what my strategy's history suggested, or is something broken? Position sizes should already be smaller here, not larger. This is also, in our experience, the last range where traders reliably still make sane decisions. We wrote a whole piece on when to stop trading after losses, and its core argument is that the stop needs to happen in this band, while the account and the judgement are both still functional.
30-50%. Genuinely dangerous. Required recovery gains run from 43% to 100%. Almost no retail trader has ever produced a verified 100% return in a controlled way, and the ones attempting it from the bottom of a hole are doing it angry, undercapitalised and oversized. Accounts in this band don't usually die of the original drawdown. They die of the recovery attempt.
Beyond 50%. The account as originally conceived is over. That's a blunt thing to say, but the maths says it first: you need to double, then keep going, with a method that just failed. Survivable? Occasionally. As a plan? No.
One asterisk on all of this. The ranges assume the drawdown came from a strategy behaving within its known character. A 12% drawdown from a system whose historical maximum was 8% is more alarming than an 18% drawdown from one that has visited 20% twice before and recovered. Depth matters, but depth relative to what the approach has done before matters more. This is also why any signal service or strategy worth following publishes its full history, losers included; you cannot judge whether a drawdown is normal for an approach whose past drawdowns are hidden. It's the reason our own closed signals, wins and losses alike, sit publicly at /signals/history. Not virtue. Necessity. Without the losing periods on display, "normal drawdown" is unknowable.
How brokers and prop firms measure it differently
Here's a detail that costs traders real money: the drawdown number you care about and the drawdown number your counterparty cares about are often calculated differently, and their calculation is the one with teeth.
Your broker doesn't think in drawdown percentages at all. It thinks in margin level, which is equity divided by used margin, times 100. When that ratio falls to the broker's stop-out level, commonly somewhere between 20% and 50% depending on the broker, positions start getting force-closed, biggest loser first at most brokers. Two accounts in identical 35% equity drawdowns can be in totally different danger: the one running 0.10 lots has a margin level in the thousands of percent and can sit there for months; the one running 2.0 lots might be a $15 gold move from stop-out. Drawdown measures damage. Margin level measures how close the broker is to ending the discussion.
Prop firms are stricter and more inventive. A typical funded-account ruleset includes a maximum overall drawdown (often 10-12%, breach it once and the account is terminated) and a daily drawdown (often 5%, measured within a single day). And the fine print varies wildly on three questions you must answer before trading a single lot:
- Balance-based or equity-based? Equity-based daily drawdown counts your floating losses in real time. A trade that goes 5% underwater intraday and then recovers to close green still breached the rule at an equity-based firm. Same trade, balance-based firm: no breach.
- Static or trailing? A static drawdown is measured from your starting balance. A trailing drawdown follows your equity peak upward, so making money raises your termination line. Trailing rules are dramatically harsher and routinely surprise traders who thought a profit cushion made them safe.
- Measured from balance start-of-day, or equity high of day? Firms differ, and the difference decides whether a volatile winning day can kill an account.
None of this makes prop firm rules wrong. A 10% hard limit is a stricter risk discipline than most retail traders will ever impose on themselves. But it changes the game: on a prop account, drawdown isn't a statistic you review monthly. It's a tripwire you position-size around on every trade. On your own account, a 15% drawdown is a bad quarter. On a funded account, it's a terminated contract at 10%, with the 5% daily rule usually catching people first.
Drawdown vs a losing streak vs a blown account
These three get used interchangeably in Telegram chats, and they're different things with different remedies. Worth separating carefully.
A losing streak is a sequence of consecutive losing trades. It's a statement about outcomes, not about money. Five losses in a row at 1% risk each is a streak and roughly a 5% drawdown: annoying, statistically routine, and survivable on autopilot. Five losses in a row at 10% risk each is the same streak and a 41% drawdown. The streak is identical; the sizing decided whether it was noise or a crisis. And streaks are far more common than intuition suggests. A strategy that wins 55% of the time will still throw a streak of six or seven losses somewhere inside a couple of hundred trades, not as bad luck but as scheduled behaviour. If your position sizing can't absorb the streak your win rate makes inevitable, the drawdown that follows was pre-booked the day you chose your lot size.
A drawdown is the equity consequence, peak to trough, however produced. You can be in drawdown without any streak at all: one oversized loser, or a floating position, will do it alone. And you can weather a long streak with barely visible drawdown if the sizing is right. Drawdown is the number that matters because it's the one the recovery maths runs on.
A blown account is a drawdown that reached the point of no return: stop-out, or a balance so small relative to the trader's ambitions that they withdraw the remnant or torch it on one last oversized attempt. Blown accounts are almost never single events, whatever the trader's story says. Pull the history apart, and there's nearly always a survivable drawdown in the middle that got turned terminal by the response to it: doubling size, removing stops, averaging into the hole. We took apart the anatomy of this in why traders blow accounts, and the pattern holds with depressing consistency. The market starts the drawdown. The trader finishes the account.
Drawdown is what the market does to you. A blown account is what you do to the drawdown.
The practical use of these distinctions: diagnose before treating. A losing streak within normal sizing needs patience and nothing else. A drawdown beyond your strategy's known character needs reduced size and a review. A near-blown account needs a full stop. Applying the streak remedy (keep going, it'll turn) to a broken-strategy drawdown is how 25% becomes 60%.
The two dials that decide your drawdown before you trade
Traders talk about drawdown as if it happens to them. Mostly, it's chosen in advance, by two settings you control completely before any trade is placed.
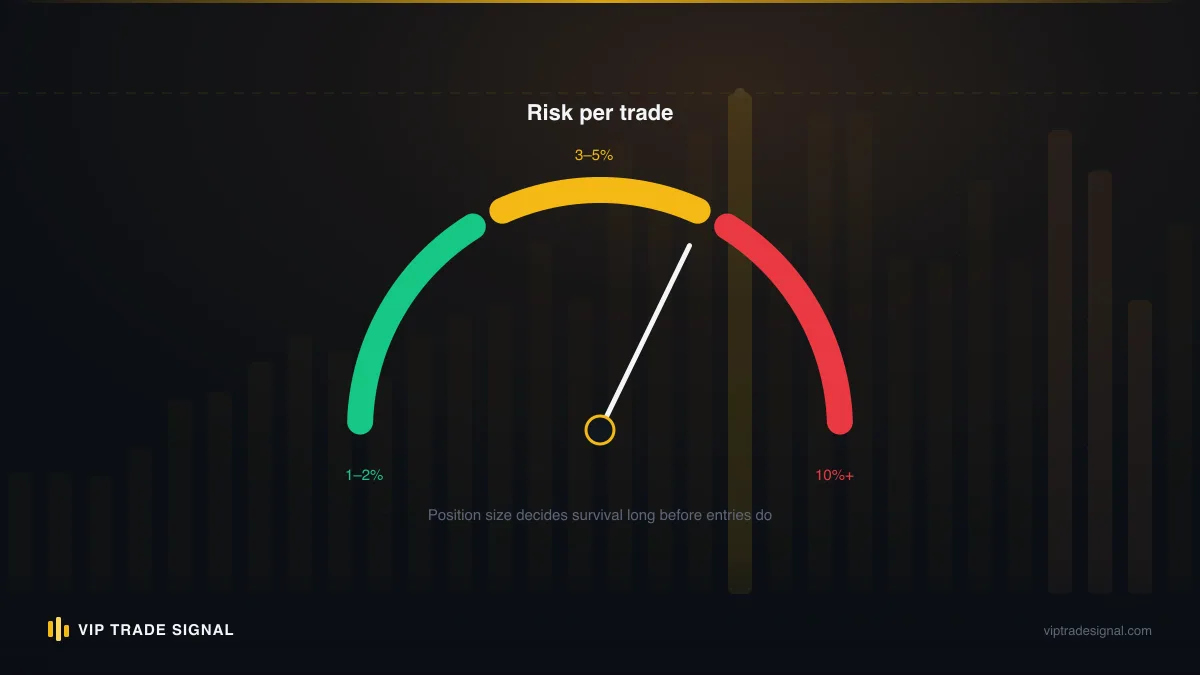
Dial one: risk per trade. The maximum drawdown a run of losses can inflict is close to arithmetic. Risk 1% per trade and an ugly streak of eight losers costs you roughly 7.7% (the losses compound slightly in your favour, as each 1% is taken from a smaller base). Risk 3%, the same eight-trade streak costs about 21.6%. Risk 5% and you're down a third. Nobody who risks 0.5-1% per trade and honours their stops shows up in our inbox 40% underwater. Ever. The catastrophic cases are always built from 5%-plus risk per trade, usually unmeasured, discovered afterwards by dividing the loss by the account.
Dial two: correlation. Three open trades all long gold are not three positions. They're one position, three times the size, and they draw down together. On a gold-only book this is the classic trap: a buy from 3,350, another from 3,330 ("better price"), another from 3,310 ("great price"), and a $60 drop later the account has taken one loss at triple size. Count your risk per direction, not per ticket.
Set those two dials deliberately and you have, in effect, chosen your maximum plausible drawdown ahead of time. Leave them unset and the market chooses for you, and the market is not a careful chooser. This, incidentally, is the real answer to what is drawdown in forex for anyone still building their approach: it isn't a hazard that strikes. It's the output of your sizing decisions, delivered on a delay.
If you are in deep drawdown right now
Some readers didn't come here for definitions. Your account is down 30% or more, possibly with big floating losses attached, and you want to know what to actually do. We work in this exact territory, so here is the sequence we'd apply to our own money, in order.
First, measure it honestly. Equity, not balance. Peak, trough, today, floating losses included, dates attached. Write the real percentage down. This sounds trivial; it isn't. About half the traders who contact us report a drawdown ten or more points smaller than their true equity figure, not because they're lying to us but because they've been reading the balance line for months. You cannot plan a route out of a hole whose depth you refuse to measure.
Second, stop the drawdown from growing. Not "trade your way out". Stop first. Cut position sizes to a fraction of what dug the hole, or flatten entirely for a week. Every one of the ugly failure stories we see contains a stretch where the trader knew the account was wounded and traded bigger anyway. The recovery maths from 30% is hard; from 45% it's brutal; every additional 5% of depth raises the required gain disproportionately, as the table earlier showed. Depth control is the whole game at this stage.
Third, triage floating positions with a written rule, not a feeling. For each open loser, one question: knowing everything you know today, would you open this position at this price? If no, it's only open because closing hurts, and it should go, if necessary in scheduled portions over days to make the decision executable. "It might come back" is not analysis. It's anaesthetic.
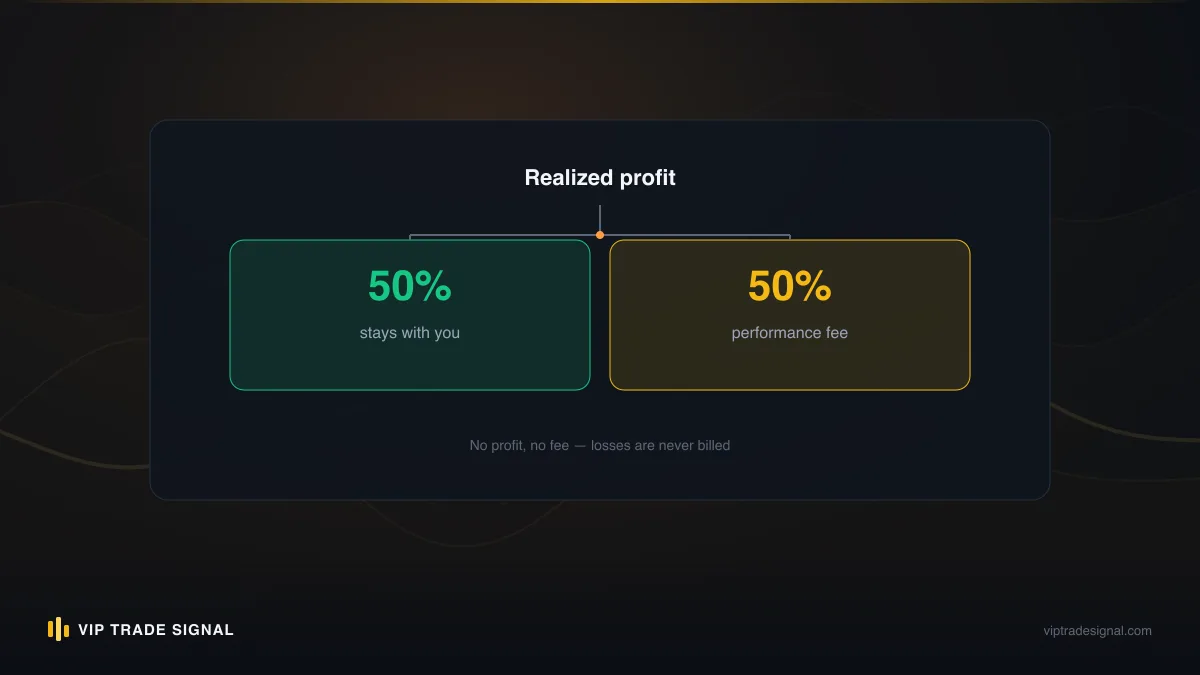
Fourth, decide who's driving the recovery, and be sceptical of any answer including ours. Some traders rebuild alone with smaller size and a stricter process, and for disciplined people with a working strategy that's the right call. Some hand the account to a recovery service, and here you should be careful, because this corner of the industry is full of "guaranteed recovery" merchants whose actual plan is to double martingale positions until your account either recovers or, far more often, finishes dying. Any recovery pitch containing the word guarantee is disqualified on the spot. For what it's worth, our own drawdown management service takes accounts floating roughly $5k-$10k down, charges a flat 50% of recovered profit above a baseline we record together at the start, and we tell every client in the first conversation that no recovery is guaranteed and some accounts are past saving. Half of recovered profit is a serious fee. It's also zero when we recover nothing, which is exactly the alignment you should demand from anyone touching a wounded account; there's a fuller breakdown of how the baseline and billing work on our FAQ. If a cheaper service with upfront fees and a guarantee sounds better, re-read this paragraph in a month.
Fifth, do the post-mortem before the rebuild. A drawdown is expensive tuition; skipping the lesson means paying it again. What single decision created most of the depth? Almost always it's one of four: no stop, oversizing, averaging into a loser, or trading through a period you should have sat out. Name yours specifically, write the rule that would have prevented it, and make that rule the non-negotiable core of whatever you trade next.
Where this leaves you
Strip everything above down to what fits on an index card and it's this. Drawdown is peak-to-trough decline in equity, floating losses included, and the balance line is not your friend while positions are open. The recovery maths is asymmetric and gets vicious past 30%, which is why depth control beats recovery skill every time the two compete. The main types of drawdown in trading measure different things: absolute from your deposit, relative and maximum from the peak, and duration is the one nobody prints but everybody feels. Your counterparties measure it differently and their versions carry consequences, so know your broker's stop-out and your prop firm's exact rule before you size anything. And the depth of your next drawdown was mostly decided the moment you chose your risk per trade, which means it is still, right now, up to you.
Tonight, do the ten-minute version: pull up your account, find your equity high-water mark, calculate your current true drawdown with floating losses in, and write down the answer with today's date. If the number is under 10%, carry on and start logging equity weekly. If it's 20% or more and the honest figure surprised you, that surprise is the most useful information you'll get this month, and what you do in the next two weeks will matter more than anything you've done in the last six. Accounts don't usually die at the bottom of a drawdown. They die from what the trader does there.