The first signal lands in your inbox and you freeze. Entry, stop, two targets, all neatly laid out. The one thing the signal cannot tell you is the only thing that will decide whether you're still trading in six months: how much to risk per trade. Not the direction. Not the entry. The size.
Ask around and you'll get the same answer everywhere, delivered with the confidence of scripture: risk 1% per trade. It's on every forum, in every beginner course, tattooed across YouTube thumbnails. And like most things repeated that often, almost nobody can tell you where it came from, what it assumes, or whether those assumptions have anything to do with your account, your nerves, or the signals you're actually following.
We think that's a problem worth fixing properly. So this piece does something most risk articles don't bother with: it shows you the maths underneath the folklore, walks through what losing streaks actually do to accounts at different risk levels, and then hands you a method for deriving your own number from the one input that matters most, which is how much drawdown you can genuinely stomach before you do something stupid. By the end you'll have a figure you chose for reasons you understand. That's worth more than any rule.
The 1% rule: where it came from and what it assumes
The 1% risk rule forex traders recite today mostly descends from futures traders and trend followers of the 1970s and 80s. Those traders ran systems with win rates around 35 to 40%, long strings of small losses punctuated by occasional huge winners, and they needed a risk fraction small enough to survive brutal streaks while waiting for the trades that paid for everything. Somewhere between half a percent and 2% per trade did the job, 1% sat comfortably in the middle, and a rule of thumb was born.
Notice what that history smuggles in. The rule was built for people trading their own systems, with full control over entries and exits, across dozens of markets, expecting to lose most of the time. It says nothing about a retail trader in 2026 following gold signals on a phone, taking every trade someone else selects, on one instrument, with a completely different distribution of outcomes.
That doesn't make 1% wrong. It's a perfectly sane default, and if you take nothing else from this article, risking 1% will keep you out of the emergency ward. But a default is not a derivation. Two traders with identical accounts can have wildly different correct answers. One is 26, single, treating a $2,000 account as tuition. The other is 54, topping up a pension shortfall, and will feel every red day in his chest. Telling both of them "1%" is not risk management. It's a slogan.
The 1% rule isn't wisdom. It's a default that survived because it's easy to remember, not because it fits your account.
There's also a quieter assumption buried in the rule: that you'll actually follow it. In our experience, the traders who blow up rarely blow up at their stated risk level. They blow up on the revenge trade after the third loss, the one where 1% quietly became 5% because "this setup was too good". Any risk number you pick has to be one you can hold onto at your angriest, not just on the calm Sunday evening when you set it.
Survival math: the risk of ruin nobody shows you
Here is the concept the slogans skip. Risk of ruin is the probability that a given strategy, traded at a given risk fraction, eventually draws your account down to a level you'd consider game over before the edge has time to pay you. It depends on three things: your win rate, your average win relative to your average loss, and the fraction you risk per trade. The first two belong to the signal provider. The third belongs entirely to you, and it's the one with the most violent effect.
The mathematics is unforgiving in a very specific way: risk of ruin doesn't rise in a straight line as you increase risk per trade. It explodes. A strategy that's nearly unkillable at 0.5% per trade can be merely uncomfortable at 1%, genuinely dangerous at 3%, and close to a guaranteed funeral at 10%. Same signals. Same win rate. Same trader, even. The only thing that changed is the fraction, and the fraction did all the damage.
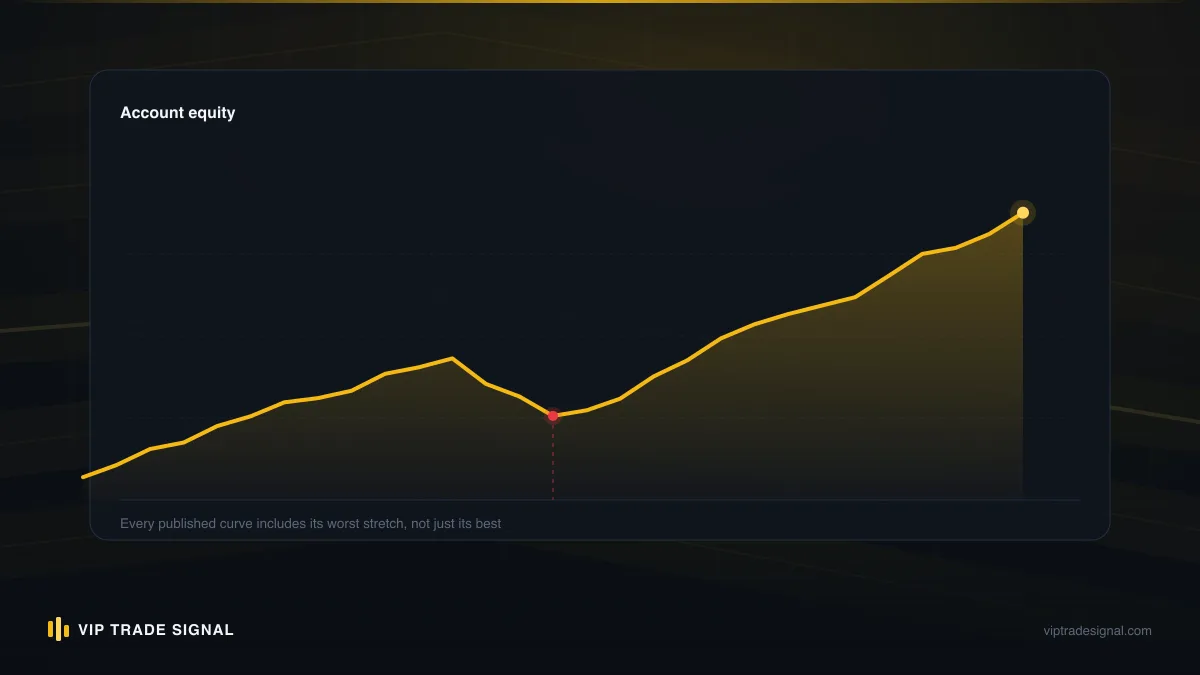
Why does it curve like that? Because losses compound geometrically. Lose 1% eight times and you're down about 7.7%, which needs roughly an 8.4% gain to recover. Lose 5% eight times and you're down about 33.7%, which needs a 51% gain to get back to even. The hole deepens faster than the arithmetic suggests, and the climb out steepens faster than the hole deepens. That asymmetry, small losses cheap to recover and large losses cruelly expensive, is the entire intellectual case for fixed fractional risk at small percentages. Everything else is commentary.
One more thing the survival math makes plain: a positive edge does not protect you from ruin at high risk. This surprises people. A signal service can have a genuinely profitable strategy, verifiable over hundreds of trades, and a follower risking 8% per trade can still wipe out following it faithfully, because a perfectly ordinary losing run arrives before the edge has enough trades to express itself. The edge is real. The follower is still broke. Trading gold or forex on leverage is high risk at any setting, but at high fractions it stops being trading and becomes a countdown.
We publish every closed signal, wins and losses together, at /signals/history precisely because the loss distribution is the raw material for this maths. A track record that hides losses isn't just dishonest. It's useless for sizing.
Why signal followers need a lower number than independent traders
Here's an opinion you won't find in the generic risk articles: if you follow someone else's signals, your correct risk per trade is usually lower than an independent trader's, not the same. Four reasons.
First, you don't control the distribution. An independent trader can stand aside during conditions they distrust, skip the news spike, halve size when the chart looks like a toddler drew it. A signal follower has, by definition, outsourced trade selection. You take what arrives. That means you can't smooth your own losing streaks by discretion, so your sizing has to absorb the provider's worst historical run at full frequency, not the sanitised version you'd have traded yourself.
Second, your results will not match the provider's. Entry slippage, delayed fills, missed signals while you slept, a spread that's two points wider at your broker: these compound into a real gap between the published track record and your account, and the gap almost always points downward. We wrote a whole piece on why your results differ from the signal provider's, and the honest summary is that you should size as if your version of the strategy is somewhat worse than the published one. Because it will be.
Third, you're newer to the strategy than its designer. When the inevitable six-loss week arrives, the provider has context: they've seen this regime before, they know the strategy's character. You have a red screen and a subscription receipt. Doubt arrives faster when the process isn't yours, and doubt at high risk becomes abandonment, usually at the exact bottom of the drawdown. Sizing lower isn't cowardice. It's buying yourself the emotional headroom to still be following the plan on trade forty.
And fourth, frequency. An unlimited signal service, ours included, can fire several trades a day when gold is moving. An independent swing trader might take three a week. Risk per trade multiplied by trade frequency is your real exposure rate, and followers of active services are running a much higher trade count than the folklore ever assumed. More on that below, because it changes the arithmetic more than any other single factor.
Put those together and our honest guidance, which you'll notice cuts against a signal service's commercial interest in you trading big, is this: whatever number you'd defend as an independent trader, knock a third to a half off it as a follower. If your instinct says 1%, run 0.5% to 0.75% for the first couple of months and let your own live results argue you upward.
How much to risk per trade: derive it from drawdown, not folklore
Now the constructive part. The right way to answer how much to risk per trade is to work backwards from the worst drawdown you can tolerate, because drawdown is where accounts and nerves actually break. Nobody quits because their per-trade risk was wrong in the abstract. They quit, or worse, they double up, when the account is 30% down and every glance at the balance hurts.
The derivation takes three inputs.
Input one: your maximum tolerable drawdown. Not the number that sounds brave. The number at which you know, honestly, that you'd either stop following signals or start overriding them. For most people this is far lower than they claim. Traders say 30% and behave like it's 15%. A useful test: multiply your account by the drawdown and look at the cash figure. "I can handle 25% down" feels different when you write it as "I can watch $2,500 of my $10,000 disappear and calmly take the next trade". If the cash version makes you flinch, the percentage was a lie.
Input two: the worst losing streak you should plan for. Not the worst you've seen. The worst that's statistically ordinary. With a strategy winning around half its trades, streaks of seven or eight consecutive losses are not rare events over a few hundred trades. They're expected events. Plan for eight to ten straight losses as routine, and remember that a drawdown is rarely one clean streak anyway; it's usually a choppy sequence of losses interrupted by small wins that recover nothing, which stretches the pain out over weeks.
Input three: a safety factor. Because streaks cluster, because your fills are worse than the track record, because life happens. Double the streak, roughly.
The formula, then: risk per trade ≈ maximum tolerable drawdown ÷ (2 × expected worst streak).
Say your honest maximum drawdown is 15%, and you're following an active gold service where eight straight losses is the sensible planning case. Fifteen divided by sixteen gives you a touch under 1%. If your honest ceiling is 10%, you land near 0.6%. If you're genuinely hardened, an account you can afford to treat roughly, and a 24% drawdown wouldn't change your behaviour, you can defend 1.5%. What almost nobody can defend with this method is 3% or more, because 3% times sixteen is a 48% planning drawdown, and we have never met a retail trader whose behaviour survives 48% intact. Not one.
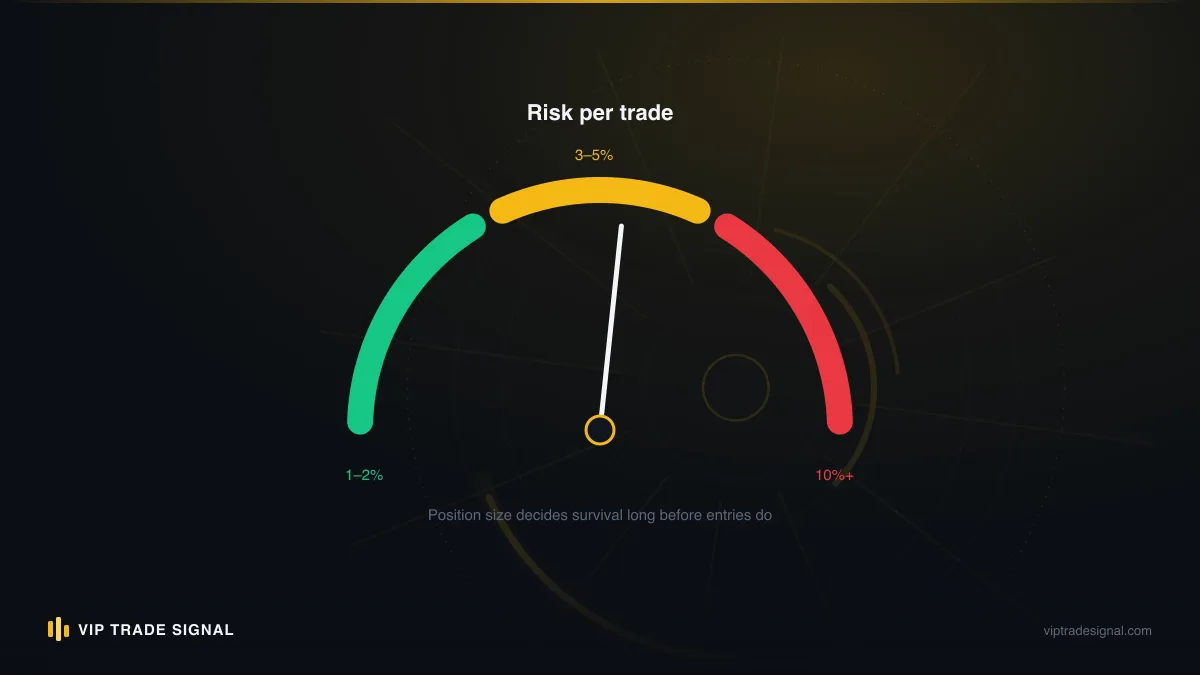
Notice what this method does. It converts an argument about folklore into an argument about you. Two followers of the identical service correctly arrive at different numbers because their drawdown tolerances differ. And it gives you something the 1% rule never could: a reason. When the losing week comes, and it will, "I chose 0.7% because my maths says I survive the ordinary worst case" holds up far better at 2am than "someone on YouTube said 1%".
What eight straight losses actually does at 0.5%, 1% and 2%
Abstractions slide off. Tables stick. Here's what a plain eight-loss streak does to an account at the risk levels people actually argue about, assuming each loss is a full stop-out at the stated fraction and compounding is left to do its quiet work.
| Consecutive losses | 0.5% risk | 1% risk | 2% risk | 3% risk |
|---|---|---|---|---|
| 2 | −1.0% | −2.0% | −4.0% | −5.9% |
| 4 | −2.0% | −3.9% | −7.8% | −11.5% |
| 6 | −3.0% | −5.9% | −11.4% | −16.7% |
| 8 | −3.9% | −7.7% | −14.9% | −21.6% |
| 10 | −4.9% | −9.6% | −18.3% | −26.3% |
| Gain needed to recover after 8 | +4.1% | +8.4% | +17.5% | +27.5% |
Sit with that bottom row for a moment. At 0.5%, eight straight losses is an annoying month; the recovery is a few decent trades. At 1%, it stings but the maths stays friendly. At 2%, you now need a 17.5% run just to see your old balance again, which means the strategy has to perform well above its average for a sustained stretch merely to repair damage. At 3%, you're a fifth of your account down from one ordinary bad patch and the recovery target starts to look like a yearly return.
And these figures are the polite version. They assume the streak is clean and isolated. Real drawdowns are messier: eight losses, two small wins, four more losses. On a $2,000 account, the difference between the 0.5% column and the 2% column after a bad fortnight is the difference between being $78 down and $298 down. Same signals. Same fortnight. The sizing did all of that.
There's a psychological cliff hidden in the table too. Somewhere around 15 to 20% down, most people's decision-making audibly changes gear. Trades get skipped out of fear or doubled out of anger, the plan quietly dissolves, and the follower starts trading their emotions with the signals as a loose suggestion. We've written about what losing streaks do to a signal follower's head, and the short version is that your risk fraction is really a dial controlling how quickly a normal streak pushes you into that state. Set it low enough that ordinary variance never gets you there.
Signal frequency and concurrent trades change the arithmetic
Here's the adjustment almost every risk article ignores: per-trade risk means nothing without trade frequency next to it. A trader risking 1% on three trades a week and a follower risking 1% on three trades a day are not running the same risk. They're not even close.
More trades per week means more trades per losing streak window, which means streaks bite faster in calendar time. An eight-loss run at three trades a week takes nearly three weeks to unfold; you get evenings and weekends to breathe. The same run at three trades a day can be done by Wednesday. The drawdown is mathematically identical but psychologically completely different, and psychology, as we keep saying, is where the plan actually dies.
Concurrent trades are the sharper problem. Suppose your service fires a second gold signal while the first is still open, then a third. If each carries 1%, you now have 3% of your account effectively at risk at once, and here's the uncomfortable part for a single-instrument service: those positions are correlated. They're all gold. A sharp adverse move doesn't take one stop out politely and leave the others. It can take all three inside the same hour. Your true per-event risk was never 1%. It was 3% wearing a disguise.
So two practical rules for followers of active services:
- Set a total open-risk cap, not just a per-trade cap. Something like: per-trade risk 0.75%, total open risk never above 2%. When a new signal would breach the cap, you skip it or take it at reduced size. Skipping a signal is allowed. Nowhere is it written that following a service means taking every trade at full size regardless of what's already open.
- Count same-direction positions as one position. Three concurrent gold longs are, for risk purposes, one large gold long. Size the cluster, not the trade.
If you're evaluating a provider, ask them outright how many concurrent signals they typically run and what their worst historical streak looks like; a serious desk answers in numbers, an unserious one answers in adjectives. We keep a list of questions worth asking any signal service before money moves, and the frequency question belongs near the top.
Fixed fractional, fixed dollar, and Kelly-lite
Three sensible ways exist to turn a risk decision into an actual position size. (There's a fourth, martingale, doubling after losses; it's not sensible, and any service or EA built on it is selling you a slow-motion account explosion, so we'll say no more about it.)
Fixed fractional risk is the one we've been assuming: risk a constant percentage of current equity on every trade. Its great virtue is automatic braking. As the account draws down, each risk amount shrinks in dollar terms, which is exactly why the eight-loss figures in the table above are smaller than a naive multiplication suggests. It also compounds on the way up without you touching anything. The cost is that recovery from deep drawdown is slower, because you're climbing out with smaller absolute bets than the ones that dug the hole. We think that trade-off is correct for nearly everyone. Slow recovery is a feature. It's the maths telling you to be humble.
Fixed dollar risk means risking, say, $20 per trade regardless of equity. It's simpler to administer and it makes streak arithmetic literal: eight losses is exactly $160. The flaw is that it brakes in neither direction. In drawdown, $20 becomes a growing percentage of a shrinking account, so your effective risk fraction rises precisely when it should fall. Fixed dollar is defensible on small accounts where broker minimum lot sizes dominate anyway, and as training wheels for someone who finds percentages abstract. Beyond that, fixed fractional is simply better engineering.
Kelly-lite is for the quantitatively inclined. The Kelly criterion computes the growth-optimal risk fraction from win rate and average win/loss ratio, and for realistic signal statistics it spits out alarming numbers, often 5 to 15%. Full Kelly is a mathematical answer to a question no human actually asks, because it optimises growth while tolerating drawdowns north of 50% along the way. The practical use is as a ceiling: compute Kelly from a provider's published record, then take a quarter or less of it. If quarter-Kelly on honest numbers comes out near 1.5% and your drawdown derivation said 0.75%, take the smaller. Always take the smaller.
| Method | Brakes in drawdown? | Compounds gains? | Best for |
|---|---|---|---|
| Fixed fractional | Yes, automatically | Yes | Almost everyone |
| Fixed dollar | No, effective risk rises | No | Tiny accounts, beginners |
| Quarter-Kelly | Yes, if recomputed | Yes | Quants, as a ceiling check |
One practical note that trips people up: fixed fractional position sizing forex calculators are everywhere and free. Use one, or use the formula directly: lots = (equity × risk%) ÷ (stop distance × value per point per lot). Doing it in your head at 11pm is how 0.02 lots becomes 0.2.
Gold's wide stops: same risk percentage, smaller lots
Everything above applies to any instrument. But since our signals are gold only, a word on XAU/USD specifically, because gold punishes sloppy position sizing harder than the major pairs do.
Gold moves. A quiet day covers $15 to $25 of range; a lively one covers $40 or more, and stops on sensible gold signals are wide to match, often $5 to $12 from entry, because a tight stop on gold is just a donation to volatility. Wide stops are not the problem. Wide stops with forex-pair lot habits are the problem.
Run the numbers on a $2,000 account risking 1%, which gives $20 of room. On a standard lot of gold (100 oz), a $1 move is $100. If the signal's stop sits $8 away, your maximum size is $20 ÷ ($8 × $100) = 0.025 lots, which in practice means 0.02 at most brokers. A trader used to trading 0.10 lots on EUR/USD sees 0.02 and feels insulted. Their ego says size up. And this is exactly how people end up risking 4 or 5% per trade on gold while sincerely believing they follow the 1% rule: they kept a familiar lot size and let the risk float, instead of keeping the risk fixed and letting the lot size float.
Say it plainly: the lot size is the output, never the input. On gold, correct sizes will often look embarrassingly small. 0.01 and 0.02 lots are the honest sizes for four-figure accounts on wide-stop signals, and every signal we publish at our gold signals page includes the stop level precisely so this calculation takes thirty seconds. A signal without a stop cannot be sized at all, which is the polite way of saying it isn't a signal, it's a horoscope.
The compensation for small lots is that gold's volatility works both ways: the same wide range that forces small sizes gives sensible targets genuine room to pay. You don't need big lots on an instrument that travels. You need to still be solvent when it travels the wrong way first.
The drawdown throttle: cutting risk when it matters
A fixed risk number is good. A risk number with a throttle attached is better. The idea is simple and old: as your account draws down, you deliberately reduce risk per trade, in steps, before the maths and your emotions get anywhere near the cliff.
A structure we like, for someone whose base number is 1%:
- Down 5% from equity high: drop to 0.75%. Barely noticeable, but the brake has touched.
- Down 10%: drop to 0.5%. Half size. The account now erodes at half speed while the strategy proves it still works.
- Down 15%: drop to 0.25% or pause entirely for a week. Not forever. A week, with the specific job of re-reading the provider's history and confirming this drawdown is within their normal character, not a new and worse one.
- Recovering: step risk back up at the same thresholds on the way out, only after equity actually recovers, not after you feel better.
Two things make a throttle work. It must be written down before the drawdown, because a rule invented mid-drawdown is just a mood. And the steps must be mechanical, tied to equity levels, not to how the losses felt. The entire value of the device is that it removes decisions from the version of you that will exist at minus 12%, who is not the clear-eyed person reading this now.
Worth being honest about the cost: a throttle slows recovery, since you climb out at reduced size. Some traders hate this enough to skip it. We think they're wrong, and the risk-of-ruin curve is why: the throttle's whole purpose is to make the catastrophic right-hand side of that curve unreachable, and the price is a slower left side. That trade is worth making every single time. For accounts already deep underwater, ours or anyone's, the same logic scaled up is essentially what our drawdown management service exists for: reduced, disciplined risk against a recorded baseline, with no recovery promises, because nobody honest makes recovery promises.
When increasing risk is justified (rarely, and slowly)
Everything so far has argued downward. So when, if ever, is more than your derived number defensible? Occasionally. Under conditions, and the conditions do the work.
The legitimate path looks like this. You've followed the same service for at least three months and a meaningful trade count, say a hundred signals or more. Your own executed results, not the provider's published ones, yours, with your slippage and your missed trades, show the strategy behaves in your hands roughly as advertised. Your worst personal drawdown so far sat comfortably inside your planning number. And your life situation hasn't changed in a way that makes the money more precious. Under those conditions, stepping from 0.5% to 0.75%, or 0.75% to 1%, is a reasoned decision rather than a mood. Step, don't leap: one increment, then another hundred trades of evidence before the next.
The illegitimate paths are more popular. Increasing risk because the service just had a hot month is backwards; hot streaks mean-revert, and you'd be sizing up right before the ordinary cold patch. Increasing risk to recover losses faster is the classic account-killer, doubling exposure exactly when the throttle logic says to halve it. And increasing risk because the account "is too small to matter" is how small accounts stay small until they're gone. If $500 genuinely doesn't matter to you, the correct move isn't 5% risk. It's asking why you're trading money you don't care about, because you'll trade it carelessly, and careless is a habit that follows you to bigger accounts.
A decent heuristic: any risk increase you feel urgency about is the wrong one. Justified increases feel almost boring. They arrive on schedule, backed by a spreadsheet, and change your life not at all in the first month. That's what correct looks like.
Worked examples: $500, $2,000 and $10,000 accounts
Theory earns its keep in the specific cases, so let's size three real-shaped accounts following the same gold signal: entry 3,340, stop 3,332, an $8 stop distance. Value per $1 of gold movement: $100 per standard lot, $1 per 0.01 micro lot.
The $500 account. Here the derivation collides with broker reality. Suppose the owner's honest number is 1%, which is $5 of risk. Maximum size: $5 ÷ ($8 × $100) = 0.006 lots. The minimum at nearly every broker is 0.01, and 0.01 lots with an $8 stop risks $8, which is 1.6% of this account whether its owner likes it or not. That's the truth about $500 accounts on gold: the minimum lot size sets a risk floor above the folklore number, so every trade is slightly oversized by force. The honest responses are limited. Take only the signals with tighter stops, accept the 1.6% and set a stricter throttle, skip concurrent signals entirely, or, better, treat the $500 as tuition while saving toward an account where the maths gets room to work. What the owner must not do is round up to 0.05 lots because 0.01 "isn't worth the spread". At 0.05, that stop-out costs $40, which is 8% of the account, and the survival clock starts ticking loudly.
The $2,000 account at 0.75%. Risk budget $15. Size: $15 ÷ $800 = 0.018, so 0.01 lots honestly, or 0.02 if the owner's derivation supports nudging toward 1%. At 0.01 lots the stop-out costs $8, an ordinary eight-loss streak costs about $63 of the account's equity, and the throttle's first step is a long way off. This account can follow an active unlimited service all month and never face a decision its plan doesn't already cover. Boring. Correct.
The $10,000 account at 1%. Risk budget $100. Size: $100 ÷ $800 = 0.125, call it 0.12 lots. The stop-out costs $96, eight straight losses drags equity down roughly 7.7% to about $9,230, and the plan's 10% throttle step waits below at $9,000. Notice what the larger account buys: not bigger percentage risk, but precision. At 0.12 lots the gap between intended risk (1%) and actual risk (0.96%) is trivial, whereas the $500 account was forced 60% over its intended number by the lot floor. Precision in position sizing forex is a quiet luxury of adequate capital, and it's one more reason we tell people a funded partner-broker account with a few hundred dollars maintained is a saner starting point than scraping in at the absolute minimum. Details on how the free-access route works are on our FAQ; the short version is $250+ maintained with a partner broker, or $99 a month flat, and either way the signals include the stops that make all of this arithmetic possible.
Three accounts, one signal, three different lot sizes, and the same survival logic underneath. The dollar figures change. The reasoning never does.
Your risk number: a five-minute derivation
Enough theory. Pen, paper, five minutes, before the next signal arrives.
- Write your account balance as cash, not a symbol. $2,000, say.
- Write the largest drawdown you can genuinely tolerate, in cash. Not the brave number. The number at which you'd still calmly take the next signal. Suppose it's $300, which is 15%.
- Divide the percentage by sixteen (planning streak of eight, doubled for safety). 15 ÷ 16 ≈ 0.9%. That's your ceiling per trade.
- Apply the follower's discount. New to the service, or under three months of your own live results? Take two-thirds of it: 0.6%. Round to something you'll actually use: 0.5% or 0.75%.
- Set your concurrent cap at two to three times the per-trade number. At 0.75% per trade, total open risk never exceeds 2%. Signals beyond the cap get skipped or halved.
- Write the throttle down. Minus 5%: three-quarter size. Minus 10%: half size. Minus 15%: quarter size or a one-week pause. Date it. Sign it, seriously.
- Diarise a review at 100 trades. Your own results, not anyone's marketing, decide whether the number moves. Up one step if your worst drawdown stayed inside plan; down one step if it didn't.
That's the whole system. It fits on an index card, and an index card you follow beats a risk-management library you don't.
Here's the uncomfortable question to close on, and we mean it as a genuine question rather than a flourish: if you're currently following signals, any signals, can you say what your maximum open risk was last Tuesday? Not roughly. The number. Because if you can't, then whatever you believe about your risk per trade, your actual risk is being set by someone else's trade frequency and your broker's lot minimums, and neither of them has met you. The signal provider picks the trades. The sizing, the streak maths, the throttle, the survival: that part was always yours. Five minutes with an index card and it finally will be.