Every blown account was predictable. Not the specific trade that finished it, not the date, not the news release that gapped gold forty dollars through a stop. But the fact of it. The probability that the account would eventually die was sitting there in the maths the whole time, computable from three numbers the trader already knew about themselves, and they never bothered to run the calculation.
That calculation is called risk of ruin, and it is the closest thing trading has to an actuarial table. Insurers don't know which house will burn down. They know, with unnerving precision, what fraction of houses will. Risk of ruin does the same job for trading accounts: feed it your win rate, your average payoff, and how much you risk per trade, and it hands back the probability that your account eventually hits the point of no return. Not might. Will, with probability attached.
Here's the uncomfortable part. For most retail traders, running their real numbers through the formula produces an answer north of 50%. Sometimes north of 90%. They are, mathematically speaking, already dead and simply haven't finished the paperwork. And the fix is not a better strategy, a better broker, or a better month. The fix is a number, and by the end of this piece you'll know exactly which number is yours.
What risk of ruin actually measures
Risk of ruin comes from gambling theory. The original problem, worked out centuries ago, goes like this: a gambler with a finite bankroll plays a game repeatedly against an opponent with effectively infinite money. What is the probability the gambler eventually loses everything?
The answer turned out to be brutal. If the game has no edge, ruin is certain. Not likely. Certain, given enough time. The gambler's finite bankroll versus the casino's infinite one is a fight the gambler cannot win in the long run without a positive expectancy, and even with one, there's a real chance of going broke before the edge has time to express itself.
Trading is the same game with better graphics. Your bankroll is finite. The market's is not. Every trade is a wager with some probability of winning and some payoff when you do. String enough of those wagers together and your account follows a random walk with drift, where the drift comes from your edge and the wobble comes from variance. Risk of ruin asks a single question about that walk: what is the probability it ever touches the floor?
And here's the part that matters. "The floor" doesn't have to mean zero. In practice it never does. A trader who loses half their account is usually finished as a functioning trader long before the balance reads nothing, because the psychology goes first. A funded trader on a prop challenge is finished at 10% down, hard stop, rules of the programme. So we define ruin as whatever drawdown ends the game for you, and the formula tells you the odds of reaching it. That flexibility is what turns an old gambling curiosity into the most practical risk tool you'll ever use.
One thing risk of ruin is not: a prediction about the next month. It says nothing about sequence, nothing about when. It is a statement about eventualities, the probability that your process, run indefinitely, ever produces a losing streak deep enough to kill the account. If the number is 40%, you might trade for three years untouched. The 40% doesn't care. It waits.
The formula, term by term
There are several versions of the risk of ruin formula floating around, from the exact gambler's-ruin solution to full Monte Carlo simulations. The workhorse version, the one you can actually use on a napkin, looks like this:
R = ((1 − A) / (1 + A))^U
Two inputs. That's all. Let's define them properly, because each hides a decision you need to make honestly.
A is your edge per trade, expressed as a fraction of the amount you risk. For a system that wins fraction p of the time and pays b units for every 1 unit risked, the edge is:
A = (p × b) − (1 − p)
Take a system that wins 50% of the time at a 1.2:1 payoff. A = (0.5 × 1.2) − 0.5 = 0.10. On average, every unit risked returns 0.10 units of profit. That's a genuine edge, a decent one for a retail system, and note how small the number is. Edges in trading are thin. Anyone claiming A above 0.4 or so over hundreds of trades is either exceptional or, far more commonly, hasn't traded through enough conditions yet.
U is your number of units to ruin. This is where the drawdown definition comes in. Decide what drawdown ends you, divide it by your risk per trade, and that's U. If you consider yourself finished at 50% down and you risk 2% per trade, U = 50 ÷ 2 = 25 units. Risk 1% instead and U doubles to 50. Risk 10% and U collapses to 5.
Then the formula raises a number slightly below 1 to the power of U. And that exponent is the entire story. ((1 − A)/(1 + A)) barely changes when you fiddle with the strategy, because edges live in a narrow band. U changes enormously when you change position size, because it's a simple division. The formula is exact when your payoff is 1:1 and a close, slightly optimistic approximation when it isn't, which is fine, because we're not pricing insurance here. We're deciding between 1% and 5% risk, and the formula separates those two choices by orders of magnitude.
A quick honesty note before we use it. The formula assumes your win rate and payoff are what you think they are. Most traders' believed numbers come from a lucky quarter or a backtest with the bad months quietly excluded. Run the formula on numbers from at least 100 real trades or don't bother. If you follow a signal service, demand the same standard from them; it's the reason every closed signal we issue, winner or loser, sits in a public log at /signals/history where the arithmetic can be checked by anyone with a spreadsheet and a grudge.
A 50% win-rate system at three risk levels
Let's make this concrete with a trader we'll call Dan. Dan trades gold, wins almost exactly half his trades, and his winners average 1.2 times his losers. Plugging in: p = 0.5, b = 1.2, so A = 0.10, and the base of our exponent is (0.90 / 1.10) = 0.818. Dan considers his account dead at 50% down, which is honest of him; most people quit or go feral well before that.
Now watch what happens as Dan changes exactly one thing, his risk per trade.
At 5% risk per trade: U = 50 ÷ 5 = 10. Risk of ruin = 0.818^10 ≈ 13.4%. Roughly one chance in seven that Dan's account eventually halves and dies, despite running a genuinely profitable system. Would you board a flight with a one-in-seven chance of not arriving? Dan boards it every day and calls it aggressive growth.
At 2% risk per trade: U = 25. Risk of ruin = 0.818^25 ≈ 0.66%. One in a hundred and fifty. The strategy is identical. The entries are identical. The only thing that changed is the divisor, and the odds of death just improved twentyfold.
At 1% risk per trade: U = 50. Risk of ruin = 0.818^50 ≈ 0.004%. Call it one in twenty-two thousand. At this size, Dan's edge has effectively unlimited time to work. Variance can throw its worst decade at him and the account survives to collect.
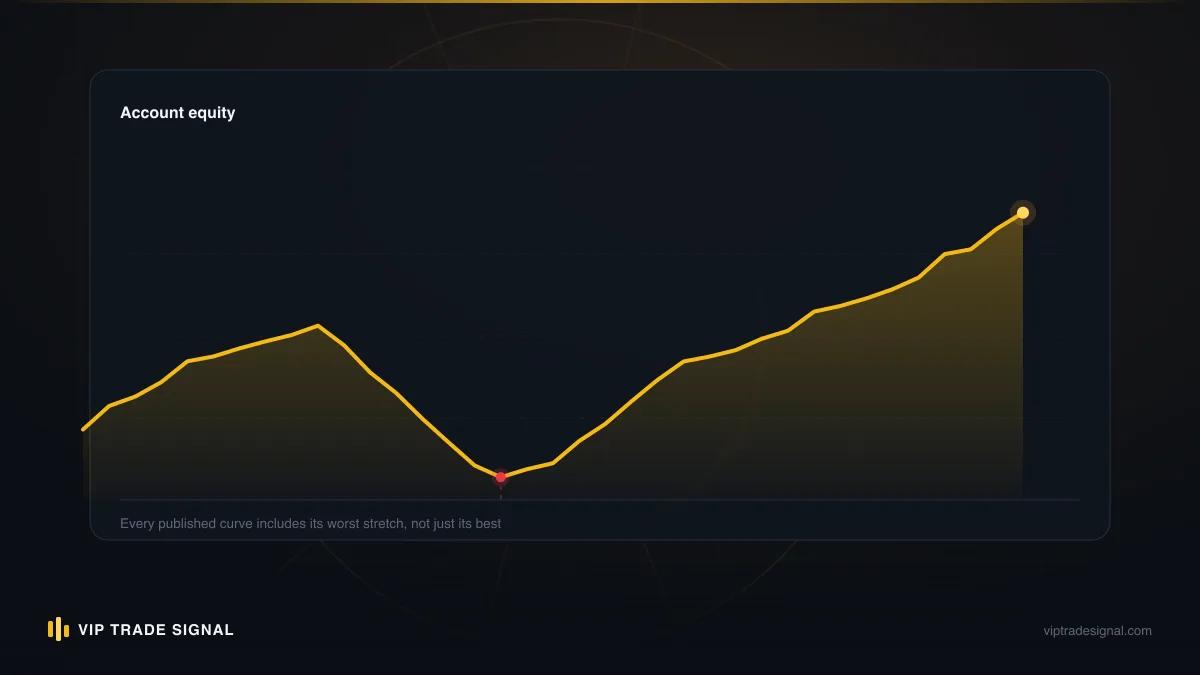
Sit with that progression for a second. 13.4%, then 0.66%, then 0.004%. Same trader, same system, same market. The difference between a coin-flip career and near-immortality was never the strategy. It was the position size, working through an exponent.
This is why experienced traders bang on about small size with a fervour that sounds almost religious to newcomers. It isn't caution as a personality trait. It's that they've seen the exponent, and once you've seen it you can't unsee it.
The ruin table: risk per trade versus probability of death
The worked example used one system. Here's the full grid, because your numbers aren't Dan's. The table below assumes a payoff of 1.5:1 (winners are one and a half times losers, a common shape for a decent gold strategy) and defines ruin as a 50% drawdown. Each cell is the probability the account eventually dies.
| Risk per trade | Win rate 42% | Win rate 45% | Win rate 50% | Win rate 55% |
|---|---|---|---|---|
| 10% | 61% | 28% | 7.8% | 1.9% |
| 5% | 37% | 8.1% | 0.6% | 0.04% |
| 3% | 19% | 1.5% | 0.02% | ~0% |
| 2% | 8.2% | 0.19% | ~0% | ~0% |
| 1% | 0.7% | 0.0004% | ~0% | ~0% |
| 0.5% | 0.005% | ~0% | ~0% | ~0% |
Read it column by column first. A 42% win rate at 1.5:1 is a thin edge, A = 0.05, the kind of edge most honest retail systems actually have. At 10% risk, that trader is more likely than not to blow up. Same trader at 1% risk: less than one chance in a hundred. The edge didn't change. The maths of survival did.
Now read it row by row. At 10% risk per trade, even a strong 50% win rate at 1.5:1 carries nearly a 1-in-12 chance of ruin, and remember this is the optimistic version of the formula. Sprinkle in some slippage, a weekend gap, one correlated double-position, and the true figure is worse. There is no win rate on this table that makes 10% risk sensible. None.
And there's a column missing from that table on purpose: 40% at 1.5:1, which works out to A = 0. Zero edge. At zero edge, risk of ruin is 100% at every position size. Every single cell reads certain death. You cannot size your way out of having no edge; small risk only buys you a slower funeral. This is the formula's second great lesson, less advertised than the first: position sizing to avoid ruin only works if there is something worth protecting. Sizing preserves an edge. It cannot create one.
Position size decides how fast you die. Edge decides whether you die. You need both answers, and the formula gives you both.
If you want a risk of ruin calculator rather than a table, you can build one in a spreadsheet in ninety seconds: one cell for p, one for b, compute A, one cell for your ruin drawdown, one for risk per trade, divide for U, and raise ((1−A)/(1+A)) to the power U. That's the whole calculator. I'd genuinely rather you build it than bookmark someone else's, because the act of typing your own numbers into your own sheet has a way of making them real.
Losing streaks are guaranteed, not unlucky
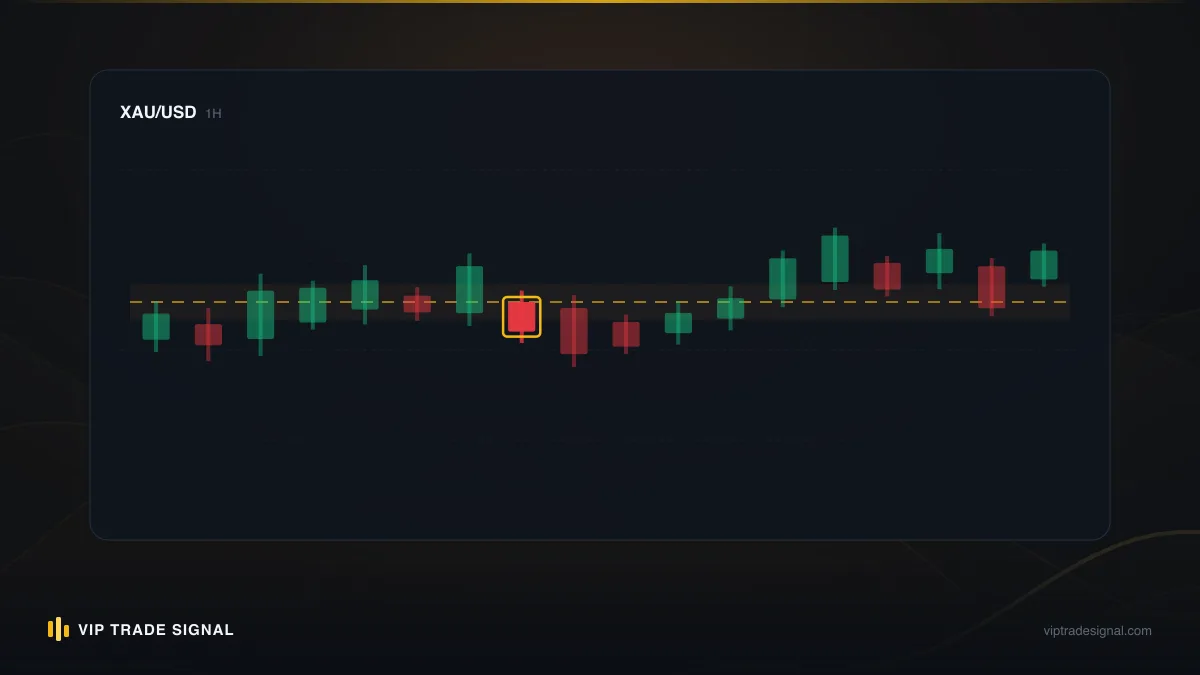
Ruin doesn't usually arrive as one catastrophic trade. It arrives as a streak, and here's the thing about streaks: they are not bad luck. They are scheduled.
The expected longest losing streak in a sequence of trades is roughly ln(N) divided by ln(1/q), where N is the number of trades and q is your probability of losing any one of them. For a 50% win-rate trader over 200 trades, that works out to about 7.6. Call it eight. A trader who wins half their trades should expect, not fear, expect, a run of seven or eight consecutive losses somewhere in their next couple of hundred trades. Over a thousand trades, expect around ten in a row. For a 42% win-rate trader, the 200-trade figure is about ten straight losses, and a run of twelve or thirteen is entirely unremarkable over a full career.
Now do the damage arithmetic at different sizes. Eight straight losses at 1% risk, compounding down, leaves you about 7.7% below where you started. Annoying. A bad fortnight. Eight straight at 5% leaves you 34% down, which for most people is the edge of the psychological cliff. Eight straight at 10% leaves you 57% down, which is past our definition of ruin, from a streak the maths says was always coming.
This reframing matters more than the formula itself, honestly. When you believe losing streaks are anomalies, streak number five makes you feel cursed, and cursed traders do stupid things. They double size to win it back, which multiplies the very exponent that was protecting them, and we've written before about how that spiral takes hold and how to stop revenge trading before it eats a quarter's profits in an afternoon. When you believe streaks are scheduled, streak number five is just weather. You sized for it months ago. You take the sixth signal at the same size as the first.
I traded through a nine-loss streak in 2021 on a gold breakout system that had won 54% of everything before it. Nine. At my 1% sizing it cost less than a tenth of the account and I remember being irritated rather than frightened. The version of me from five years earlier, risking 8% a trade because the system "clearly worked", would not have survived to be irritated. Same streak, same system. Different exponent.
How payoff ratio bends the curve
Everything so far has held the payoff ratio near 1.2 or 1.5 to 1. But b is a live input, and it bends the ruin curve in ways worth understanding, because it's the input traders most often get wrong about themselves.
Raise the payoff and the required win rate falls fast. At 2:1, you break even at a 33% win rate; anything above that is edge. A trader winning just 40% of trades at 2:1 has A = 0.20, double Dan's edge, and their ruin numbers at sensible sizing are effectively zero. This is why trend-following styles with lumpy 35-45% win rates can be safer, in ruin terms, than scalping styles that win 70% of the time but give it back in payoff, spread and the occasional outsized loser.
But, and this is the part the "let your winners run" crowd undersells, higher payoff usually travels with lower win rate, and lower win rate means longer streaks. Our 40%-at-2:1 trader should expect eleven or twelve consecutive losses over a long career. The ruin formula says they survive it fine at 1% risk. Their nervous system might have other ideas around loss number nine, and an edge you can't emotionally execute is an edge you don't have. The formula assumes the robot version of you keeps trading. The human version needs the streak maths from the previous section taped to the monitor.
The trap to avoid at all costs is the opposite corner: high win rate, sub-1 payoff. A system winning 75% of trades but losing 3.5 units for every 1 it wins (hello, martingale variants and most "95% accuracy" signal channels) has A = 0.75 − 0.25×3.5 = −0.125. Negative edge, dressed up in a beautiful win rate. Ruin probability: 100%, at any size, and the high win rate means the account looks brilliant right up until the week it doesn't. If a service won't show you payoff ratio alongside win rate, assume this shape until proven otherwise. Win rate without payoff is a marketing number, not a maths number.
Ruin with a drawdown limit: the prop firm version
Everything above defined ruin at 50% down, a personal, roughly psychological floor. The moment someone else sets your floor, the maths tightens dramatically, and this is where a lot of technically profitable traders come unstuck.
Take a standard prop firm challenge: 10% maximum drawdown, breach it and you're out. Run our thin-edge trader (42% at 1.5:1, A = 0.05) through the formula with the ruin line at 10% instead of 50%. At 1% risk per trade, U = 10 ÷ 1 = 10, and risk of ruin = 0.905^10 ≈ 37%. Read that again. The same sizing that gave this trader a 0.7% ruin probability on their own account gives them a 37% failure probability inside a 10% drawdown limit. Nothing about the trader changed. The floor moved up, U collapsed, and the exponent did the rest.
That's the entire hidden economics of the challenge industry in one calculation. Prop firms don't need you to be a bad trader to collect the fee again; they need U to be small. A 10% limit with 1% risk gives the maths the same shape as trading your own account at 5% risk, which the table already told us is a coin-flip lifestyle for thin edges. To get challenge-survival odds back to something respectable, our trader needs 0.25-0.5% risk per trade, at which point U is 20-40 and ruin drops to a few percent, but so does the pace toward the profit target. The limit squeezes you from both ends deliberately.
It gets worse when the floor moves. A trailing drawdown that ratchets up behind your equity peak effectively shrinks U every time you have a good run, which is a genuinely strange property: success makes you easier to kill. The mechanics deserve their own discussion, and we've gone through them properly in static versus trailing drawdown, but the ruin-formula summary is simple: a trailing limit means your U is always measured from your high-water mark, so the buffer you think you've earned mostly doesn't exist.
The practical rule that falls out of all this: your risk per trade should be set as a fraction of your distance to the floor, not as a fraction of your account. Own account, floor at 50% down, 1% risk gives U = 50. Fine. Funded account, floor 10% away, then the equivalent survival maths demands 0.2% risk per trade. Traders who carry their personal-account sizing into a drawdown-limited environment are running someone else's U with their own habits, and the formula prices that mistake at roughly one blown challenge in three.
Where the formula's assumptions break
I'd be doing the marketing-funnel thing if I presented the formula as gospel, so here's the honest list of where it bends and breaks. Every one of these makes real ruin more likely than the formula says, never less, which is worth noticing. The errors all point the same direction.
It assumes trades are independent. Yours aren't. If you're long gold from two entries, that's one trade wearing two tickets, and your real risk per "trade" is the sum. Correlated positions quietly multiply your effective risk and shrink your effective U. Most surprise blow-ups I've seen weren't one oversized trade; they were three normal-sized trades that were secretly the same trade. And if you hold gold positions across sessions, financing eats at you too, which is a slower version of the same leak; the numbers on swap costs on hedged positions surprise most people the first time they actually add them up.
It assumes your loss per trade is fixed. In liquid conditions with a respected stop, roughly true. Then gold opens Monday $18 through your stop because something happened in the Middle East over the weekend, and your 1% risk prints a 2.6% loss. Slippage and gaps mean your worst losses exceed plan, which is mathematically identical to occasionally risking triple size without telling yourself. Fat tails shave your true U.
It assumes your edge is stationary. Win rates drift. A system built in a trending gold market meets six months of chop and A quietly slides from 0.10 toward zero, where ruin is certain at any size. The formula can't see regime change; only your ongoing record can, which is one more argument for keeping one honestly.
It assumes you keep trading the plan. The formula models an emotionless executor. Actual humans revenge-size after streaks, skip signals after losses, and widen stops to avoid taking the loss. Every one of those behaviours changes p, b, or your risk mid-sequence, always in the ruin-hastening direction.
And it ignores psychological ruin, which arrives first. Plenty of accounts at 30% drawdown are functionally dead, the trader too gun-shy or too reckless to run the system that got them there. Your true ruin threshold is the drawdown at which you stop behaving like yourself. For most people that's far shallower than they'd guess.
And it assumes you actually know p and b, not just estimated them. A win rate computed from 30 trades has a genuinely wide confidence interval — a "50% win rate" measured on 30 trades could easily be anywhere from 32% to 68% at ordinary statistical confidence, and the ruin formula has no idea which end of that range is real. This is why the 100-trade minimum earlier in this piece isn't an arbitrary round number; it's roughly the point where the sampling noise in your win-rate estimate stops swamping the signal. Below that, you're not computing risk of ruin, you're computing risk of ruin for a hypothetical trader who might not be you.
The response to all this isn't to bin the formula. It's to pad it. Whatever ruin probability the formula spits out, treat it as the floor, not the estimate, and size so that even the padded number is boring.
Risk of ruin versus the Kelly criterion
If you've spent any time reading about position sizing, you've bumped into the Kelly criterion, and it's worth being precise about how it relates to everything above, because the two get conflated constantly and they answer different questions.
Kelly sizing solves for the risk per trade that maximizes long-run growth rate of your account. The formula, in its simplest form for a win/loss bet, is f = p − (q / b), where f is the fraction of capital to risk, p is win probability, q is loss probability (1 − p), and b is your payoff ratio. Plug Dan's numbers in from earlier — p = 0.5, b = 1.2 — and Kelly says f = 0.5 − (0.5 / 1.2) ≈ 0.083, or roughly 8.3% per trade. Compare that against the ruin table: at 8% risk with Dan's edge, ruin probability is well into double digits. Full Kelly is, by design, growth-maximizing and terrifyingly close to ruin-maximizing at the same time, because the fraction that grows your account fastest on average is also the fraction that produces the widest swings on the way there.
This isn't a contradiction between the two formulas; it's the same underlying truth seen from opposite ends. Risk of ruin asks "what's my probability of dying at this size?" Kelly asks "what size grows fastest if I don't die?" Full Kelly answers the second question honestly and ignores the first almost entirely, which is why virtually nobody who understands both formulas trades full Kelly. The standard practitioner move is fractional Kelly: take a quarter or a half of the Kelly number as a practical ceiling. Quarter-Kelly on Dan's numbers is about 2.1%, which lines up almost exactly with the "aggressive but survivable" zone the ruin table already flagged. That convergence isn't a coincidence — both formulas are describing the same exponential math, just optimizing for different tails of the same distribution.
The practical takeaway: use Kelly, if you use it at all, as an upper bound you deliberately shrink, never as a target. Compute your Kelly fraction, then run that same number through the risk-of-ruin formula before you trade it. If the ruin probability at your "optimal" Kelly size makes you wince, and for most real trading edges it will, that discomfort is the correct signal. Size down until both numbers, growth rate and survival odds, are ones you'd actually sign your name to.
Setting your own risk per trade from the table
So what number should you actually type into the position size calculator tomorrow? Here's the procedure I'd give a friend, in order, no steps skipped.
- Get your real p and b. Last 100 live trades minimum, from your statement, not memory. Fewer than 100 trades of history? Use 45% and 1.3:1 regardless of what you believe about yourself; it's what unproven systems tend to actually be. Following someone else's signals? Compute it from their published log. No log, no follow.
- Set your ruin line honestly. Not the balance where the account reads zero. The drawdown where you'd quit, tilt, or a firm would remove you. Own money, most people should write 30-40%, not 50. Prop account, it's written in the rules for you.
- Compute A. If it's zero or negative, stop here. Sizing is not your problem, and no risk per trade fixes it. Go back to strategy work and paper trade until A is positive over a real sample.
- Choose your acceptable ruin probability. My take: 1% lifetime is the ceiling for money you'd mind losing, and 0.1% is the grown-up target. Anything above 5% means you're planning to be lucky.
- Solve for risk per trade. Try 1%, compute U and R. Too high? Halve the risk and go again. The spreadsheet takes seconds per iteration and the answer usually lands between 0.25% and 1.5% for realistic edges. It is almost never 3%, and it is never, for any inputs I've ever seen from a real trader, 10%.
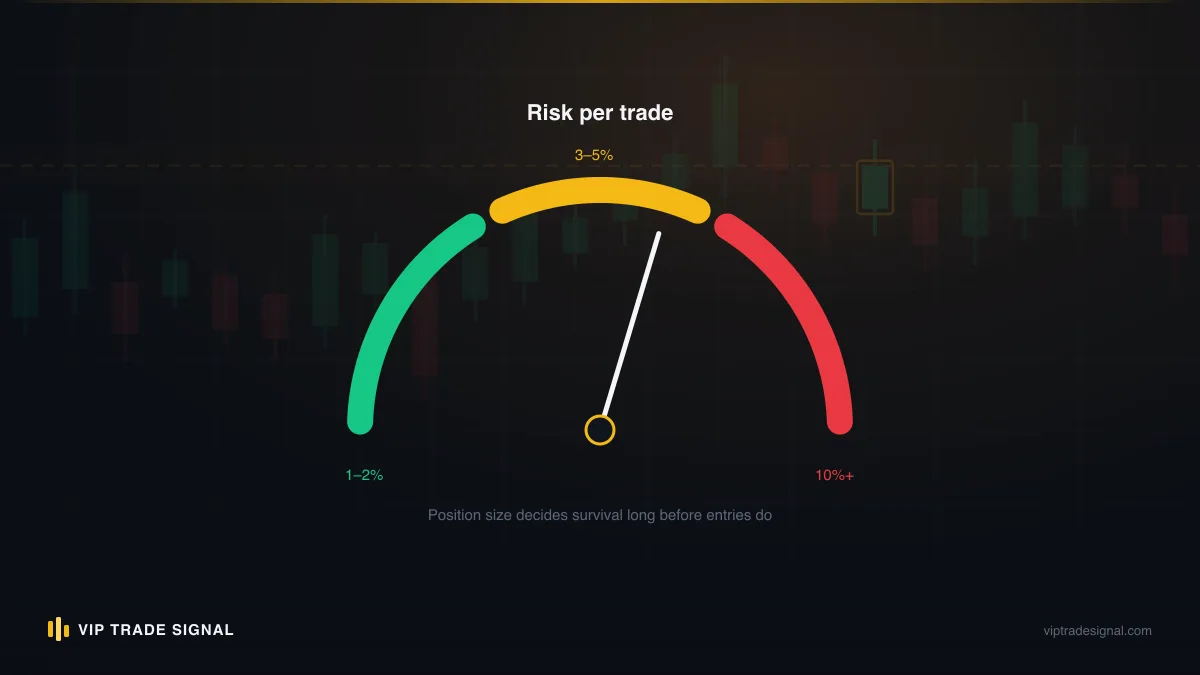
Notice what this procedure does to the usual "risk 1-2%" folk wisdom. Sometimes it confirms it. A genuinely strong edge on your own account with a deep floor supports 1.5%, occasionally 2%. But a thin edge inside a 10% drawdown limit demands a quarter of that, and the folk rule has no way of telling you which situation you're in. The formula does. That's its whole value: it converts "be careful" from a vibe into a number with your name on it.
One more opinionated note. When you first run your real numbers and the answer comes back "you should be risking 0.4%, and at your current 3% you're carrying a 20% chance of eventual ruin", the temptation is to negotiate with the maths. Traders suddenly remember their win rate is probably better than the statement shows, or decide the ruin line can be 60% because they're mentally tough. I've watched this negotiation happen a dozen times. The maths has never once lost it. It just collects later.
Rebuilding after flying too close to ruin
Maybe you're not reading this from a comfortable distance. Maybe the account is already 35% down and the formula is describing your rear-view mirror. Worth saying plainly: drawdowns that deep are survivable, but the arithmetic of getting back is nastier than the arithmetic of getting there, and the rebuild has to respect it.
Down 35%, you need roughly 54% on remaining capital just to touch the old high-water mark. Down 50%, you need 100%. That asymmetry pushes people toward the single worst possible response, which is raising size to speed the recovery. Look at what that does in formula terms: your effective floor is now much closer (you've spent most of your psychological drawdown budget already), so U was small even before you doubled the risk. Recovery-by-aggression takes a wounded account and hands it the ruin profile of a 10%-risk gambler. The table already told us how that ends.
The rebuild that actually works is the boring inversion. Cut risk to 0.5% or below, so that your remaining distance-to-floor buys a large U again. Accept that the recovery is measured in months of expectancy, not weeks of heroics. Re-verify your edge on the way, because a 35% drawdown is sometimes variance and sometimes the market telling you A went negative, and only a fresh sample distinguishes them. Trade the smaller size until the statement, not your mood, says the edge is intact.
And know when the honest answer is help rather than heroics. Part of our desk's work is drawdown management for exactly this situation, accounts floating $5,000-$10,000 down, where we trade the recovery on the client's own account against a jointly recorded baseline and charge a flat half of whatever is genuinely recovered above it. No recovery is ever guaranteed, and we'd rather say that in plain text than earn a fee pretending otherwise; anyone who does guarantee it has told you everything you need to know about them. Whether the hands on the rebuild are yours or someone else's, the maths is identical: small size, honest edge, big U, time.
One practical wrinkle worth flagging: don't scale size back up on the strength of a good week. After a drawdown, the temptation is to treat the first winning streak as proof the edge survived and reward yourself with bigger risk immediately. Wait for the sample the formula actually needs — the same 100-trade minimum from earlier in this piece — before trusting your rebuilt numbers enough to size up again. A promising 15-trade stretch after a drawdown tells you almost nothing statistically; it's exactly the kind of noise that convinced people the account was fine right before the drawdown that put it there in the first place.
The number that was always there
Here's where this leaves you. Somewhere in your trading there is already a risk of ruin number. It exists whether or not you calculate it, the way a bridge has a load limit whether or not anyone's done the engineering. Every trade you've placed has been a wager against that number in ignorance.
Tonight, you can know it. Pull the last 100 trades. Compute p and b, then A. Set the floor you'd actually quit at. Divide, exponentiate, and look at the answer without flinching. If it's under 1%, genuinely well done; you're in a minority and your job is to protect that, mostly by refusing to size up after good months, which is when the exponent gets quietly dismantled. If it's over 10%, you now know something most traders learn only from the receipt: the account, run this way, dies. Not on any particular Tuesday. Eventually, with a probability you can no longer claim you weren't told.
The strange comfort in all this is how little the fix demands. Not a new strategy, not more screen time, not a course. A smaller number in one field of the order ticket, chosen once, defended forever. Ruin is the one outcome in trading you can actually engineer away almost completely, and it's priced in basis points of position size. Cheapest insurance in the business. Most people never buy it.
So: what's your number?