Nobody hands their account to a manager because of the rulebook. They hand it over because of a screenshot — a green equity curve, a month of wins, a confident voice note. And then, three months later, the same people are in our inbox asking why the account is down 40% and the manager has stopped replying.
Here is the uncomfortable truth we have learned from years on this desk: talent gets you into a managed account relationship, but risk management rules in account management are the only thing that keeps the account alive long enough for talent to matter. A brilliant trader with no rules will eventually meet a week that destroys him. A merely decent trader with hard rules will still be standing in year three. If you are choosing between the two, choose the boring one. Every time.
This article lays out the complete rulebook — the six rules a professional managed account actually runs on, with the maths behind each one, and then something most firms will never do: our own gold-desk rulebook, published in full, so you have a concrete standard to hold any manager to. Including us.
Why rules beat talent over any twelve-month window
Think about what a managed account really is. It's your money, someone else's decisions, and a fee agreement in between. The manager's incentive is to generate profit, because that's what they get paid on. Your incentive is subtly different — you want profit and survival. Those two things pull in the same direction most days. On the bad days, they don't.
A manager having a rough month feels pressure to make it back. Without rules, that pressure turns into bigger positions, wider stops, revenge entries after a loss. We've watched it happen to talented traders more times than we can count. The skill was real. The discipline wasn't written down anywhere, so under stress it evaporated.
Here's a number worth sitting with. A trader who wins 55% of the time with even risk-reward — genuinely good numbers over a long sample — will still hit losing streaks of six or seven trades several times a year, purely by chance. Six losses at 2% risk each is roughly an 11% drawdown. Uncomfortable, survivable. Six losses at 10% risk each, because the manager was "confident", is a 47% drawdown. That account needs to nearly double just to get back to flat. Same trader. Same win rate. The only difference is whether a per-trade cap existed and got obeyed.
So when you interview a manager — and you should interview them, not just read their marketing — the first question isn't "what's your return?" It's "show me your written risk rules." If they can't produce them in thirty seconds, or the answer is some version of "I trade what I see", walk. What they see will one day be wrong, and there will be nothing underneath.
The rest of this piece is the six rules that should be in that document.
Rule 1: the 1-2% per-trade risk cap and its maths
The 1-2 percent risk per trade rule is the oldest rule in trading and still the most violated. It says: the maximum you can lose on any single trade, if the stop is hit, is 1% to 2% of the account's current equity. Not the margin used. Not the position size. The loss at the stop.
Run the numbers on a $5,000 account. At 1% risk, a losing trade costs $50. At 2%, $100. Now here's why this specific range and not, say, 5%: it's about how streaks compound.
| Risk per trade | 5 straight losses | 10 straight losses | Gain needed to recover |
|---|---|---|---|
| 1% | −4.9% | −9.6% | +10.6% |
| 2% | −9.6% | −18.3% | +22.4% |
| 5% | −22.6% | −40.1% | +67.0% |
| 10% | −41.0% | −65.1% | +186.9% |
Read the right-hand column twice. At 1-2%, even a horrible ten-trade streak leaves the account in recoverable territory — a decent quarter fixes it. At 5%, you need a two-thirds gain just to get home. At 10%, the account is functionally dead; anyone who tells you they can reliably produce +187% is lying to you or to themselves.
The maths is asymmetric and it doesn't care about talent. Losses require disproportionate gains to repair, and the disproportion accelerates viciously. That's the entire case for the cap. It isn't caution for its own sake. It's arithmetic.
One refinement worth demanding: the percentage should be calculated on current equity, not starting balance. If a $10,000 account is down to $8,500, a 1% risk trade is now $85, not $100. This makes position size shrink automatically during drawdowns — the account defends itself while it's wounded. Managers who keep sizing off the original balance are quietly increasing effective risk exactly when it should be falling.
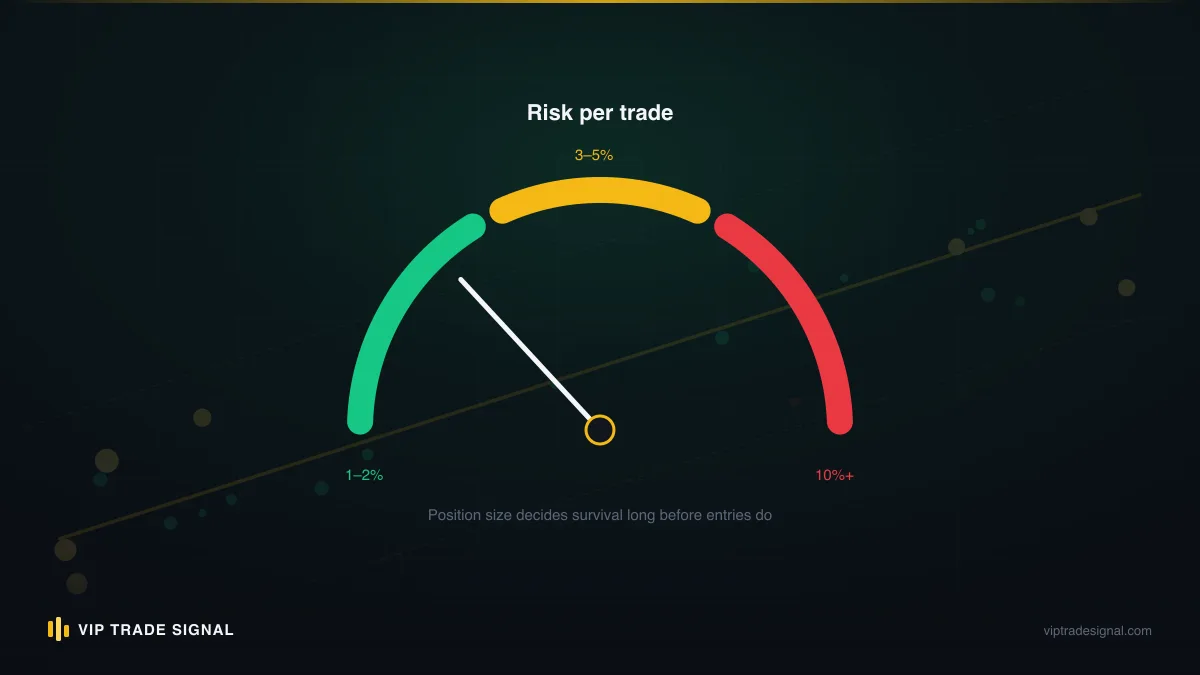
And a practical note for gold specifically, since that's what we trade. XAU/USD moves in dollars-per-ounce and a standard lot pays $1 per $0.01 move — call it $100 per dollar of movement. A $30 stop on gold, which is a perfectly ordinary intraday stop, costs $3,000 per standard lot. On a $5,000 account risking 1%, the correct size is therefore about 0.016 lots — in practice, 0.01 or 0.02. Anyone running 0.5 lots of gold on a $5,000 account is risking the whole account on one wide stop, whatever their marketing says about risk control.
Rule 2: daily and weekly loss stops
The per-trade cap limits any single mistake. It does nothing about a bad day — and bad days are where accounts actually die, because losses cluster. A choppy session that stops out three trades in a row is normal market behaviour. A manager who then takes trades four, five, and six to "make it back" has stopped trading the market and started trading his own frustration.
The fix is a hard daily stop: when realized losses hit a set percentage — 3% is a sensible ceiling for a 1% per-trade book, 4-5% for a 2% book — the platform goes dark until tomorrow. No exceptions, no "one more clean setup". The rule exists precisely for the moment when the manager most wants to break it. That's not a bug. That's the entire design.
A weekly stop sits above it, usually around 6-8%. Its job is to catch the slower bleed: a week where every day loses a little, where no single session triggers the daily stop but the account is grinding lower anyway. When the weekly limit trips, the right response isn't just stopping — it's review. Something about the current market has stopped agreeing with the strategy, and the professional response is to work out what before risking more of your money finding out the hard way.
Prop firms figured this out years ago, which is why essentially every funded-trader programme on earth enforces a daily loss limit at the platform level. They enforce it because they hold the capital and they've seen the data. You hold the capital in a managed account. You should demand the same protection the props demand.
What should the trigger actually be measured on? Realized losses, at minimum — but the stronger version includes floating losses too, because "I haven't closed it so it doesn't count" is the oldest self-deception in trading. A day where three trades were stopped for −2.8% while a fourth position floats another 2% underwater is not a −2.8% day. It's a −4.8% day wearing makeup. And be a little suspicious of managers who treat the daily stop as a target rather than a ceiling — a book that loses exactly 3% with strange regularity is a book being traded to the limit, which is a different and worse thing than a book being protected by it.
There's a psychological dividend here too, one that took us years to appreciate. A hard daily stop doesn't just cap the damage on bad days; it changes how the good days get traded. A manager who knows the day dies at −3% takes the marginal fourth setup less often, because it isn't free — it spends budget that might be needed. Scarcity does what discipline lectures never manage. The budget makes every trade answer a question first: is this worth part of today's 3%?
Two questions to put to any manager:
- What's your daily stop, as a number, and has it ever triggered? (A manager whose daily stop has "never triggered" in two years either barely trades or is lying — normal trading trips it a few times a year.)
- When it triggers, what happens mechanically? "I stop trading" is weaker than "the day's risk budget is spent and the next order would breach it, so there is no next order." Rules that live in software beat rules that live in willpower.
Rule 3: total exposure and correlation caps
Here's a failure mode the per-trade cap can't see. A manager risks 1% on a gold long. Then 1% on a silver long. Then 1% short USD/JPY and 1% short USD/CHF. Four trades, each individually inside the rules — and every single one of them is really the same trade: short the dollar. If the dollar rips higher on a hot inflation print, all four stops go at once and the account takes 4% in a minute. The book was diversified on paper and concentrated in reality.
Correlation is sneaky like that. Gold and silver move together most of the time. EUR/USD and GBP/USD are cousins. Half the major pairs are just the dollar wearing different hats. So a real rulebook carries two caps above the per-trade one:
- Total open risk cap. The sum of risk across all open positions, measured at their stops, cannot exceed a fixed ceiling — 4% to 6% of equity is the professional range. Doesn't matter how good the setups are. When the budget is spent, the next idea waits.
- Correlated exposure cap. Positions that share a driver count as one position for risk purposes. Two gold longs are one 2% position, not two 1% positions. If the manager can't tell you which of their instruments correlate, they haven't thought about it, and you've just learned something important.
This, incidentally, is one of the quieter reasons our desk trades gold only. A single-instrument book cannot hide correlated risk from itself. When we're long gold, we are long gold — one exposure, visible, measured, capped. There's no basket of "different" trades that turn out to be one big dollar bet in disguise. A single market means less diversification, yes, and we'd never pretend otherwise. But it also means the exposure maths is honest by construction, and on a managed account we'd take honest over clever.
The verification question here is beautifully simple: ask for a screenshot of the manager's heaviest recent day and count the open positions. One or two, sized properly? Fine. Nine positions across six pairs on a $10,000 account? You're not looking at a strategy. You're looking at a slot machine.
Rule 4: the equity floor — the account's circuit breaker
Every rule so far manages the trading. This one manages the relationship. The equity floor — sometimes written into agreements as an equity protection stop or maximum drawdown clause — is a line under the account: if equity touches this level, all positions close, all trading halts, and nothing resumes until you, the account owner, say so in writing.
Set it at 20% below starting balance and the deal becomes concrete: a $10,000 account stops entirely at $8,000. Not "we'll reassess". Stops. The floor converts your worst case from an open question into a number you agreed to in advance — which is the only time anyone agrees to sensible numbers, because once the drawdown is live, both parties get emotional and both get stupid.
The floor also fixes an incentive problem baked into profit-share agreements, ours included. A manager paid on profits has, at the bottom of a deep drawdown, a horrible temptation: swing big, because a recovery pays them and a blown account costs them nothing they hadn't already lost. It's a free option on your money. The equity floor deletes the option. There is no "double down at the bottom", because at the bottom, trading is off.
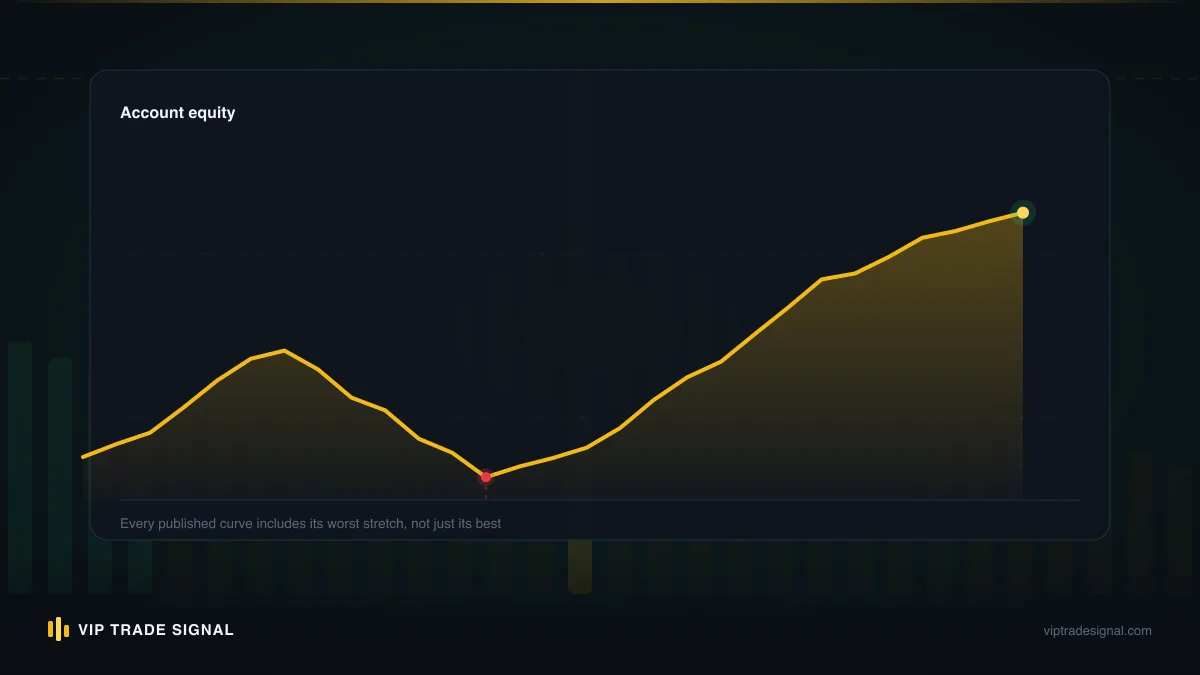
Where should the floor sit? It depends on the strategy's honest drawdown profile, but 15-25% below start is the defensible range for retail-scale managed forex. Tighter than 10% and normal variance will trip it constantly; looser than 30% and it isn't protection, it's decoration. And insist that it operates on equity — balance plus floating profit and loss — not on closed balance. A manager holding a position 35% underwater has a lovely-looking balance and a dying account. Floating drawdown is the real number. Any drawdown limit measured on closed balance only is a loophole with a bow on it.
One more thing, because it matters. If an account has already fallen through where its floor should have been — floating $5,000 or $10,000 down with no rulebook in sight — that's no longer an account management problem, it's a recovery problem, and it needs a different structure with its own baseline and its own rules. That's the situation our drawdown management service exists for, and even there, the honest version comes with no recovery guarantee, ever. Anyone guaranteeing recovery from a deep hole is telling you what you want to hear, and you already know what that's worth.
Rule 5: news and event blackouts
Some losses come from being wrong. Others come from being there — in the market at the exact moment it stops behaving like a market. Scheduled news is the predictable version of that moment, and gold traders know the calendar by heart: US CPI, non-farm payrolls, FOMC rate decisions, the odd emergency headline out of nowhere.
Here's what actually happens to gold in the seconds around a hot CPI print. The spread, normally 20-30 cents, can gap to $2 or $3. Price can jump $15 without trading anywhere in between. Your stop at 3,305 fills at 3,296 because there was simply no liquidity where the stop lived. Slippage isn't a risk at these moments; it's the base case. A trade that was sized to risk 1% can realize 2.5% through no decision anyone made.
The professional answer is a blackout window: no new positions from a set time before tier-one releases — 15 to 30 minutes is typical — and existing positions either closed, reduced, or consciously accepted with the wider risk acknowledged. The exact policy matters less than the existence of one. What you're screening for is whether the manager treats event risk as a category at all.
Because here's the tell. There's a whole genre of manager who loves news — who sits flat all day and then punts a full-size position ten seconds before NFP, because the 200-pip candle is where the excitement is. Some months that works and the equity curve looks glorious. Then one print goes the wrong way, slippage triples the intended loss, and the month is gone. Straddling news with pending orders on both sides sounds clever too, and mostly isn't — both orders can fill in the whipsaw, and now the account is long and short at terrible prices with the spread eating both legs.
News trading isn't immoral. But it's a distinct, high-variance strategy, and it should be disclosed as one — not smuggled inside something sold to you as conservative account management. Ask the manager, flatly: what's your policy in the 30 minutes around CPI and FOMC? "I trade the volatility" is an answer. It's just an answer that should change what risk you think you're buying.
Rule 6: position sizing that adjusts to volatility
The five rules above are guardrails. This one is the engine room — the formula that turns "risk 1%" into an actual lot size, trade by trade. Get this wrong and every other rule is theatre, because the stated risk and the real risk stop matching.
The formula itself is short:
Position size = (account equity × risk %) ÷ (stop distance × value per point)
Worked example, on gold. Equity $8,000, risk 1%, so the risk budget is $80. The setup calls for a $25 stop. Gold pays $100 per dollar of movement per standard lot. So: $80 ÷ ($25 × $100) = 0.032 lots — round down to 0.03. That's it. That's the whole calculation, and it takes fifteen seconds.
Notice what the formula forces. The lot size is an output. It falls out of three inputs — equity, risk cap, stop distance — and the manager doesn't get to choose it directly. Compare that with how most blown accounts are sized: the manager picks a lot size that feels right (0.5 because 0.01 is "too slow"), then bolts a stop on wherever. Size first, stop second is backwards, and backwards is how a $25 stop on 0.5 lots quietly becomes 15% of the account.
The formula also adapts to volatility on its own, which is the underrated part. Gold's daily range isn't constant — a sleepy summer week might see $18 days, while a hot macro stretch runs $60 or more. Wider conditions demand wider stops; wider stops, through the formula, force smaller size. Risk in dollars stays constant while the market breathes. Sophisticated desks formalize this with ATR — average true range — setting stops at some multiple of current ATR so the sizing responds to measured volatility rather than the manager's mood. You don't need to check a manager's ATR settings. You need to check the outputs: pull ten trades from the account history and see whether the lot sizes vary sensibly with stop distance, or whether every trade is mysteriously the same size regardless. Constant lot sizes with wildly varying stops means nobody is doing this maths at all.
This is also, incidentally, the fastest way to evaluate signal-followers and copy-trading setups, not just managers. Same formula, same fifteen seconds, same verdict.
How to verify a manager actually follows their stated rules
Every manager you'll ever talk to claims strict risk management. The phrase is free. So verification can't run on claims — it has to run on evidence, and the evidence lives in the account history, which on MT4 or MT5 is exportable in two clicks and very hard to fake retroactively on a live account.
Ask for the investor password to a live account (read-only access — a standard, safe thing to share, unlike the master password, which you should keep for any account of yours being traded). Then check five things:
- Per-trade risk, reverse-engineered. For each closed trade: lot size × stop distance × point value ÷ equity at the time. Do ten. If the stated cap is 1% and you find trades at 4%, the rulebook is fiction.
- Worst-day clustering. Sort by close time, find the worst day, sum it. Did trading stop when the stated daily limit was hit, or did the losses keep coming past it?
- Stops on every trade. Any position in history without a stop-loss attached is a rule violation by itself. One is a mistake. A pattern is a philosophy.
- Open-position stacking. Look for timestamps where many positions overlapped. Sum their combined risk. Compare with the stated exposure cap.
- Floating drawdown, not just closed balance. The balance line can look serene while the equity line was underwater for weeks. Demand the equity curve.
If the arithmetic in step one feels like homework, do three trades instead of ten. Even three is enough to catch the worst cases, because managers who break the per-trade cap don't break it subtly — you won't find 1.3% where 1% was promised, you'll find 5% sitting in plain sight, usually with a note in your memory of the manager saying "high-conviction setup" around that date. Conviction, in our experience, is the industry's polite word for oversized.
A worked check, so this stays concrete rather than theoretical. Suppose the history shows a gold trade: 0.20 lots, entry 3,340, stop 3,310, and the account's equity at the time was $6,000. Stop distance is $30; gold pays $100 per dollar per standard lot, so 0.20 lots pays $20 per dollar. Risk at the stop: 30 × $20 = $600. On $6,000 of equity that's 10% — on an account sold to you as "1% risk, strictly managed". One trade, ninety seconds of arithmetic, and the whole sales pitch is disproven. That's the power of this check, and it's why so few managers volunteer the raw history unprompted.
Two red flags deserve their own sentences. First, martingale: if you see position sizes doubling after losses — 0.01, 0.02, 0.04, 0.08 — you are looking at a strategy that produces months of smooth profit and then one day of total loss, and no other pattern in the history matters. Second, grid-without-stops: dense ladders of same-direction entries every few dollars, no stop anywhere, drawdown "managed" by hoping. Both patterns are common precisely because they look great right up until they don't.
And insist on live history, not backtests, not screenshots, not a demo. We publish every closed signal — winners and losers — at /signals/history for exactly this reason: the standard we're describing here is only worth something if it can be checked, and a history that hides its losses isn't a history, it's an advert. The broader craft of reading a verified forex track record is worth learning properly; it's twenty minutes of skill that will save you from most of the industry.
Reading rule violations in a track record
Verification tells you whether violations exist. Reading them tells you what kind of manager you're dealing with — because not all violations mean the same thing, and the interesting information is usually in the pattern, not the incident.
Start with when the violations happen. Pull the account's worst drawdown period and examine the trades inside it. This is the manager under maximum pressure, and pressure is when rules either hold or reveal themselves as decoration. The classic signature of a discipline failure reads like a story: normal 1% trades for weeks, then a losing streak begins, and suddenly the sizes creep — 1%, then 1.8%, then 3%, then a 6% trade that was clearly an attempt to win the whole drawdown back in one go. Statisticians would call it variance-chasing. At the pub we'd call it tilt. Either way, the sequence tells you the rulebook has an unwritten final rule: "unless I'm losing."
Contrast that with the healthy pattern, which is almost the mirror image: during drawdowns, sizes shrink. Risk drops from 1% to 0.5%, trade frequency falls, and there's often a visible gap — days with no trades at all right after the worst stretch, which is what a triggered weekly stop looks like from the outside. A track record whose worst period shows smaller, sparser trades belongs to a manager whose rules run deepest exactly when it matters. That pattern is rarer than it should be, and it's worth more than an extra few points of annual return. Genuinely — we would take a 20%-a-year manager with that signature over a 60%-a-year manager without it, and it wouldn't be close.
One caution while you're reading: distinguish violations from variance. A losing month isn't a violation. Seven stopped-out trades in a row isn't a violation — at ordinary win rates it's a statistical certainty over a year of trading, and a manager should be able to say so without flinching. The rules govern behaviour, not outcomes. Punishing a manager for properly-sized losses teaches them to hide losses, and hidden losses are how you end up in the grid-and-pray portfolios from the previous section. Judge the sizing, the stops, the caps. Let the wins and losses fall where they fall.
This reading skill transfers, by the way. The same size-creep signature that exposes a tilting manager also exposes most of the Telegram "account managers" who blow up client accounts on schedule — the pattern is identical, just compressed into weeks instead of quarters. We've written separately about how those Telegram account management scams operate, and the overlap with this section is not a coincidence.
Our gold-desk rulebook, published in full
Standards you can't inspect are marketing. So here is the actual rulebook our desk runs on managed accounts — the same one we'd hand you on day one, in the same numbers.
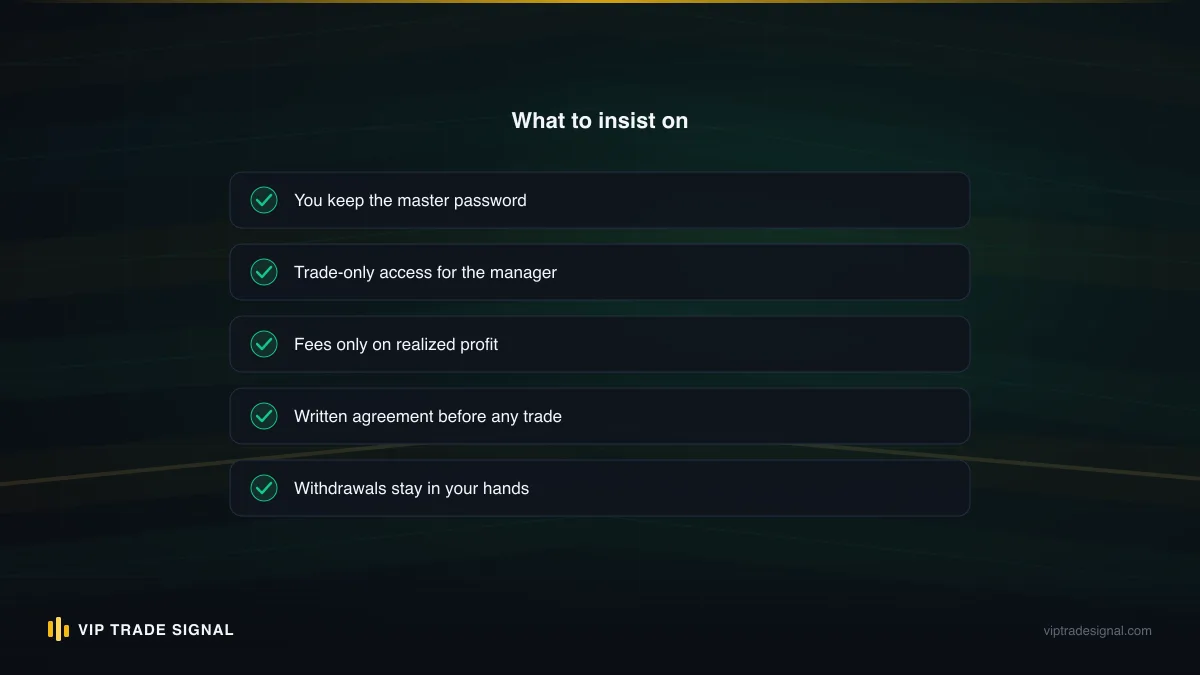
1. Per-trade risk: 1% of current equity, hard cap. Sized on equity at entry, not starting balance, so risk shrinks automatically in drawdown. Every position carries a stop-loss at entry. No exceptions, including "temporary" ones — especially those.
2. Daily stop: 3% realized loss ends the trading day. No new entries after the trigger, full stop, resumes next session. Yes, it costs us the occasional afternoon recovery. It saves us the afternoons that would have made everything worse, and there are more of those.
3. Weekly stop: 6% ends the week and forces a written review. Trading resumes the following week only after the review identifies what changed — market regime, execution, or us.
4. Exposure cap: 3% total open risk. Gold only, so correlation is structurally handled — one instrument, one exposure, nothing hiding in a basket. Never more than three concurrent positions.
5. Equity floor: 20% below the jointly recorded starting balance. Measured on equity, floating losses included. If touched, everything closes, trading halts, and it restarts only on your written instruction. This is your circuit breaker, not ours.
6. News blackout: no new positions inside 30 minutes of tier-one US releases — CPI, NFP, FOMC. Existing positions are either closed or reduced ahead of the window at our discretion, disclosed in the account notes.
The commercial terms sit alongside, because incentives are part of risk management whether anyone admits it or not: we trade your own MT4 or MT5 account, you keep the master password and full withdrawal control, and we're paid a flat 50% of realized profit with a $200 minimum advance. That fee is high-end for the industry — we won't pretend otherwise — and it's structured that way because the minimums are low and everything is pay-as-you-go rather than locked in. The part that matters for this article: because we only earn on realized profit, rules 2 through 5 are the mechanisms that stop that incentive from ever curdling into "swing big with someone else's money". The rulebook exists to protect you from the market, and honestly, partly to protect the arrangement from us. The full structure is on the account management service page if you want the terms end to end.
None of this guarantees profit. Nothing does, and gold is a volatile, high-risk market where losing months are part of any honest record — ours included, all of it public. What the rulebook guarantees is narrower and more valuable: no single trade, day, or week can kill the account, and the worst case is a number you agreed to before anything happened.
A rule checklist to demand in any agreement
Strip everything above down to what you actually do with it, and it's this: before any manager touches your money, get written answers to eleven questions. Not verbal assurances on a call. Written, in the agreement or an appendix to it.
- Maximum risk per trade, as a percentage of current equity — and is it 2% or less?
- Is every position required to carry a stop-loss from entry?
- Daily loss limit, as a number, and what mechanically happens when it triggers?
- Weekly loss limit, and does it force a review before trading resumes?
- Maximum total open risk across all positions at once?
- How is correlated exposure counted — do related positions share one risk budget?
- The equity floor: at what equity level does all trading halt pending my written instruction?
- Is drawdown measured on equity, floating losses included — not closed balance?
- What is the policy around tier-one news events, specifically?
- Do I keep the master password and withdrawal control, with the manager on trading-only access?
- Will you give me read-only investor access to a live account showing these rules being followed for at least six months?
A serious manager answers all eleven without discomfort, because the answers already exist in their process. Evasion on any single one tells you where the account will eventually bleed. Evasion on three or more tells you there is no process, only a person — and you already know how the person performs under pressure, because everyone performs the same way under pressure without rules. Badly.
Some of these answers ripple beyond the account itself, incidentally — profit-share structures and who technically executes the trades can matter for how the taxman sees your returns, which is its own maze we've covered in a separate piece on tax on managed forex account profits. Worth reading before you sign anything, not after.
Here's the closing thought, and it's the one we'd leave you with at the pub. The return a manager promises is a hope. The rulebook is a fact. You can't verify next year's performance, no matter how many screenshots you're shown — but you can verify, this week, with an investor password and a calculator, whether the rules exist and whether they held the last time things got ugly. That's the only due diligence that actually predicts anything. Do the boring version. The exciting version is how everyone else ends up in our inbox.