Nobody opens a trading account planning to lose it. And yet almost everyone who opens one does, usually within the first year, usually in one of about eleven ways. We know because we've watched it happen: to clients before they came to us, to friends, and, in the early days, to our own accounts. The stories differ in the details. The autopsies don't.
So this article is written backwards. Most guides to risk management in forex trading start with theory and work toward profit: here's a ratio, here's a formula, follow these and the money comes. We're starting from the morgue instead. Each section below opens with a way we've actually seen an account die, then derives the single rule that would have kept it breathing. By the end you'll have eleven rules, and the final section stitches them into a one-page risk plan you can fill in and tape to your monitor.
One thing before we start. Nothing here makes trading safe. Forex, gold, CFDs — these are leveraged products, most retail accounts lose money, and a good risk framework changes how you lose far more than whether you lose on any given trade. What it buys you is time. Time to learn, and time to still be at the table in year three when most of your cohort has quietly uninstalled MetaTrader. That's the whole pitch. Survival first, profit as a consequence.
Risk management in forex trading is survival management
The first account autopsy is the most common one, and it's boring: death by a thousand slightly-too-big trades.
A trader we'll call Sam funds an account with $3,000. He's read that professionals risk 1–2% per trade, and he intends to. But intending isn't sizing. He trades 0.50 lots on XAU/USD because that's what the YouTube guy trades, with a 300-point stop, which on gold works out to roughly $150 of risk. That's 5% of his account, five times what he thinks he's risking. He doesn't blow up on trade one. He wins some. Then a normal, unremarkable losing streak arrives (six losses in eight trades, the kind of run any strategy produces eventually) and he's down 27%. Now he needs a 37% gain just to get back to flat, he's frustrated, and his sizing gets bigger, not smaller. You can guess the rest.
Notice what killed Sam. Not a bad strategy. Not a black swan. Arithmetic. The gap between the risk he believed he was taking and the risk he was actually taking, compounded across a perfectly ordinary losing streak.
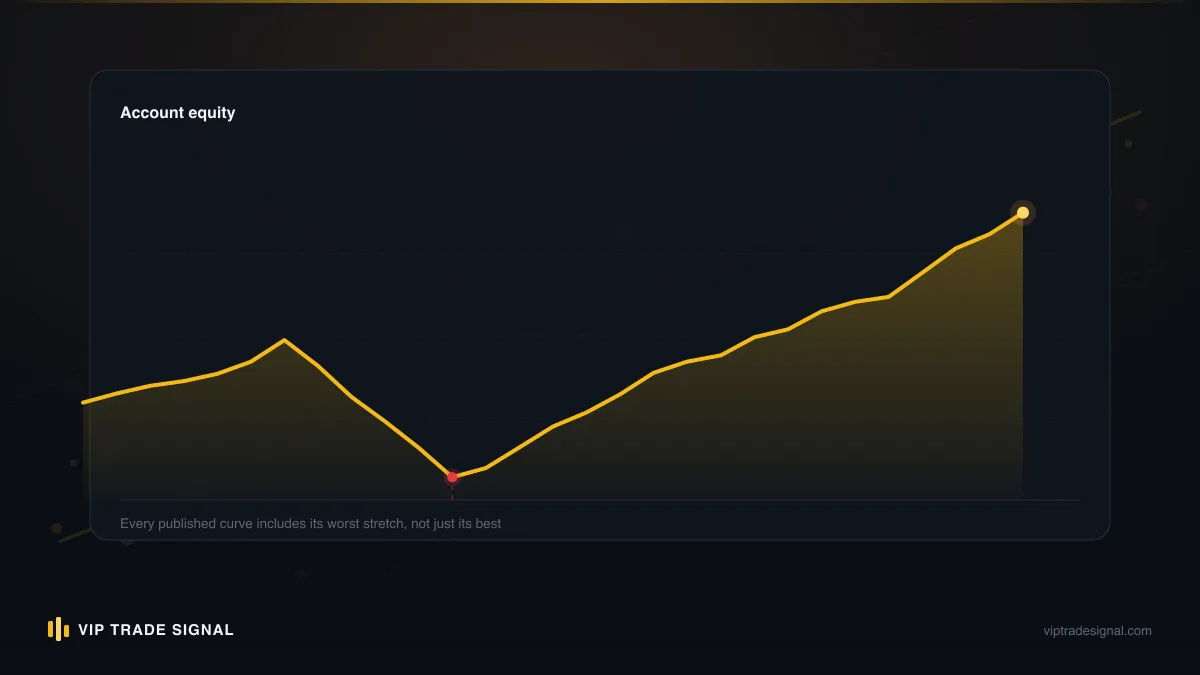
This is why we say risk management is really survival management. The maths of drawdown is brutally asymmetric: lose 10% and you need 11% to recover; lose 25% and you need 33%; lose 50% and you need to double your money just to be back where you started. Nobody plans for the 50% hole, but every oversized position is a down payment on one. The deeper mechanics of how losing streaks interact with position size (the actual probability your account reaches zero given a risk level and a win rate) deserve their own article, and we've written one on risk of ruin that puts numbers on it. The short version: at 1% risk per trade, ruin is close to impossible for any strategy with even a modest edge. At 5%, it's a live possibility. At 10%, it's more or less a scheduled event.
Rule 1: your first job is to make your account impossible to kill quickly. Everything else in this article is a footnote to that.
The 1% rule: what it protects and what it costs
Second autopsy. A trader, call her Priya, actually does the sizing maths, but she sets her risk at 4% per trade because 1% "feels too slow". Her reasoning isn't stupid: at 1% risk and a decent strategy, a $5,000 account might grind out a few hundred dollars in a good month, and she wants it to matter. So she quadruples it. For three months this looks brilliant. Then gold has one of its violent fortnights, her setup stops working temporarily (they all do), and eight losses at 4% each leaves her down just over 28%. She hadn't planned for what 28% down would feel like. It felt like the strategy was broken, so she abandoned it, two weeks before it would have recovered.
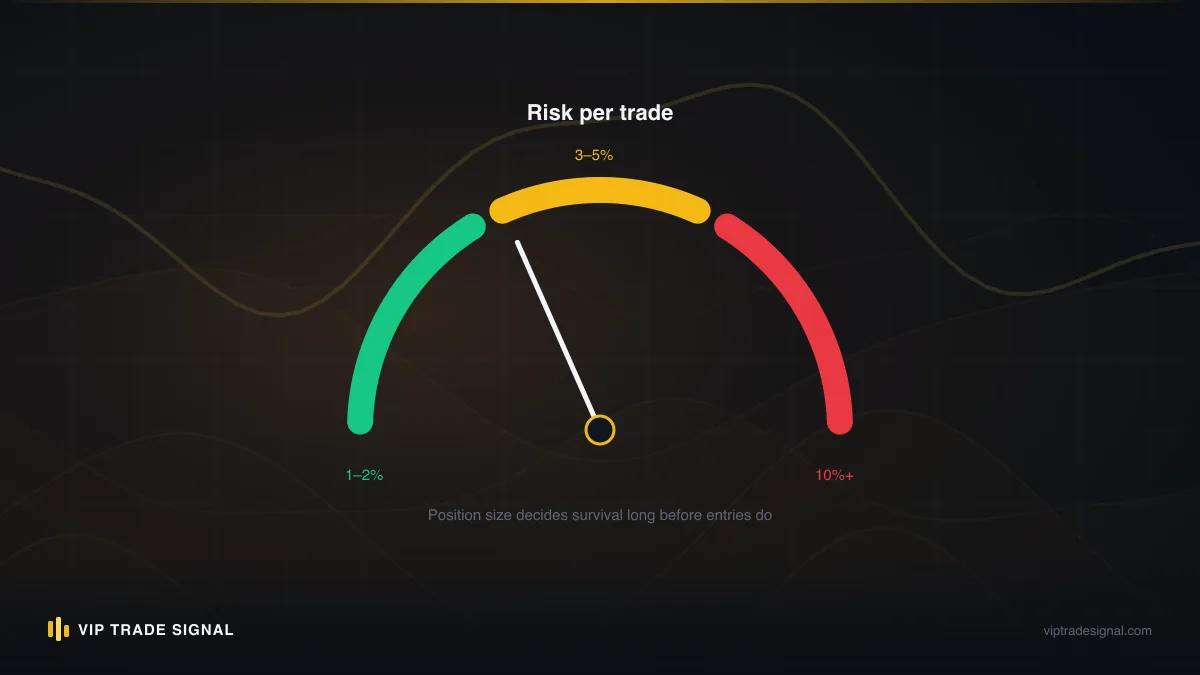
The 1 percent risk rule per trade is the most repeated line in retail trading, and it's repeated because it works, but almost nobody explains what it's actually buying you. It's buying you three things.
First, streak survival. Any strategy with a 50% win rate will produce a run of seven straight losses roughly once every 128 sequences, which sounds rare until you realise an active trader can hit that inside a few months. At 1% risk, seven straight losses is a 6.8% drawdown. Annoying. Recoverable. At 4%, it's a 25% hole and a psychological crisis.
Second, emotional headroom. There's a threshold (different for everyone, but it exists) beyond which a losing trade stops being data and starts being pain. Below that threshold you can close a loser, shrug, and take the next valid setup. Above it, you start moving stops, doubling down, and doing all the things we cover in our piece on revenge trading. The 1% rule isn't just financial engineering. It's a way of keeping every single trade below your personal pain threshold, so your decision-making never degrades.
Third, honest feedback. When trades are small, your equity curve reflects your strategy. When trades are big, it reflects your last three outcomes. You can't evaluate an edge through 4%-sized noise.
Now the cost, because there is one and pretending otherwise is how gurus lose your trust. At 1% risk, growth is slow. A $2,000 account risking 1% has $20 of room per trade; even a strong month of net wins might add 3–5%. If you came to trading to turn $500 into a salary by Christmas, the 1% rule will feel like a prison. But that's the honest trade-off: the 1% rule costs you the fantasy of fast money and pays you the reality of still having an account. We think traders below roughly $10,000, or anyone in their first two years, should treat 1% as a ceiling, not a target. Half a percent while you're proving a strategy is even better. Larger, well-tested accounts sometimes justify 2%. Nothing justifies 5%.
Rule 2: fix your risk per trade at 1% or less, and write down the number before you look at any chart.
Position sizing: the formula and three worked examples
Third autopsy, and it's Sam again, because this specific mistake is that common: the trader who knows the 1% rule and still risks 5%, because he never converted a percentage into a lot size. The rule without the formula is a slogan.
Here's the formula. It's short enough to memorise and important enough that you should:
Position size = (account balance × risk %) ÷ (stop distance × value per point per lot)
Four inputs. Your balance, your chosen risk percentage, how far away your stop is, and what one point of movement costs at one lot. That last one trips people up, so for gold, which is all we trade and therefore the example we'll lean on, the arithmetic is friendly: on XAU/USD, a $0.01 move (one point on most brokers) is worth $1 per 1.00 lot, so a $1.00 move is worth $100 per lot, or $1 per 0.01 lot.
Three worked examples, small to large.
Example one: $1,000 account, 1% risk, gold trade with a $4.00 stop. Risk budget is $10. A $4.00 stop on 0.01 lots costs $4. So your size is $10 ÷ $4 = 0.02 lots, rounding down. Yes, 0.02 lots. Yes, a full winner at 2R makes you about $16. That's what honest sizing looks like at $1,000, and every path to a bigger number runs through months of trades exactly this small.
Example two: $5,000 account, 1% risk, $8.00 stop. Risk budget $50. An $8.00 stop costs $8 per 0.01 lots, so $50 ÷ $8 = 6.25 micro-lots, meaning you trade 0.06. Note what happened: the account is five times bigger than example one but the position is only three times bigger, because the stop is wider. Size responds to both.
Example three: $20,000 account, 0.75% risk, $5.50 stop. Risk budget $150. Stop costs $5.50 per 0.01, so $150 ÷ $5.50 ≈ 27 micro-lots: 0.27. A trader at this size who instead trades a habitual round number (0.50, say, because it feels tidy) is silently risking 1.8%, nearly two and a half times their plan, and will discover this only during the losing streak.
Two habits make the formula stick. Size every trade fresh, from current balance rather than starting balance, so risk shrinks automatically in drawdown and grows slowly with profit. And always round down. The half micro-lot you give up is the cheapest insurance you'll ever buy.
Rule 3: the stop distance comes first, from the chart; the lot size comes last, from the formula. Never the other way round.
Risk-reward ratio: used honestly, not as a slogan
Fourth autopsy: the trader who never lost big and still went broke. He risked 1%, sized correctly, and took profits fast. Really fast. His average winner was 0.4R against an average loser of 1R, because he'd internalised "never let a winner turn into a loser" and cashed out every twitch of green. With a 55% win rate, which he genuinely had, his expectancy was 0.55 × 0.4 − 0.45 × 1 = −0.23R per trade. He was a profitable stock-picker and a guaranteed long-term loser, bleeding out a fifth of a unit at a time, and his risk-per-trade discipline meant it took eighteen months for the account to die. Slow ruin is still ruin.
This is what risk-reward actually governs: not any single trade, but whether your win rate and your average win size, multiplied together, beat your average loss. The relationship is worth having cold. At 1:1 reward-to-risk you need better than a 50% win rate to make money after costs. At 2:1 you break even winning just 34% of the time. At 3:1, 26%. The table cuts both ways:
| Reward:risk | Break-even win rate | Comfortable win rate |
|---|---|---|
| 0.5 : 1 | 67% | 75%+ |
| 1 : 1 | 50% | 58%+ |
| 2 : 1 | 34% | 42%+ |
| 3 : 1 | 26% | 34%+ |
Now the honesty part, because this ratio is the most abused number in signal marketing. A channel that advertises "minimum 1:3 setups" is telling you about intentions, not outcomes; anyone can draw a target three stops away. What matters is the realised ratio: where trades actually closed, including the ones stopped at break-even and the winners cut early at a partial. When we publish our own closed signals at /signals/history, losses included, it's partly for this reason. A planned ratio you can't audit is a decoration.
And don't let anyone tell you a high ratio is automatically better. Stretching targets from 2R to 4R will drop your win rate, sometimes below the new break-even line, because price simply reaches 4R less often. The ratio isn't a dial you turn up. It's a property of your setup that you measure, then check against the table above.
Rule 4: know your realised average win and average loss to one decimal place. If you can't state them, you don't have a strategy yet — you have a hobby.
Stop placement that respects structure and volatility
Fifth autopsy is a two-for-one, because stops kill accounts from both directions.
Trader A used tight stops as a virtue: 150 points on gold, always, because tighter stops meant bigger position sizes and "better risk-reward". Gold's routine hourly noise is frequently wider than that. He got stopped out eleven times in a fortnight, several times within dollars of his entry before price ran the direction he'd predicted. Death by paper cuts, each one a correct idea taxed 1% for being sized against an impossible stop. Trader B had the opposite disease: no stop at all, or a "mental" one, which is the same thing with extra self-deception. One Sunday gap and one refusal to close manually turned a normal loser into a 40% crater.
The fix for both is the same principle: a stop is not a pain threshold, it's a falsification line. It belongs at the price where your trade idea is objectively wrong (beyond the swing low you're leaning on, past the structure that defined the setup) plus a volatility buffer so ordinary noise can't tag it. A practical recipe we like: find the structural level, then add somewhere between 0.5× and 1× the current 14-period ATR on your trading timeframe. On gold in a typical regime that ATR might be $6–$12 on the four-hour chart; in a violent week it can double. The buffer breathes with the market so your stop doesn't sit inside the noise band.
Then comes the part Trader A never accepted. If the resulting stop distance makes your position embarrassingly small, the answer is a small position, not a closer stop. The chart sets the stop. The formula sets the size. The moment you move a stop closer to afford a bigger position, you've reversed the entire chain of logic this article is built on, and you're back to sizing by feel with extra steps.
Two more stop rules we'd defend in an argument. Stops only ever move in your favour after entry; the trade that "just needs a bit more room" is the trade that needed to die. And every stop is a hard order on the server, not a line in your head, because your Sunday-night self cannot be trusted to execute what your Tuesday-morning self planned.
Rule 5: place the stop where the idea is wrong, buffer it for volatility, and let the size (never the stop) absorb the consequence.
Correlation: when five trades are one trade
Sixth autopsy: the diversified trader who wasn't. She ran five positions, each sized at a disciplined 1%: long EUR/USD, long GBP/USD, short USD/JPY, short USD/CHF, and long gold. Five ideas, five per cent total risk, sensibly spread. Except look at the common thread: every one of those positions was a bet against the US dollar. When a hot inflation print sent the dollar vertical, all five hit their stops inside ninety minutes. She'd planned for a 1% loss and taken a 5% one, from what was, economically, a single trade wearing five costumes.
Correlation is the quietest killer on this list because everything looks fine until the exact moment it doesn't. Currency pairs sharing a leg move together by construction. Commodity currencies travel with their commodities. And gold, our own instrument, is joined at the hip to the dollar and to real yields. Long XAU/USD is a dollar-negative position, so pairing it with three other dollar-negative positions isn't diversification, it's a pyramid.
The professional fix is a correlation matrix and per-currency exposure limits. The retail fix can be much simpler. Before adding any position, ask one question: if my most crowded theme reverses hard, what do I lose across everything open? If the answer is more than about 3% of the account, you're done adding risk in that direction, whatever the new chart looks like. Some traders formalise it as no more than 2% total risk exposed to any single currency at once, and that works too.
There's a version of this that sounds like a limitation of our gold-only approach, so let's say it plainly: trading one instrument doesn't make correlation risk vanish, it makes it visible. Three open gold longs at 1% each are one 3% position, full stop, and we treat them that way. We'd rather manage one exposure honestly than five exposures that secretly agree with each other.
Rule 6: count your risk by theme, not by ticket. Five correlated 1% trades are a 5% trade.
Daily and weekly loss limits
Seventh autopsy, and if you've traded for more than a year you've either witnessed this one or starred in it: the single catastrophic day. The account had survived months of disciplined trading. Then one bad London session. A loss, a fast re-entry, another loss, a doubled re-entry "because the level is even better now", and by New York close a year's patience is gone. Ask this trader about risk management on any normal day and they'd recite everything above, correctly. The rules didn't fail. The person operating them did, for about six hours, and six hours was enough.
That's the case for a daily loss limit rule, and it's worth being precise about what the limit is for. It is not for the market. It's for you — specifically for tilted-you, who will exist someday, whose judgment is warm mush, and who cannot be reasoned with in the moment. The circuit breaker has to be installed while you're calm, which is why it goes in the written plan and not in your intentions.
Our recommended numbers: a daily stop of 2% (or three consecutive full losses, whichever comes first) and a weekly stop of 5%. Hit the daily limit and you're flat and done until tomorrow. Not "just watching", because watching becomes one more trade with a probability of about one. Hit the weekly limit and you take the rest of the week off and spend an hour with your journal working out whether the problem is variance or you. Prop firms run their entire evaluation model on daily loss limits, and whatever you think of prop firms, they've discovered something true about retail traders: most accounts don't die of a hundred small cuts. They die of three or four terrible days.
Make the limit mechanical if you possibly can. Some platforms and brokers support automatic equity-based flattening; if yours doesn't, the low-tech version is closing the terminal and physically leaving the room. And when you resume the next day, resume at normal size. The urge to trade bigger to "win the day back" is the same disease with a calendar attached. We've written up the full pattern, and how to break it, in the revenge trading piece.
Rule 7: pre-commit to a daily loss limit around 2% and a weekly one around 5%, and treat hitting them as the plan working, not failing.
News events and weekend gap exposure
Eighth autopsy: the trader who was right about everything except the clock. Short gold with a tidy 1% risk, a stop above obvious structure, textbook. Then a US CPI release he hadn't checked the calendar for. Gold moved $30 in under a minute, blew through his stop with essentially no liquidity behind it, and filled him $9 worse than his stop price. His planned 1% loss cost 2.3%. Same trade, held over a weekend into surprise geopolitical news, could have gapped further still. A hard stop protects you from ordinary moves, but it cannot promise a fill price through a gap, and anyone who tells you otherwise hasn't traded through one.
Slippage on news isn't a broker scam (usually). It's physics. A stop order becomes a market order when touched, and a market order in a one-sided market fills where the other side reappears, not where you drew the line. Which means event risk needs managing before the event, because during it you're a passenger.
The practical routine costs five minutes a week:
- Sunday or Monday: read the week's calendar. For gold traders the short list is US CPI, non-farm payrolls, FOMC decisions and the press conference, and lately any headline that moves real yields. Mark the times in your own timezone.
- Decide each event's policy in advance (flat, reduced, or hold). Ours defaults to no fresh entries in the 30–60 minutes before a red-flag release, and either closing or halving anything open that sits within one ATR of its stop.
- Treat weekends as an event. Gold opens Monday wherever the weekend's news left it. If holding through, size so a gap of two or three times normal daily range against you is survivable. Or just don't hold.
- After the release, wait for the spread to normalise. The first minutes after a big print have spreads wide enough to stop you out of trades that never really went against you.
None of this means never trading around news; some strategies live there. It means the exposure is chosen, sized and written down, never discovered.
Rule 8: know the calendar before the market does its scheduled screaming, and assume any stop can slip when it matters most.
Leverage: choosing your own ceiling
Ninth autopsy is the fastest one in this article. A new trader took a broker's offered 1:500 leverage as a suggestion, put 60% of his margin into a single gold position (because the platform let him, and surely they wouldn't let him do something ruinous?) and was margin-called inside two days on a move gold makes several times a year. Time from deposit to effective zero: eleven days. He never had a strategy fail. He never got to have a strategy.
Let's decouple two things the marketing deliberately blurs. Leverage offered is a facility, like a credit card limit. Leverage used is a decision, and it's the only number that matters. The beautiful thing about everything earlier in this article is that if you size positions from stop distance and a 1% risk budget, your used leverage almost takes care of itself. A $5,000 account trading 0.06 lots of gold at $3,300 controls about $19,800 of exposure, roughly 4:1, regardless of whether the broker offers 1:30 or 1:500.
So the ceiling rule is a backstop, not a primary control, but it's worth having because it catches errors the formula can't: the fat-fingered extra zero, the "one-off" oversized conviction trade, the martingale sequence rationalised one doubling at a time. Our suggested backstop: total exposure across all open positions never exceeds 10:1 on your equity, and for your first year, 5:1. If a trade sized by the formula would breach it, something upstream is wrong (usually a stop so tight it's fantasy) and the breach is the alarm.
High offered leverage does have one genuine use: it lets a small account hold margin efficiently so more equity stays free as drawdown buffer. That's it. That's the whole legitimate use case. Anyone presenting 1:500 as a way to "amplify profits" is describing a lottery ticket with worse graphics.
Rule 9: your broker sets the leverage you're allowed. Your risk plan sets the leverage you use. Only one of those numbers cares whether you survive.
Reviewing risk after wins (yes, wins)
Tenth autopsy, and it's the strangest on the list: the account killed by a winning streak. A trader ran four excellent months. Disciplined, patient, plus 19%. Then, gradually, the rules that produced those months started to feel beneath him. Risk crept from 1% to 1.5% ("the account's bigger now, and I've clearly improved"). Setups got marginal, because everything he touched was working. Correlation limits went first, then the daily stop, waved off with the private thought that limits are for people who lose. When a normal cold streak finally arrived, it met a trader risking double, trading more, and psychologically unprepared for losses he'd forgotten were part of the job. The drawdown that followed was deeper than anything from his losing days.
Winning is a risk event. Nobody says this, and everybody eventually learns it. Confidence rises faster than skill; a good month rarely means your edge improved and usually means variance smiled; and the discipline that feels essential at 5% down feels bureaucratic at 19% up. So build the review in, on a schedule, and make it fire after wins as strictly as after losses.
The monthly review we run takes under an hour. Pull every closed trade. Check four things: did realised risk per trade match planned risk (measure it, because sizing drift hides in rounding "up just this once"); did any day breach the daily limit, and what happened next; what was the realised average win versus average loss against the table from earlier; and, the question that catches winning-streak rot, would this month's trades all have qualified under the plan as written in January? If the honest answer is no, the plan didn't evolve. It eroded.
Adjust risk upward only slowly and only on evidence: something like 100+ trades at the current setting, drawdown contained, expectancy positive after costs. Even then, move 1% to 1.25%, not 1% to 2%. There's no equivalent waiting period for cuts. Risk down is always allowed, immediately, no committee.
Rule 10: audit your risk monthly, and treat a great month as exactly the same trigger for review as a terrible one.
What the drawdown spiral looks like from inside
Before the template, one autopsy that deserves its own section, because it's the one where people finally go looking for help. Usually the wrong kind.
The account is down 35%. Not from one disaster; from four or five of the failure modes above, layered. And here's the trap: the trader now needs a 54% return to get back to flat, knows it, and every instinct screams that the only way out is more risk. Bigger size, looser rules. The arithmetic of recovery whispers that careful trading will take a year, and desperation doesn't have a year. So the risk goes up precisely when the judgment is worst, the hole deepens, and somewhere in that spiral the trader starts googling for someone, anyone, who can trade the account back.
That's the moment the sharks circulate: recovery "gurus" promising guaranteed returns, martingale EAs with smooth backtests, account managers who need your master password and are never heard from again. If you're in that spiral, the honest sequence is: stop trading entirely, this week; measure the true damage; cut risk to a fraction of normal, because the account that remains is the account you have, not the one you're owed; and only then decide, with the desperation dialled down, whether the path back is your own trading, rebuilt on the rules above, or help. The difference between a static number you're defending and a high-water mark that moves matters enormously here too; if your loss limits come from a prop firm, read our piece on static versus trailing drawdown before you plan a recovery inside one, because the two regimes punish completely different behaviour.
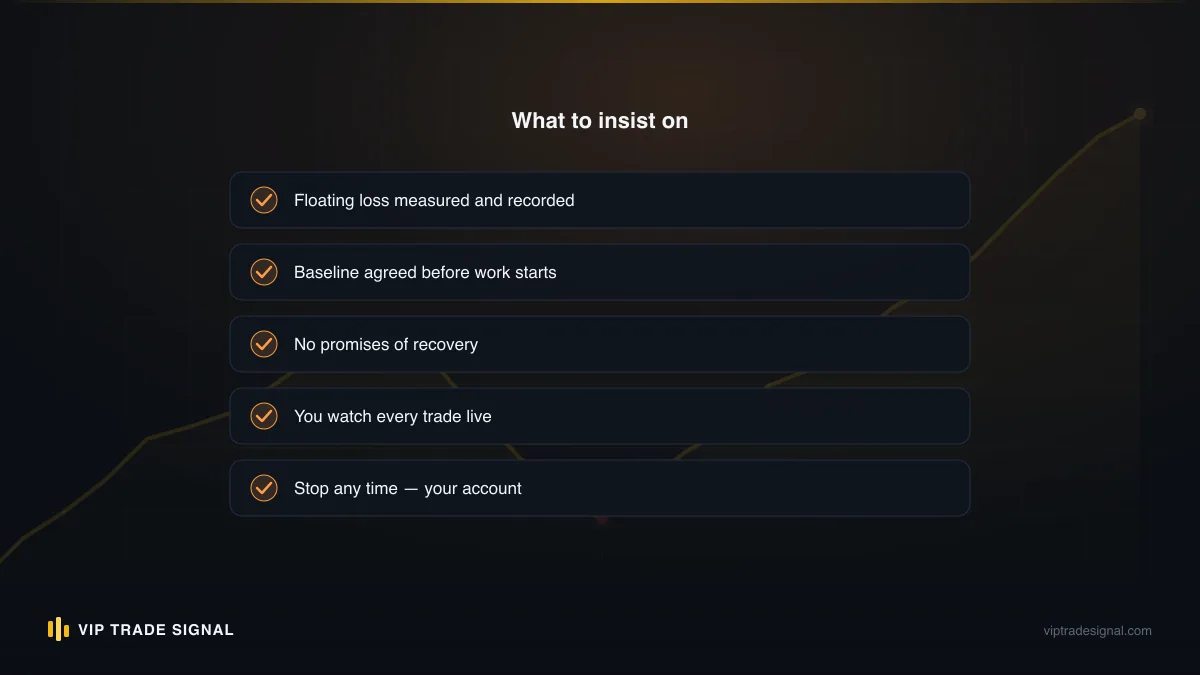
We'll mention our own dog in this fight once, plainly, because this is the article where it's relevant: our desk runs a drawdown management service for accounts floating roughly $5k–$10k down. You keep the master password and control of withdrawals, we trade the recovery on your own MT4/MT5 account, and the fee is a flat 50% of recovered profit above a baseline we both record at the start. No recovery is ever guaranteed and we say so in writing, because anyone in this business who guarantees one is describing your money's future, not theirs. Whether it's us, someone else, or (best of all) a rebuilt version of you, the entry requirement is the same: the bleeding stops first.
Rule 11: the deeper the hole, the smaller the shovel. Risk goes down in drawdown, mechanically, and any voice arguing otherwise is the spiral talking.
Your one-page risk plan template
Eleven autopsies, eleven rules. Here they become one page, and one page is the point. A risk plan you can't see in a single glance is a risk plan you'll consult after the damage. Copy the skeleton below into a document, fill in every blank with a number or a written answer (no "it depends" — decide), print it, and put it where your trading eyes can't avoid it.
THE PLAN — [your name], [date]
- Account and unit. Current balance: $____. Risk per trade: ____% (≤1%; ≤0.5% if the strategy has fewer than 100 live trades behind it). One R in dollars, today: $____.
- Sizing procedure. Stop placed at structure + ____ × ATR(14) buffer, before size is calculated. Size = (balance × risk%) ÷ (stop distance × per-point value). Always rounded down. Recalculated from current balance every trade.
- Ratio floor. Minimum planned reward:risk to take a trade: ____ : 1. Realised averages checked monthly against the break-even table.
- Exposure caps. Max simultaneous open risk: ____% (suggest 3%). Max risk in one direction/theme (a stack of gold longs counts as one theme): ____%. Max total leverage used: ____ : 1 (suggest 5:1 first year).
- Circuit breakers. Daily stop: −____% or ____ consecutive losses → flat, terminal closed, done for the day. Weekly stop: −____% → done until Monday, journal review required before restart. Resuming size after a breaker: normal, never bigger.
- Event policy. Calendar checked every ____ (suggest Sunday). Red-flag events for my instrument: ____________. Default policy 60 minutes before: no new entries; open trades within 1 ATR of their stop are ____ (closed / halved / held — pick one now).
- Weekend policy. I hold over weekends: yes / no. If yes, positions held must survive a gap of ____ × average daily range against me.
- Stops. Every position has a hard server-side stop at entry: yes (there is no other answer). Stops move only in the trade's favour.
- Review. Monthly audit on the ____ of each month: planned vs realised risk, breaker breaches, realised win/loss averages, and the January test — would every trade this month have qualified under the plan as originally written?
- Change control. Risk increases require: ____ trades of evidence and drawdown under ____%, and move by max 0.25% at a time. Risk decreases: allowed instantly, always.
Filling this in properly takes an evening. Do it while you're calm and flat, because every number you leave blank will eventually be filled in by the worst version of you, at speed, mid-losing-streak. And that trader's numbers are the ones in the autopsies above. If you want to pressure-test the finished page, our FAQ covers how we apply the same framework to our own signals, and every closed result sits in public either way.
The market will hand you losing streaks. That's not pessimism, it's the entry fee, and no plan on earth changes it. What the page changes is what a losing streak costs (a shallow, survivable dent instead of a crater) and whether you're still solvent and still trading when your edge comes back around. Accounts don't die of losses. They die of size, and size is the one thing on this whole page that's entirely yours to choose.