Somewhere on your phone right now, probably two scrolls deep in Instagram, a man in a rented Lamborghini is promising you 20% a month. He has a screenshot. The screenshot has a lot of green in it. And if you have ever wondered why, if that number were real, he needs your $500 at all, then you already have better instincts than most of the people who wire him money.
This article is about realistic monthly returns in forex. Not the returns in the ads, and not the returns in the backtests, but the returns that professionals with audited track records actually produce year after year. We run a gold signal service and a managed account desk, so you might expect us to inflate the numbers like everyone else. We're going to do the opposite, because the single biggest reason clients blow up, quit, or get scammed is that they walked in expecting the wrong number. Fix the expectation and half the other problems fix themselves.
Fair warning before we start: some of what follows is uncomfortable. The honest figures are much smaller than the advertised ones. They are also achievable, compoundable, and real, which the advertised ones are not.
Why every ad says 10-30% monthly
Start with the obvious question. If realistic returns are modest, why does every Telegram channel, every "fund manager" DM, and every PAMM listing promise double digits a month?
Because claims are free and verification is expensive. A marketer who advertises 3% a month loses the click to the marketer who advertises 15%, and neither of them expects to be audited. The customer has no cheap way to tell the difference at the point of purchase, so the market rewards whoever lies most confidently. Economists call this a lemons market. Traders call it Tuesday.
There's a second mechanism, and it's subtler. A reckless trader really can make 20% in a month. Risk 10% per trade on gold, catch a trending week, and the account screenshot writes itself. The same style produces a margin call within a quarter, but the screenshot was taken at the peak, not at the funeral. So the ads aren't always fabricated. Sometimes they're just survivorship: one hot month, photographed, framed, and sold as a lifestyle.
And there's a third mechanism nobody likes to admit: the audience wants the big number. A $2,000 account earning a genuinely good 4% month makes $80. Eighty dollars doesn't change anyone's life, and the person searching "high return forex managed account" at 1am is usually trying to change their life. Sellers promise transformation because transformation is what's being shopped for. The honest pitch, "steady compounding on capital you'll add to over years", is true and boring, and boring loses auctions for attention.
None of this means good performance doesn't exist. It means the advertised number and the achievable number come from two different worlds, and you need a way to tell them apart. The rest of this piece is that way.
The compounding absurdity test
Here is the fastest lie detector in trading, and it requires nothing but a calculator.
Take any advertised monthly return. Compound it. See where the money ends up. If the destination is absurd, the claim is false. Not "optimistic". False.
Run 10% monthly, the most common claim out there, on a $10,000 account:
| Time | $10,000 at 10% per month |
|---|---|
| 1 year | $31,384 |
| 3 years | $309,127 |
| 5 years | $3.04 million |
| 10 years | $925 million |
| 15 years | $281 billion |
Ten years to nearly a billion dollars. Fifteen years to more than the GDP of Finland, from ten grand. Anyone who could genuinely sustain 10 percent monthly forex returns would own every leaderboard in finance within a decade, and the strategy would stop working long before that because position sizes would outgrow the market's liquidity. The trade would start moving the price against itself.
Now notice what the test tells you about the seller. Someone offering to trade your $500 for a 30% cut, while allegedly holding a money machine that turns $10k into $900m, is asking you to believe he prefers your $150 to his billion. He does not. What he actually holds is a marketing funnel, and your deposit is the product. We wrote up the standard version of this con in our piece on Telegram account management scams, and the inflated return claim is step one in almost every case.
The absurdity test has a softer setting too. Even 5% monthly compounds to 80% a year, which would put a retail trader ahead of nearly every hedge fund on the planet, every year, without a losing one. Possible for a stretch? Yes. As a sustained, decade-long baseline? The world's best-resourced trading firms would like a word.
A useful habit, whenever anyone quotes you a monthly figure, is to translate it to annual before you react. Monthly numbers are chosen by marketers precisely because they sound small while being enormous. "Just 8% a month" registers as modest; compounded it's 152% a year, roughly ten times what a good macro fund prints. "Only 3% a month" sounds almost apologetic and still annualises past 42%, a figure that would have institutional allocators flying out to meet you. Do the translation silently, every time, and a good chunk of the industry's marketing simply stops working on you. The monthly frame is not an innocent convention. It's a unit chosen to smuggle absurd numbers past your intuition, the way supermarket pricing uses per-100-grams when the per-kilo figure would sting.
If the advertised return, compounded for a decade, makes the seller richer than a small country, the return is fiction and you're the revenue.
What hedge funds and CTAs actually make
So what do the professionals return, the ones with audited books, prime brokers, and investors who sue?
Global macro and currency-focused hedge funds, the closest institutional cousins to retail forex trading, have historically returned somewhere in the mid single digits to low teens per year. Not per month. Per year. Barclay's currency trader indices have spent whole decades averaging low single digits annually. CTAs, the managed futures firms that trade trends across currencies and metals, tend to land in a similar annual band, with famous outlier years in both directions.
Let that reframe sink in, because it's the crux of the whole subject. A fund that compounds 15% a year for ten years is a star. Managers get very rich on far less, because they're compounding it on hundreds of millions of institutional money. The entire professional asset management industry, with its PhDs, its microwave towers, its data budgets bigger than your town, competes ferociously over annual numbers that a Telegram channel claims to beat every month.
Two honest caveats, because the comparison isn't perfectly clean. First, funds are usually managing enormous capital, and size genuinely drags on returns; a nimble trader on a $20k account can take trades a $2bn fund can't. Second, funds run conservative leverage because their investors punish drawdown harshly. A retail account willing to swallow deeper drawdowns can legitimately target higher returns than a fund would dare print.
What about prop firms, the funded-account industry that's eaten so much of retail's attention lately? Their payout structures accidentally confirm the same story. Most funded programmes cap daily loss around 5% and total drawdown around 10%, and their internal statistics, the ones that occasionally surface in interviews and disclosures, suggest only a small minority of funded traders ever collect a payout at all, let alone repeatedly. Firms whose entire business is finding profitable traders, screening thousands of applicants a month, structure their risk rules on the assumption that a trader making a steady 3-6% monthly inside tight drawdown limits is a rare and valuable animal. If sustained double-digit months were common, the prop model's economics would collapse overnight. They're thriving, which tells you what the pass rates really are.
Both caveats are real. Neither stretches far enough to reach the ad copy. Being small and aggressive might plausibly multiply a professional-grade annual return by two or three. It does not multiply it by twelve and relabel the year a month. When someone quotes you a monthly figure that beats Bridgewater's annual one, the explanation is not that they're nimbler. The explanation is on the previous section's table.
The verified retail data: an ugly, honest distribution
Institutions are one benchmark. The more relevant one is verified retail: the tens of thousands of live accounts with tracked records on platforms like Myfxbook and FX Blue, and the manager leaderboards on PAMM services where the broker, not the trader, reports the numbers.
Spend a few evenings in that data, as we have over the years, and a consistent shape emerges. It's not a bell curve. It's a cliff with a long thin tail.
The bulk of live tracked accounts lose money. That's consistent with what regulated brokers must publish in the UK and EU, where risk warnings on most platforms state that a large majority of retail CFD accounts lose. Among the minority that are profitable at all, most cluster in the low single digits per month, and the equity curves are lumpy rather than smooth. Then there's a thin tail of accounts showing spectacular returns, and this is where reading skill matters, because that tail is mostly noise wearing a suit. Zoom in on a 40% month and you'll usually find one of three things: a martingale grid that hasn't met its dying volatility spike yet, a tiny account swinging huge risk, or a track record measured in weeks.
The tell is longevity. Filter any leaderboard to accounts with three or more years of history, real money, and drawdown under 30%, and the monthly averages collapse into a modest band, roughly 1% to 6% a month depending on how much pain the trader accepts along the way. The 40%-a-month accounts almost never survive into that filtered view. They're shooting stars, and the leaderboard is a photograph of the sky that keeps the streaks and forgets the darkness.
Since you'll likely end up reading these tracking pages yourself, a few practical pointers on what to look at once a record is in front of you. Check the "track record verified" and "trading privileges verified" flags first; an unverified page proves nothing beyond someone's ability to upload a statement. Look at the account's age against its trade count, because a two-month account with 400 trades is a scalping bot mid-audition, not a track record. Open the monthly analytics tab and read the losing months directly; if there are none across a year or more, scroll to the open trades, where you'll very often find a cellar of deep floating losses being warehoused so the closed-trade stats stay green. And glance at deposit history, since a curve that only rises because fresh money keeps arriving is a savings account with commission. Ten minutes of this beats any screenshot conversation you will ever have.
That filtered band is the truthful answer to what average managed forex account returns look like when someone competent and honest is at the wheel. Low single digits monthly, sustained, with visible losing months. Anything above it needs extraordinary evidence. Anything way above it needs a lawyer.
Why one month tells you nothing
Here's a scenario we see constantly. A prospective client compares two managers. Manager A returned 11% last month. Manager B returned 2%. The client picks A, because eleven is bigger than two. Three months later A has given back 25% and B is quietly up another 5%.
The client didn't make a maths error. He made a sampling error. A single month of trading contains maybe 15 to 40 trades, and with a decent strategy winning a little over half the time, the difference between a great month and a poor one is a handful of coin flips. Any honest strategy will produce a wide spread of monthly outcomes around its true average, purely by chance. A trader whose genuine edge is 3% a month will regularly print +9% months and -4% months without anything changing about their skill.
If you want to feel this rather than take it on faith, try a five-minute experiment we sometimes set sceptical clients. Take a coin and call heads a +1.5% trade and tails a -1% trade, which mimics a respectable strategy with a positive edge. Flip it twenty times and log the "month". Then do it again for eleven more months. You will almost certainly find at least one month that lost money and one that gained 8% or more, from an identical coin with an identical edge on every single flip. Nothing about the coin changed between the good month and the bad one. Nobody got smarter in March or lazier in June. Now imagine trying to rank two coins against each other off one month each, and you understand why picking managers by last month's number is closer to astrology than analysis.
Which means single months carry almost no information, in either direction. The 11% month doesn't prove Manager A is better; at that sample size it barely proves he was awake. And a losing month doesn't prove a manager has lost the plot. This cuts against every instinct you have, because monthly statements arrive monthly and beg to be judged monthly. Resist it.
What does carry information:
- Twelve months or more of results, including the losing ones, from the same strategy on the same account.
- The spread, not just the average. A manager averaging 3% with months between -3% and +8% is a different animal from one averaging 3% with months between -20% and +25%, even though the means match.
- Behaviour in a bad month. Did risk stay constant, or did position sizes suddenly double as someone chased the loss? The second pattern precedes most blow-ups we've ever witnessed.
There's an uncomfortable corollary for anyone selling performance, us included: our good months prove nothing either. When we have a strong run on the gold desk, it would be easy to screenshot it and let you draw the wrong inference. The only honest exhibit is the whole record, wins and losses in one place, which is why every closed signal we've ever issued sits publicly at /signals/history rather than in a highlights reel.
Return versus drawdown: the ratio that actually matters
Ask an amateur what a trader made and they'll quote a return. Ask a professional and they'll quote two numbers, because a return without its drawdown is a fraction missing its denominator.
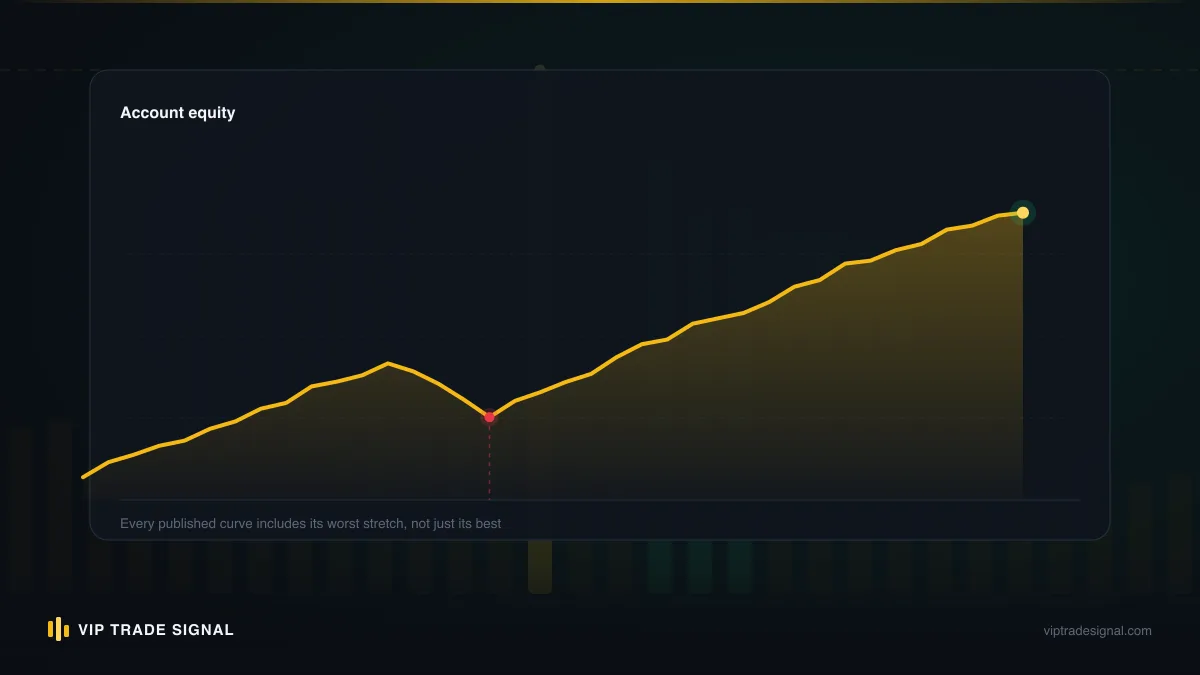
Drawdown is the peak-to-trough fall in the account along the way. It's the price paid for the return, and the same headline number can be bought cheaply or ruinously. A 30% year achieved with a maximum 10% drawdown is excellent work. A 30% year achieved through a 45% drawdown is a slow-motion accident that happened to end on an up-swing, and the next sequence of the same trades ends the account.
Divide annual return by maximum drawdown and you get a crude but wonderfully clarifying ratio. Above 2, you're looking at genuinely skilled risk control. Around 1, respectable. Below 0.5, the return is being rented from the risk of ruin, and eventually the landlord collects. Most of the flashy accounts in the previous section's thin tail sit far below 0.5; many are below 0.2, meaning a 60% drawdown lurking behind a 12% gain.
The ratio also explains why drawdown deserves more of your attention than return, mathematically and psychologically both. Mathematically, losses are asymmetric: a 50% drawdown needs a 100% gain to repair, which is why deep holes consume years. Psychologically, drawdown is what you actually live through. Nobody abandons a strategy during a good month. People abandon strategies, usually at the exact bottom, when the account is down 35% and every login hurts. A return you can't sit through is a return you won't collect.
So when you evaluate any performance claim, managed account pitches especially, make the second question about drawdown, and treat a refusal to answer as an answer. Our own approach on the account management desk is built around this: risk per trade is capped and agreed before we touch anything, precisely because the drawdown number is the one that decides whether a client is still there to enjoy year two. And since losses are the raw material of every drawdown, it's worth being plain: we have losing trades and losing stretches, every honest desk does, and anyone in this business who says otherwise has just failed the cheapest integrity test available.
What's achievable with strict risk limits
Time to put actual numbers on the table. Not promises. Arithmetic.
Take a disciplined setup: 1% of account risked per trade, a strategy averaging 1.5R per winner against 1R per loser, a win rate of 45%, and roughly 20 trades a month. Expected value per trade is 0.45 × 1.5R minus 0.55 × 1R, which is +0.125R, or about 0.125% of the account. Twenty trades makes roughly 2.5% in an average month. That's the whole magic trick. A modest edge, applied consistently, at survivable risk.
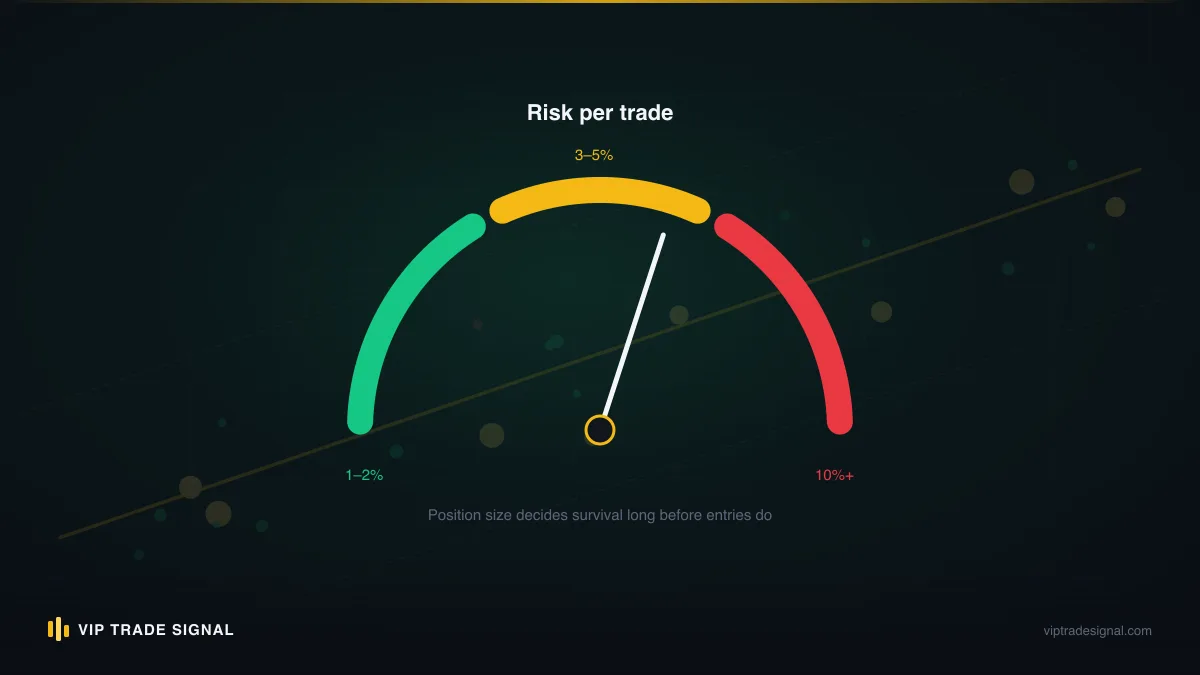
Turn the dials and you can see the entire honest range. Risk 0.5% per trade and the same edge produces about 1.25% monthly. Push risk to 2% per trade, the upper end of what we'd ever call defensible, and the average month runs near 5%, but your losing streaks now bite twice as hard: seven consecutive losers, which any 45% win-rate strategy will serve you eventually, digs a 13% hole instead of 7%. Push to 5% per trade chasing the advertised numbers and the same routine streak takes a third of the account. That's the trade-off the ads never mention. The dial that raises the average month is the same dial that deepens the worst one, and it turns much faster on the downside.
So when we say realistic monthly returns in forex run about 1% to 6% for skilled, risk-controlled trading, that band isn't a survey result or a vibe. It's what the arithmetic of survivable risk permits. Below it lives safety and slow compounding. Above it, increasingly, lives ruin wearing a good month as a disguise. And a genuinely good year assembled from that band, say 25-40% with drawdown held under 15%, is performance most professionals would shake your hand for.
One more honest wrinkle: edges breathe. Markets go quiet, strategies go cold, and a system that averaged 3% across two years will still deliver quarters that net roughly zero. Flat stretches aren't failure. They're the tax on being real.
Gold changes the texture, not the maths
We trade XAU/USD exclusively, so let's talk about what gold specifically does to return expectations, because it genuinely differs from majors like EUR/USD.
Gold moves. On an ordinary day it ranges more, in percentage terms, than most currency pairs manage in a good week. When risk sentiment lurches, when real yields jump, when a headline lands from a central bank or a warzone, gold can travel $40 in an hour. For a signal trader this is the attraction: wider daily ranges mean stops can sit at sensible technical levels while targets remain reachable within a session, and there's nearly always a tradeable move somewhere in the week.
What volatility does not do is repeal the previous section. A 1% risk cap on gold is still a 1% risk cap; the wider range simply means your stop is further away in dollars and your position is correspondingly smaller in lots. Volatility changes the texture of the months, not the honest average. Gold months tend to be streakier: clusters of strong trending weeks that flatter the curve, then choppy consolidations that chew small losses. The band stays the band. Anyone telling you gold's volatility makes 20% monthly reasonable has confused a bigger playground with a bigger edge.
Gold also has a session personality that shapes when the returns are earned. Asian hours tend towards drift and range; the real movement clusters around the London open, the US data window at 8:30 New York time, and Fed days, when a month's worth of range can print before lunch. In practice this means a gold trader's monthly return often arrives in four or five decisive sessions, with the rest of the month spent either flat or defending small positions. Say you're following a signal service through a quiet fortnight: nothing much closes, the account creeps sideways, and the temptation to force trades builds daily. Then non-farm payrolls lands, gold travels $55, and the month is made in an afternoon. Judged week by week that record looks erratic. Judged across quarters it's simply how this market pays: irregularly, in bursts, to whoever stayed disciplined through the boring parts.
There is one gold-specific trap worth naming: because the moves are large, oversizing punishes faster. The blown accounts we're shown most often are gold accounts, almost always with position sizes borrowed from someone's EUR/USD habits. Same lot size, four times the range, one bad Tuesday. If you take one operational rule from this article, make it this: size gold from the stop distance, never from the lot size you're used to.
How to vet a return claim in sixty seconds
You now have the background. Here's the compressed field version for the next time a performance claim lands in your inbox. Six checks, one minute.
- Compound it. Monthly claim to the twelfth power. If ten years of it produces comedy wealth, you're done. Close the tab.
- Demand the drawdown. No maximum drawdown figure means no risk control worth the name. A claimed return with no stated drawdown is half a fraction.
- Ask for length. Under twelve months of history is weather, not climate. Under three months is a coin mid-flip.
- Look for losses. A record with no red months isn't a great trader; it's a curated one, or a grid strategy storing its losses as floating drawdown for one future detonation.
- Check verification. Broker-verified tracking with real-money flags beats screenshots every single time. Screenshots cost nothing to fake and frequently are.
- Follow the incentive. Would this person plausibly need your money if the claim were true? A billionaire-in-waiting hunting $300 deposits is not a billionaire-in-waiting.
Most pitches fail four of the six inside the first minute. The rare ones that pass all six are worth a longer look, and the longer look is where you read the strategy, the fee structure, and the risk rules a legitimate manager should put in writing before any money moves.
Notice, too, what isn't on the list: the size of the return. A claim of 2.5% monthly can be a lie and a claim of 6% can be true. The number alone convicts nobody. It's the compounding test, the drawdown silence, and the missing losses that do the convicting.
Our own months, since we brought it up
It would be cowardly to write two thousand words about other people's claims and go quiet about ours, so: our record is mixed, publicly, on purpose.
Every signal we close, on the $99 service and for the partner-broker members alike, is posted at /signals/history with its entry, stop, target and result, and the reds sit right there next to the greens. We've had months we're proud of and months we'd rather not have printed, including losing streaks that tested exactly the discipline this article preaches. On the managed side we charge a flat 50% of realised profit with a $200 minimum advance, and the structure is deliberate: profit-share means a flat month pays us nearly nothing, which is precisely the incentive alignment you should demand from anyone touching your account. (It also means our fee sits at the high end of the industry's range; that's the trade for low minimums and pay-as-you-go, and we'd rather say so than have you discover it.)
What we won't publish is a projected monthly return, and now you know the reason it's missing. Any specific number we promised would be either dishonest or meaningless, because variance owns the short run and we don't control which months the market hands us. What we control is risk per trade, published results, and your ownership of your own account: master password and withdrawals stay with you, always. The FAQ covers the mechanics at /faq if you want the fine print, and if profits do come, remember they may be taxable depending on where you live; our piece on tax on managed forex profits covers the broad strokes.
Judge us the way this article taught you to judge everyone: on the full record, the drawdowns, and the incentives. If that standard ever embarrasses us, it should.
Build your own expectation: a ten-minute worksheet
Enough about everyone else's numbers. The point of all this is to replace the fantasy figure in your head with one you actually believe, so grab a pen. Five questions.
One: what's your real capital? Not the number you hope to have. The amount you can deposit today and genuinely afford to lose, because in leveraged trading that's a live possibility, not legal boilerplate. Write it down. Say it's $3,000.
Two: what monthly average will you assume? After everything above, pick from the honest band, and pick low if you're new to judging managers. Assume 2% monthly and you'll be planning around $60 a month on that $3,000. Feel the deflation of that number now, in ink, rather than in month three when it makes you reckless.
Three: what drawdown can you actually sit through? Not intellectually. Emotionally, at 2am, in month five. If seeing $3,000 become $2,400 would make you pull the plug, your ceiling is 20%, and that constrains which strategies and managers you can honestly hold. Most people discover their true number is about half what they claimed.
Four: how long before you judge? Commit, in writing, to a minimum evaluation window of twelve months, reviews quarterly, verdicts annually. This single line defends you from the sampling error that mis-ranks Manager A over Manager B.
Five: what makes the maths work anyway? Here's the quiet, unfashionable answer: contributions plus time. That $3,000 compounding at 2% monthly reaches about $3,800 in a year. Add $200 a month along the way and it passes $6,500. Keep both habits going for five years and the account is into five figures, built from a return the ads would sneer at. Compounding at honest rates is slow, then suddenly it isn't. The ads sell you year one of a fantasy; the worksheet is selling you year five of something real.
A closing thought on the worksheet itself. Its real product isn't the numbers; it's the contract with your future self. The version of you filling it in tonight is calm and rational. The version of you who'll need it is not: he's three months in, staring at a drawdown, or watching some channel post a 15% month while your account did 1.8%. Written expectations are how the calm version outvotes the panicked one. And if a manager or a service ever pressures you to abandon those written numbers, to "just this once" raise the risk or judge them on a hot fortnight, that pressure is itself the loudest red flag in this entire article, because a professional's interest and your written plan should never be in conflict.
The number that should actually excite you
Strip everything above down to one paragraph. Realistic monthly returns in forex, for skilled and risk-controlled trading, run somewhere between 1% and 6%, with losing months scattered through any honest record, and the professionals managing serious money would celebrate the top of that band as an annual figure. Anything pitched above it fails the compounding test, hides its drawdown, or hasn't lived long enough to fail yet.
Here's the reframe we'd leave you with. The tragedy of the 10%-monthly fantasy isn't just that people lose deposits chasing it, though they do, daily. It's that the fantasy makes the real number look like failure, so people who could have compounded patiently for a decade instead cycle through gurus, revenge-trade their losses, and exit the market entirely, convinced forex "doesn't work". The honest 3% month never got a chance to be enough.
So decide, before the next Lamborghini appears in your feed, which game you're playing. If it's the transformation lottery, no article can help, and at least now you know the odds. But if it's the long game, you have everything you need on this page: the honest band, the sixty-second vetting routine, the worksheet with your own numbers in it. Hold every service you meet to that standard. Hold us to it too; the record's public, reds and all, and we'd rather earn a sceptic slowly than a dreamer fast.
The realistic number is smaller than you hoped and better than you think. That's the whole secret. Everything else is a screenshot.