Somewhere on Telegram right now, a manager is showing a prospective client an equity curve that rises at a perfect forty-five degrees. No dips. No flat patches. Eleven months of green, a win rate of 94%, and a caption that says something like "consistency is our religion." The client is going to send him $8,000 by the end of the week.
That curve is almost certainly a martingale, and that account is almost certainly going to zero. Not might. Will. The only question is timing.
This article is about the martingale strategy risk managed accounts carry more often than any other single danger: why doubling into losing positions produces exactly the kind of beautiful track record that sells management services, why the maths guarantees an eventual detonation, and the specific fingerprints you can find in a track record in about three minutes that expose the whole thing before you hand anyone a password. We run a managed-account service ourselves, so we have skin in this argument. We also spend a depressing amount of time talking to people who arrive at our drawdown management desk after someone else's smooth curve went vertical in the wrong direction. Most of those stories start the same way.
The seductive pitch: a curve that never dips
Put yourself in the shoes of someone shopping for an account manager. You've got, say, $10,000 you'd like to grow. You look at two track records.
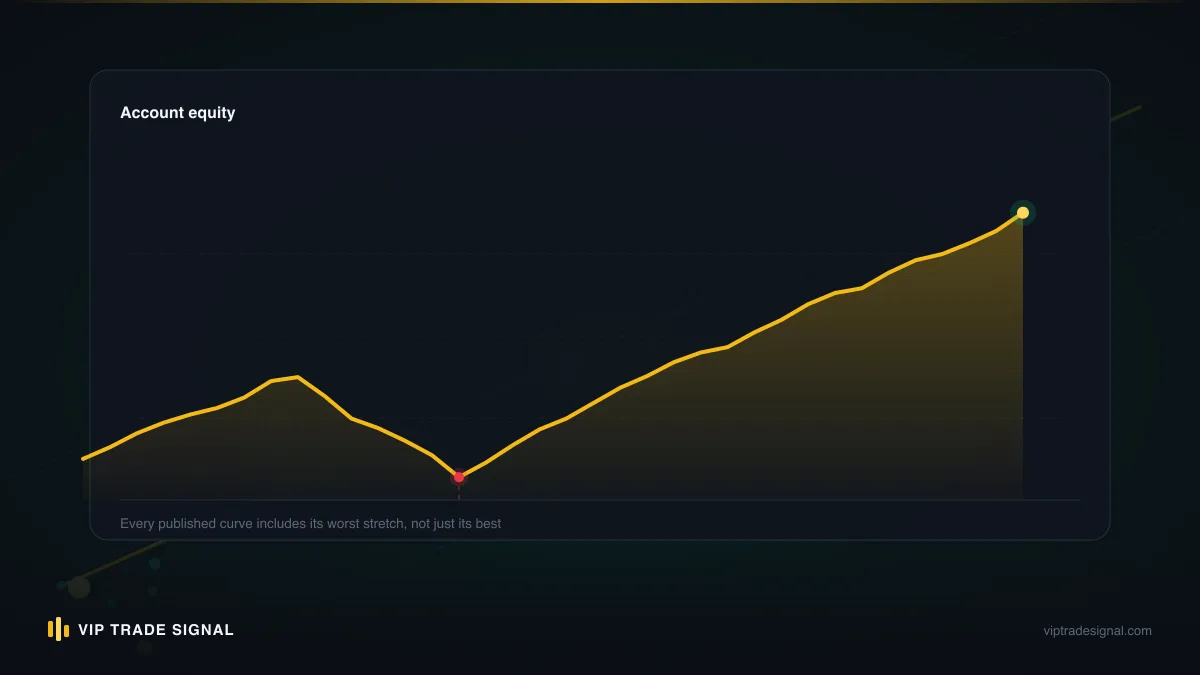
Manager A shows fourteen months of trading. The curve climbs, but it's ugly: there's a 12% drawdown in March, a flat stretch through the summer, two losing months out of fourteen. Net result: up 31%.
Manager B shows fourteen months as well. The curve is a staircase to heaven. Every week closes green. Largest visible dip: about 1.5%. Net result: up 68%.
Nearly everyone picks Manager B. It feels obvious. Higher return, lower apparent risk, more "consistency". Every metric your eye can grab says B is the better trader. And that instinct, which is completely natural, is precisely the vulnerability the martingale crowd farms for a living. Because Manager A's ugliness is what real trading looks like when losses are taken honestly, and Manager B's beauty is what it looks like when losses are being warehoused instead of taken.
Here is the single most useful sentence in this entire article, so we'll give it its own line:
A smooth equity curve doesn't tell you a trader has no losses. It tells you the losses haven't been allowed to show up yet.
Risk never disappears in trading. It can only be realised now, in small visible pieces, or deferred and compounded into one enormous invisible piece. The smooth curve is the second option wearing the first option's clothes.
How martingale actually works
The name comes from an eighteenth-century betting system: double your stake after every loss, so that when you eventually win, the win covers all the previous losses plus one original stake of profit. Lose 1, lose 2, lose 4, win 8, and you're up 1. Casinos have known about it for two hundred years, which is why tables have maximum bets.
In forex and gold, the translation goes like this. The manager sells XAU/USD at 3,340 with 0.10 lots. Price goes against him, up to 3,352. Instead of taking the loss, he sells again, 0.20 lots at 3,352. Price keeps rising to 3,364. He sells 0.40 lots. Now his average entry is much closer to the current price, so it only takes a modest pullback for the whole basket to come back to breakeven and a little beyond. Price dips $8, he closes everything, and the account statement shows a tidy profit. Another green trade. The curve ticks up.
Notice what the statement doesn't show. It doesn't show that at the worst moment, the account was floating a loss several times larger than the eventual booked profit. It doesn't show that the position size had grown seven-fold from the original stake. It doesn't show that if gold had run $60 against him instead of $30 (which gold does, regularly, sometimes in an afternoon), the doubling sequence would have hit margin call territory before any pullback arrived.
Martingale works, in the sense of printing green trades, for exactly as long as price eventually comes back. In a ranging market that's most of the time, which is why these accounts can run for months or even a couple of years looking flawless. The strategy is a machine for converting tail risk into small frequent wins. Small frequent wins are what humans read as skill.
And to be fair for a moment: averaging into a position isn't inherently evil. Plenty of legitimate traders scale into trades with pre-planned tranches and a hard stop on the whole basket. The difference between scaling and martingale isn't the second entry. It's the absence of any point at which the trader will accept the loss. A scaler has a level where the idea is wrong and everything closes red. A martingale trader has decided, structurally, that he is never wrong, only early. Markets eventually charge full price for that belief.
The maths of inevitable ruin
People sometimes push back here. "Fine, it's risky, but if he's managed it for two years, maybe he knows what he's doing." So let's put actual numbers on why two good years mean almost nothing.
Take a modest martingale: initial position 0.10 lots on gold, doubling every $12 of adverse movement, on a $10,000 account. Walk the sequence:
| Step | Lots added | Total lots | Adverse move so far | Approx. floating loss |
|---|---|---|---|---|
| 1 | 0.10 | 0.10 | $0 | $0 |
| 2 | 0.20 | 0.30 | $12 | ~$120 |
| 3 | 0.40 | 0.70 | $24 | ~$480 |
| 4 | 0.80 | 1.50 | $36 | ~$1,240 |
| 5 | 1.60 | 3.10 | $48 | ~$2,680 |
| 6 | 3.20 | 6.30 | $60 | ~$5,340 |
| 7 | 6.40 | 12.70 | $72 | ~$9,900 |
Seven steps. A $72 adverse move in gold, less than 2.5% from a starting price of 3,340, and the $10,000 account is effectively gone, because floating losses have consumed the equity and the margin requirement on 12.7 lots has long since triggered a stop-out. Gold has moved $72 in a single London session more times this year than we can count. It moved more than that in an hour on some news days.
The manager doesn't need to be unlucky for two years. He needs to be unlucky once. And the probability of "once" over any long horizon isn't small. It's certain. If each doubling cycle has, say, a 2% chance of meeting the fatal streak, the account survives one cycle with 98% probability. Run a cycle a week for two years and the survival probability is 0.98 to the power of 104, which is about 12%. Roughly seven out of eight such accounts are dead within two years, and the eighth is just waiting. Those aren't fabricated performance stats, to be clear; it's arithmetic on an illustrative assumption, and you can rerun it with any per-cycle risk you like. The shape of the answer doesn't change. Deferred risk compounds until it's realised.
There's a cruel wrinkle, too. The longer a martingale survives, the larger the account grows, and the larger the account, the bigger the base lot size the manager uses, so the eventual blow-up destroys the peak balance, not the starting one. Investors who joined late, seduced by the longest and smoothest version of the curve, lose the most. The track record is at its most convincing at the exact moment it's most dangerous. Think about what that does to the usual advice of "look for a long history."
Grid trading: martingale's respectable-looking cousin
Say "martingale" to a manager running one and he'll usually deny it. "We don't martingale. We run a grid system." This is a distinction worth understanding, because grids are the polite face of the same underlying risk, and grid trading risk gets waved through by people who would have run from the M-word.
A grid places orders at fixed intervals: buy every $10 down, for instance, sometimes with sells layered every $10 up as well. Positions might be equal-sized rather than doubled, which sounds much more sensible. Some grids genuinely are more conservative than a raw martingale.
But look at what the account is actually doing when the market trends. A buy grid in a falling market accumulates position after position, every one of them underwater, all of them held. Equal sizing slows the bleeding compared to doubling, but the exposure still stacks in a straight line against a move that may not stop. Ten grid levels down, the account holds ten losing longs and the drawdown is growing with every tick. There's still no stop. There's still the same core decision hiding in the machinery: we do not take losses, we hold them until price returns.
The tell is the same as with martingale, just stretched over a longer fuse. Grid accounts show beautiful closed-profit histories through ranging markets (gold chopping between 3,300 and 3,380 is a grid's paradise), and then one sustained trend arrives, the kind that runs 300 dollars without a meaningful pullback, and the account that survived two years of chop is gone in three weeks. If you were watching gold in the big trending phases of recent years, you saw exactly the sort of move that clears out every grid in its path. The graveyard of "gold grid EA" accounts on the public tracking sites is genuinely instructive viewing, in the way motorway pile-up footage is instructive for new drivers.
So when a manager says "grid, not martingale," the honest translation is usually "same risk, slower burn." The question that matters is never which label the strategy wears. It's: is there a point where losses get realised, and is position size capped regardless of how wrong the last trade was? If the answers are no and no, you're looking at the same animal.
The hybrid versions deserve a mention too, because they're increasingly common and they're built to defeat exactly the checks in this article. Grid-with-martingale-sizing (levels at fixed intervals, but each level bigger than the last) combines the worst of both parents. "Hedged" grids run buy and sell grids simultaneously and describe the offsetting positions as protection. In reality the account pays spread and swap on both sides while the net exposure still balloons whenever price trends, and the "hedge" gets quietly lifted at the worst possible moment because a fully hedged book makes no money. And then there are the recovery-zone systems, which respond to a losing long by opening a larger short below it, then a larger long above that, ping-ponging with growing size until one side finally escapes the zone. Every one of these has a slick PDF and a backtest that starts the day after the last big trend ended. Every one of them dies to the same weather.
A quick story about a trader we'll call Sam
To make this concrete, here's a composite of a conversation we've had more times than we'd like; call him Sam, because everyone in these stories is called Sam. Sam found a gold manager through a YouTube review in the spring. The Myfxbook was verified, eleven months old, 94% win rate, 6-9% a month like clockwork. Sam started with $3,000 as a test. Three months later it was $3,600, every week green, and Sam did the thing the whole machine is designed to make you do: he stopped testing and sent the rest, $17,000, most of a redundancy payment.
Two months after that, gold caught a bid and ran hard in one direction for the better part of three weeks. Sam's dashboard did something new: the balance number stayed frozen while a second number he'd never paid attention to, equity, sank through 70%, then 50%, then 30% of balance. He messaged the manager and got back a calm essay about how the system had survived worse and "closing now would turn a temporary drawdown into a permanent loss." That line, by the way, is the martingale liturgy. It's technically true right up until the stop-out makes it permanently false.
Sam's account stopped out on a Tuesday morning at around 8% of its peak value. The manager's channel posted nothing for two days, then reopened with a fresh account, a new smooth curve, and a promotion for new depositors. Total time from Sam's first deposit to detonation: a little over five months, of which the manager was paid performance fees for four. Nothing about this story is exotic. It is the median outcome of the median smooth-curve pitch, and the only unusual detail is that Sam had investor access and watched it happen live. Most clients just get the frozen dashboard and then the silence.
Why these strategies dominate scam managed accounts
Here's the uncomfortable structural truth about the managed-account world: martingale isn't popular with dodgy managers despite its blow-up risk. It's popular because of the profile that risk creates. The incentives line up almost perfectly.
First, the marketing writes itself. A martingale track record is the best-looking sales document in retail trading: high win rate, smooth curve, steady monthly gains. An honest trend-following record, with its 45% win rate and multi-month drawdowns, is a hard sell to anyone who hasn't traded. Guess which one fills a Telegram channel with deposits.
Second, the fee structures are asymmetric. Most managers charge a percentage of profits, harvested monthly. A martingale generates bookable profits every month right up until the end. The manager collects fees on all of it. When the blow-up comes, the client eats 100% of the destruction while the manager keeps every fee already paid. Heads he wins, tails you lose — and he's already been paid for two years of heads. Some of the worst offenders run dozens of client accounts simultaneously, knowing full well a portion will detonate each year; the surviving accounts become next year's marketing.
Third, and this is the part people underestimate: plenty of martingale managers aren't even conscious scammers. They're true believers. They found an EA on a forum, backtested it over a conveniently rangy two years, watched it print, and genuinely think they've found the machine. Their sincerity makes them more convincing, not less dangerous. The market doesn't care whether the person doubling into a losing gold short is a cynic or a convert.
We'd say the majority of "too good to be true" managed-account offers you'll encounter are running some flavour of this, and the reason we can be blunt about it is that we sit on the other side of the trade-off ourselves. Our own management service takes visible losses, which makes our history less pretty and easier to defend. Every closed signal we've issued sits publicly at /signals/history, reds included, precisely because a record with no reds on it is a record telling you something is being hidden.
Martingale strategy risk in managed accounts: the three fingerprints
Enough theory. You're evaluating a manager, you've got their track record in front of you: a Myfxbook page, an FXBlue link, or a raw MT4/MT5 statement. What exposes a martingale before your money is in it? Three fingerprints, and any one of them alone is enough to walk away. Together they're a signed confession.
Fingerprint 1: win rates above 90%
Real traders lose a lot. A good discretionary trader might win 50-60% of trades; a good trend follower often wins less than half and makes it up on the size of the winners. There are legitimate high-win-rate styles (some scalpers, some mean-reversion approaches), but they live in the 70s, maybe brushing 80% in a friendly year, and their losers are visibly larger than their winners when they come.
A win rate of 92%, 95%, 97% is not a sign of skill. It's a sign of a strategy structurally designed never to book a loss. The only reliable ways to get there are martingale, grid, or holding losers indefinitely: three doors into the same room. Pair the win rate with the average-win versus average-loss figures and the picture sharpens: a martingale record typically shows lots of small wins and a handful of losses that are enormous when they finally appear, or no losses at all if the record is young enough that the first bomb hasn't gone off.
When someone shows you 95% and calls it consistency, hear it as what it is: "I have not yet had my losing streak." Yet is the operative word.
A useful cross-check here is the risk-reward shape implied by the numbers. Expectancy is win rate times average win, minus loss rate times average loss. A 95% win rate with an average win of $40 and an average loss of $900 has an expectancy of roughly negative $7 per trade before the blow-up is even counted. The record only looks profitable because the big losses are rare enough not to have landed yet, or landed once and been buried at the start of a conveniently cropped date range. Always drag the history window back to the account's first trade. A surprising number of "eleven months of perfection" records start eleven months and one week after a margin call.
Fingerprint 2: lot size escalation in the history
This one takes two minutes and catches nearly everyone, because the trade history can't lie about position sizes without being wholesale forged. Open the closed-trade list and read the lots column against the entry times.
An honest fixed-risk trader shows position sizes that are roughly stable, drifting up slowly as the account grows. A martingale shows a heartbeat pattern you cannot miss once you know to look: clusters of trades in the same instrument, same direction, minutes or hours apart, with sizes stepping up (0.10, 0.20, 0.40, 0.80), all closing at nearly the same moment for a combined small profit. Sometimes it's disguised with irregular multipliers, 0.10 then 0.25 then 0.55, but the shape survives: escalating size into an adverse move, basket closed together.
Grids show the sibling pattern: equal sizes, entries spaced at suspiciously even price intervals, long strings of same-direction positions opened as price moved one way. Either way, the history is the strategy's fingerprint card. Managers can write anything they like in the marketing; the lots column doesn't do adjectives.
Fingerprint 3: floating drawdown diverging from closed profit
The closed-trade record shows booked results. The equity line shows booked results plus the open positions, marked to market. On an honest account, balance and equity dance closely together, because losses get realised rather than warehoused. On a martingale or grid account, they diverge. The balance line climbs its serene staircase while the equity line periodically plunges below it as baskets of underwater positions build, then snaps back up when the basket finally closes green.
Those plunges are the truth leaking out. If the balance shows +4% for the month but the equity dipped 35% below balance mid-month, the real risk taken to earn that 4% was a 35% drawdown that simply happened not to reach the fatal level this time. A manager quoting "maximum drawdown 3%" from closed trades, while the equity chart shows canyon-shaped excursions, is quoting the height of the iceberg's tip.
Ask any manager one simple question: what was the account's worst equity drawdown, not balance drawdown? An honest answer that matches the chart is a good sign. A blank pause, a deflection, or "we don't really track that" ends the conversation.
Detecting it on Myfxbook in three clicks
Public tracking sites make this genuinely fast, provided the account is verified. And if a manager can't or won't give you a verified tracking link or investor-password access to view a live account, that's the end of the road before it starts. (Investor access, importantly, is read-only; if you're fuzzy on the difference it's worth reading our piece on investor versus master passwords before you evaluate anyone.)
Assuming you've got a Myfxbook or similar page in front of you, here's the three-click audit:
- Click one: the growth chart, with equity turned on. By default many people only look at balance/growth. Toggle the equity overlay. You're hunting for the divergence from Fingerprint 3: a smooth balance line with an equity line that periodically falls off a cliff beneath it. Also check the "drawdown" stat and whether it's calculated on equity. Anything above roughly 30% equity drawdown to produce single-digit monthly returns is a bomb with a long wick.
- Click two: the trade history tab, sorted by close time. Scan for the heartbeat: same symbol, same direction, escalating or evenly-spaced entries, basket-closed together. Ten seconds of scrolling usually settles it. While you're there, look at trade durations; martingale baskets often show one trade held for days (the original loser) alongside additions held for hours, all closing at once.
- Click three: the statistics panel. Win rate above 90%? Average loss several multiples of average win? Profit factor that looks miraculous over a short window? Each is corroboration. None of them alone convicts (a tiny sample can produce odd stats honestly), but stacked on top of clicks one and two, you're done.
One caution: check the account is verified on both track record and trading privileges, and check the history length covers at least one nasty trending period in the traded instrument. A gold account that only spans a rangebound stretch has never sat its real exam. And be aware that some managers show you a curated account while running client money differently, which is why the ultimate protection isn't the tracking site at all, it's structural: your money in your own account, with you holding the keys. We've written elsewhere about how a properly structured MT4/MT5 management arrangement keeps custody with the client, and why pooled structures demand far more diligence; the PAMM model in particular concentrates exactly this risk when the master account is running a grid.
What professional loss-taking looks like instead
It's worth spelling out the alternative, because after enough exposure to smooth-curve marketing, honest track records start to look broken to the untrained eye. They aren't. They're what solvency looks like.
A professionally risk-managed account has a few unglamorous features. Every position carries a stop-loss from the moment it's opened: not a mental stop, an actual order on the server. Risk per trade is capped as a fixed slice of equity, commonly 0.5% to 2%, so a $10,000 account risks perhaps $50 to $200 per idea and position size is derived from the stop distance rather than from how annoyed the manager is about the last loss. Losing trades close at the stop and appear in the record as what they are. Losing streaks happen (five, seven, occasionally ten in a row, because that's what a 50% win rate serves up over hundreds of trades), and the account survives them trivially because seven losses at 1% is a 7% drawdown, not a margin call.
The resulting curve is jagged. It has drawdowns you can see, usually somewhere between 5% and 20% at the worst, and flat months, and the occasional losing quarter. In exchange, it has the one property the smooth curve can never have: no single market move can kill it. The maximum damage of any trade is known before entry. That's the entire trade-off in one line — visible small pain, purchased as insurance against invisible total ruin.
Run the two approaches side by side through the same hostile fortnight and the difference stops being philosophical. Gold trends $250 against the prevailing positioning. The fixed-risk account takes three stopped-out trades at 1% each, sits flat for a few days, then catches part of the move in the other direction; the month closes somewhere between -3% and +2% and nobody remembers it a year later. The martingale account, over that same fortnight, adds and adds and adds, floats a drawdown that swallows two years of booked gains, and either gets rescued by a pullback that lets the manager post "another green month" (resetting the trap with a bigger account and bigger base lots) or doesn't, and posts nothing ever again. One of these is a business. The other is a queue for a cliff edge, and the only variable is your position in the queue.
The professional version also behaves differently between trades, which you can see in a history if you look. Position sizes shrink after losing streaks rather than grow, because risk is a percentage of a now-smaller equity. Trades in the same instrument and direction don't stack: a second entry only appears after the first is closed or its stop moved to breakeven. Losing days are followed by normal-sized trading, not by revenge-sized trading. Boring, all of it. Boring is the point. If a track record makes your pulse quicken, someone has designed it to.
This is also, frankly, why honest services have a harder marketing job and why the fee conversation matters. Our own account management runs on realised profit only (a flat 50% of what's actually banked, with the client keeping the master password and full withdrawal control), which means warehousing floating losses does nothing for us; a floating "profit" that hasn't closed pays nobody. Fee structures that only pay on realised results, measured after losses, at least point the manager's incentives the right way. Fees on paper gains, or fixed fees plus profit share harvested monthly, point them toward the staircase-and-lift-shaft pattern. It's high risk either way, since gold will happily hand a disciplined trader a losing month, but one structure survives its losing months and the other eventually doesn't.
Questions that make a martingale manager squirm
If you take one practical tool from this piece, take this list. Ask these before any money moves, ideally in writing, and pay as much attention to how they're answered as to what's said. Evasion is data.
- "What was the worst equity drawdown, not balance drawdown, in the last twelve months, and can you show me it on the chart?" The single best question in the industry. Honest managers know the number to the decimal because it kept them up at night.
- "Does every position have a hard stop-loss on the server at entry? What's the maximum loss on any single trade idea, in percent?" "We manage risk dynamically" is a no. "Our system doesn't need stops because it always recovers" is a sprint-for-the-exit no.
- "Do you ever add to a losing position? If so, what's the maximum number of additions and the maximum total exposure?" Watch for the flinch. Legitimate scalers answer instantly with hard caps. Martingale operators either deny it (check the history) or explain why their averaging is different (it isn't).
- "Can I see the full closed-trade history with lot sizes, and a verified tracking link?" Refusal, "confidentiality," or screenshots-only ends the process.
- "What happens in a 300-dollar one-directional move in gold with no pullback? Walk me through the account's state." Honest answer: "We'd be stopped out of one or two trades for a 1-2% loss each." Martingale answer: some version of "that basically never happens." It happens.
- "Do you keep the master password or do I?" Not a strategy question, but it decides who controls the damage when you spot the fingerprints late. You should hold the master; the manager trades on limited access.
A manager who answers all six cleanly, with numbers, isn't guaranteed to be good. But a manager who fumbles any of them has told you what the smooth curve was hiding, and told you for free. There are a few more of these diligence questions, on fees and custody, answered plainly on our FAQ if you want the fuller checklist.
Where this leaves you
The martingale problem isn't really a strategy problem. It's a perception problem. Every incentive in the managed-account market (marketing, fees, human psychology) rewards the trader who hides losses over the trader who takes them, right up until the hidden losses arrive all at once. The market pays that invoice eventually, with interest, and it addresses it to the client.
So invert your instincts. When a track record looks too clean, treat the cleanliness itself as the red flag, and go hunting for where the risk is hiding, because it is hiding somewhere, and now you know the three places to look: the win rate, the lots column, and the gap between balance and equity. Three clicks, five minutes, and most of the industry's future blow-ups disqualify themselves before they can touch your money.
And if you're currently invested with a manager and this article has given you a cold feeling in your stomach (the 95% win rate you were proud of, the baskets of trades you never quite examined), don't wait for the vertical line. Log in with your investor access tonight, pull the history, and run the audit. If the fingerprints are there, the mature move is to withdraw while the staircase is still climbing, however painful it feels to leave the party early. Accounts already deep in floating drawdown are a harder conversation, and one we have most weeks on the drawdown management side; sometimes salvageable with a slow, honest de-risking plan, never with guarantees, because nobody honest guarantees recovery.
A jagged curve that survives beats a smooth curve that doesn't. Twenty years of blown accounts say so. Choose your managers, and your own trading, accordingly.