Five straight losses. You've checked the strategy twice, re-read your journal, stared at the last two stop-outs wondering whether the market has quietly changed underneath you. It hasn't, probably. What you're feeling is the gap between what probability actually does and what your brain insists it should do.
Here is the number that reframes the whole thing: a strategy with a genuine 60% win rate will begin a five-trade losing streak forex traders would call "brutal" roughly once every hundred trades. Not once in a career. Once every hundred trades. If you take three trades a day, that's roughly once every seven weeks, forever, for as long as you trade that system. The streak isn't a malfunction. It's a scheduled feature that nobody put in the brochure.
And yet almost every blown account we've ever seen up close died during a streak. Not because the streak itself was fatal, the arithmetic of a normal run of losses at sensible risk is survivable by design, but because of what the trader did in the middle of it. Doubled size. Dropped the stop. Took revenge trades at 2am on a pair they'd never studied. The streak sets the table; the trader serves the meal. So let's lay the maths of losing runs out properly: how long they get, what they cost at different risk sizes, how to tell normal variance from a dead edge, and what to actually do while you're inside one.
Five losses in a row is not a broken strategy
Start with the coin. A fair coin flipped 100 times will, more often than not, produce a run of six or seven heads somewhere in the sequence. Ask people to write down a "random-looking" series of flips and they almost never include a run that long, because our intuition thinks randomness means alternation. Real randomness clumps. It streaks. It goes quiet for thirty flips and then hands you eight tails while you sit there questioning the coin.
Your trading strategy is a weighted coin. If it wins 55% of the time, every trade is a flip that lands against you 45% of the time, and those 45% outcomes are under no obligation to spread themselves out politely. They arrive in clusters because that is what independent events do.
Here's the calculation for any given starting point. The chance the next trade loses is your loss rate. The chance the next five all lose is the loss rate multiplied by itself five times. At 60% wins, that's 0.4 × 0.4 × 0.4 × 0.4 × 0.4, which comes out at about 1%. So each individual trade has roughly a one-in-a-hundred chance of kicking off a five-loss run. String a hundred trades together and you should more or less expect one. Take a thousand trades, which a moderately active trader manages inside two years, and five-loss runs stop being events at all. They're weather.
The mistake almost everyone makes is judging the streak in isolation. "What are the odds of five losses in a row?" sounds damning at 1%. But that's the wrong question. The right question is "what are the odds of at least one five-loss run somewhere in my next few hundred trades?" and the answer to that one is close to certain. You will meet this streak. The only open questions are when, and how big your positions are when it arrives.
There's a name for the mental error at work here: gambler's fallacy, the belief that four losses make a fifth less likely because the wins are somehow "due". The market keeps no such ledger. Trade five knows nothing about trades one through four. If your edge is real, each new trade carries the same 60% chance it always did, no more, no less, regardless of how the last week felt.
How long a losing streak forex traders should actually expect
Let's put numbers on it properly, because the vague reassurance that "streaks happen" is useless when you're seven down and shaking. The table below shows, for a range of win rates, the chance that any given trade starts a five-loss run, and the longest streak you should expect to see somewhere in samples of 100 and 1,000 trades.
| Win rate | Chance any trade starts a 5-loss run | Expected worst streak in 100 trades | Expected worst streak in 1,000 trades |
|---|---|---|---|
| 70% | ~0.2% | 4 | 6 |
| 60% | ~1.0% | 5 | 8 |
| 55% | ~1.8% | 6 | 9 |
| 50% | ~3.1% | 7 | 10 |
| 45% | ~5.0% | 8 | 12 |
| 40% | ~7.8% | 9 | 14 |
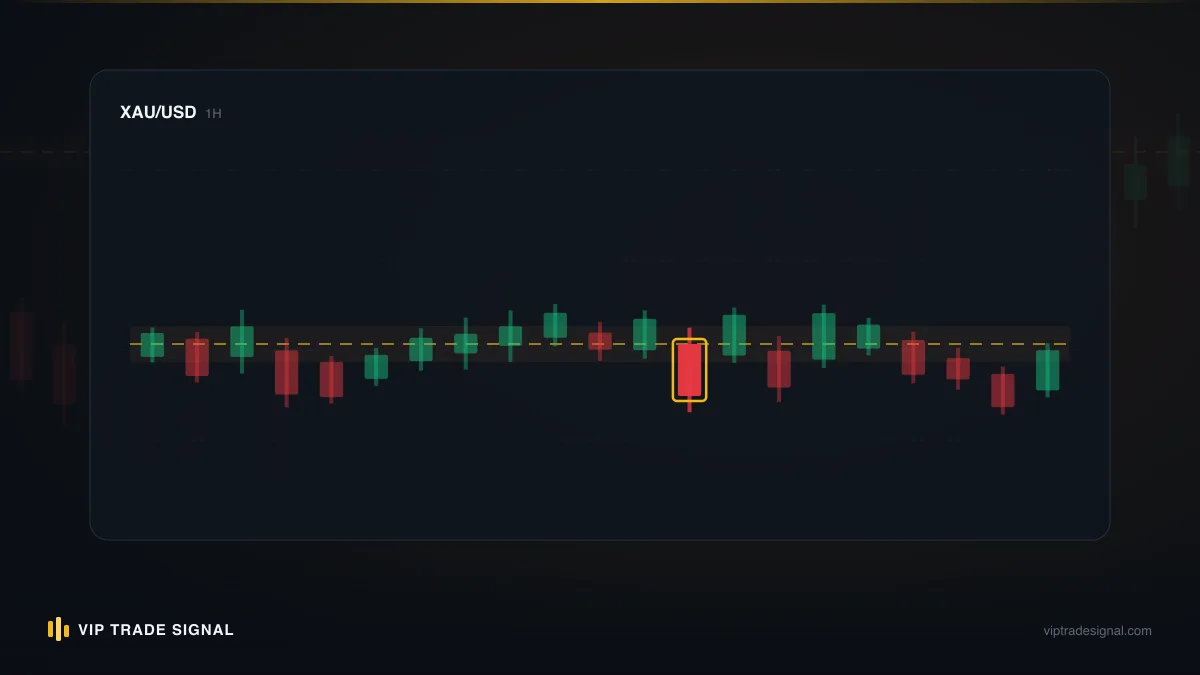
Read the right-hand column and let it sink in. A 50% win-rate trader, which describes a lot of perfectly viable trend-following approaches that make their money on reward-to-risk rather than accuracy, should expect a ten-trade losing streak at some point in their first thousand trades. Ten. In a row. With nothing wrong.
Two things jump out of this table. First, streak length grows as win rate falls, but not as violently as people fear; the difference between a 60% system and a 50% system over a thousand trades is eight losses versus ten. Second, and more usefully, streak length grows with sample size and never stops. Trade for ten years and your worst run will be longer than anything in this table, because you'll have taken enough trades to sample the deep tail. The traders who last aren't the ones who avoid the tail. They're the ones sized so the tail is an annoyance instead of an obituary.
A word of honesty about these figures: they assume your trades are independent and your win rate is genuinely what you think it is. Real trading is messier. Correlated positions (three gold longs open at once are close to one big trade, not three), regime shifts, and the universal tendency to overestimate one's own win rate all push real-world streaks longer than the clean maths suggests. Treat the table as the optimistic floor, not the ceiling. If it says expect eight, build for eleven.
And notice what the table quietly tells you about anyone advertising a signal service with a "92% win rate" and no visible losing trades: either the streaks are being hidden, or the wins are tiny and the rare losses are enormous. Usually both. It's one reason we publish every closed signal, the losing runs included, at /signals/history, because a track record without its streaks is a story, not a record.
From streak to drawdown: what each run costs at 1%, 3% and 5%
A streak is only a number until you multiply it by your risk per trade. Then it becomes a drawdown, and drawdowns are where accounts actually die. The arithmetic is simple and worth doing slowly.
Risk 1% per trade and lose eight straight, compounding down as the account shrinks, and you're off roughly 7.7%. Uncomfortable. Recoverable with an 8.4% gain, which a working strategy produces without heroics. Risk 3% and the same eight losses cost you about 21.6%, which now needs a 27.6% gain just to get back to flat. Risk 5% and eight losses take nearly 34% of the account, demanding a 51% recovery. Same strategy, same streak, wildly different situations, and the only variable that changed was position size.
| Losses in a row | At 1% risk | At 3% risk | At 5% risk |
|---|---|---|---|
| 5 | −4.9% | −14.1% | −22.6% |
| 8 | −7.7% | −21.6% | −33.7% |
| 10 | −9.6% | −26.3% | −40.1% |
| Gain needed after 10 | +10.6% | +35.7% | +67.0% |
That last row is the one to stare at. Drawdown and recovery are not symmetrical. Lose 10% and you need 10.6% to get home; lose 40% and you need 67%. The hole deepens faster than the ladder out of it grows, which is why the trader risking 5% isn't merely "more aggressive" than the trader risking 1%. They are playing a structurally different game, one where a statistically ordinary run of losses forces them to nearly double their remaining capital just to break even. On a $2,000 account at 1% risk, each loss costs about $20 and a ten-loss streak leaves you around $1,808. Annoying. At 5%, each early loss is $100 and the same streak leaves roughly $1,197, and now every subsequent decision is made by someone trying to win back $800 rather than someone executing a plan.
Push the risk higher still and the streak stops producing drawdown and starts producing margin calls. A trader running oversized gold positions into a ten-loss run doesn't get the luxury of deciding when to stop; the broker decides, and if you've never worked through exactly how that unwinds, the mechanics are laid out in our piece on margin call versus stop out. The short version: the streak doesn't need to take your account to zero. It only needs to take your free margin there.
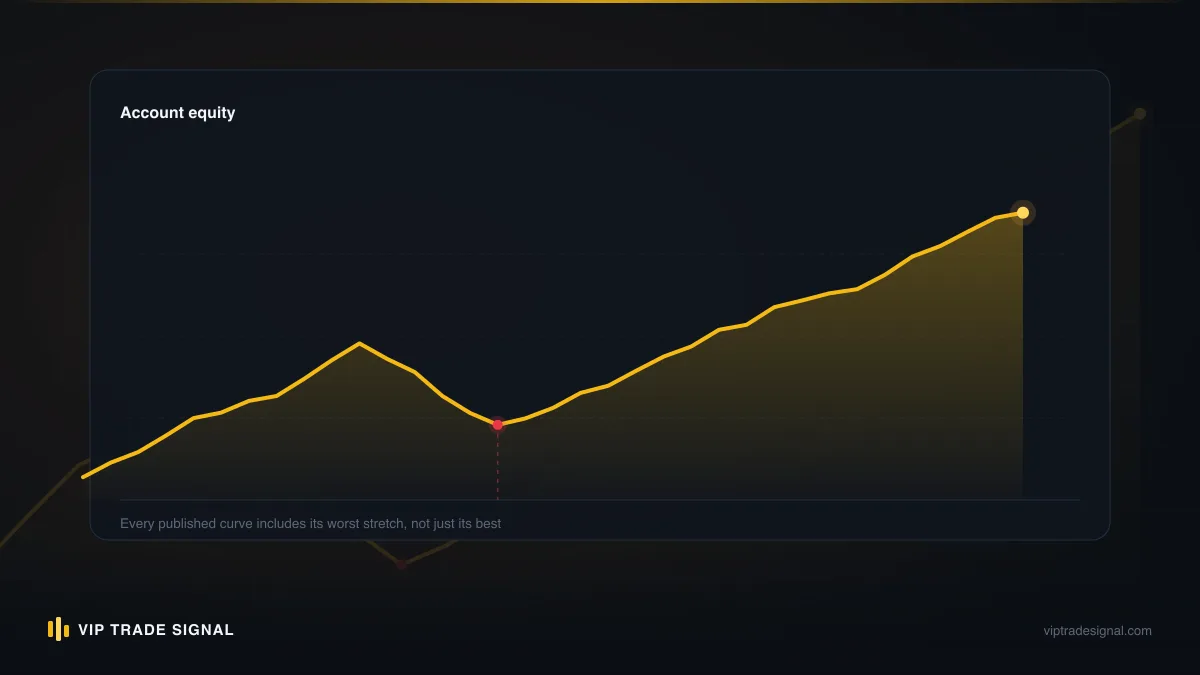
The lesson compresses to one sentence. Your worst realistic streak, multiplied by your risk per trade, must land somewhere you can live with, and if it doesn't, no amount of psychology, discipline or motivational content fixes it, because the problem was never in your head. It was in your position size.
Why your brain reads variance as catastrophe
Knowing the maths and feeling the maths are different skills. You can recite the streak table from memory and still find that loss number six lands in your stomach like a verdict. It helps to know why.
Loss aversion is the headline act. Decades of behavioural research put the sting of a loss at roughly twice the pleasure of an equivalent gain, which means a 60% win-rate strategy, mathematically profitable, can feel emotionally like a losing one. Six wins and four losses in a set of ten nets out positive on the account and negative in the gut. Now run the losses consecutively and the effect compounds; each one arrives carrying the weight of the ones before it, and by the fifth your nervous system has stopped doing probability and started doing threat detection.
Then there's recency bias, the tendency to weight the last few outcomes far above the long run. Three hundred trades of profitable history evaporate from consideration; the only data that feels real is the last five red entries in the journal. Your brain evolved to treat recent bad events as urgent signals about the immediate future, which was excellent for avoiding predators and is terrible for evaluating a trading system mid-streak.
And underneath both sits the pattern-hunger. Humans are meaning-making machines. Five random losses cannot simply be five random losses; there must be a cause, a lesson, a change in the market that explains them, and so we go hunting. Sometimes we find a real problem. Far more often we find a phantom, "fix" a strategy that wasn't broken, and in doing so break it, abandoning a working edge two trades before its recovery run. Ask around any trading community and you'll hear the same confession over and over: the system was fine, I just couldn't sit through the losses it was always going to produce.
It gets worse when other people can see the account. A streak endured privately is arithmetic; a streak endured in front of a spouse who asked whether this trading thing is really working, or a mate you once showed a winning month to, is a referendum on your judgement, and people fight referendums differently from how they manage risk. Some of the ugliest decisions we've watched were made not to recover money but to avoid a conversation. If that's you, say so in your journal. Naming the pressure is half of defusing it, and the other half is remembering that the person you're performing for would rather see a small intact account than hear a confident story about a large vanished one.
None of this makes you weak. It makes you a human being running Stone Age hardware in a probability casino. The traders who survive streaks aren't the ones who feel nothing; they're the ones who expected the feeling, named it in advance, and built rules that don't require them to feel calm in order to behave correctly.
Normal variance or a dead edge: how to actually tell
This is the real question, isn't it. Streaks are normal, fine, but edges also genuinely die. Strategies that printed money in one regime bleed out in the next. So how do you tell a scheduled losing streak from a funeral?
Start with the base rate from the table above. If your tested win rate is 55% and you've just taken six losses in a row, you are inside the expected worst case for a mere hundred trades. That's not evidence of anything. It's Tuesday. The streak only starts carrying information when it pushes well past what your win rate should produce across your actual sample size, and even then it's a prompt for investigation, not a conviction.
Better than counting the streak, though, is auditing the trades themselves, because streak length is a noisy signal and trade quality is a clean one. Go through the losing run entry by entry and ask three questions of each trade:
- Was the setup valid? Did this trade meet every rule of the system at entry, or did it sneak in on a "close enough"?
- Was the execution clean? Planned size, planned stop, no mid-trade meddling, no stop dragged wider "to give it room"?
- Was the loss mechanism ordinary? Stopped out by normal price movement, or by something structural such as spreads blowing out around news, slippage on the open, a session you never used to trade?
If the answers come back valid, clean and ordinary, you are almost certainly looking at variance, and the correct response is to change nothing. That answer is deeply unsatisfying, which is exactly why so few traders accept it. If instead you find broken rules and sloppy execution, you don't have a strategy problem either; you have a discipline problem wearing a strategy problem's coat, and the fix is behavioural. Only when the trades were valid and clean but the loss mechanism keeps looking wrong, setups that historically ran 60 pips now reversing within 10, a market structure your system was never built for, do you have a genuine edge question, and the response to that is reduced size and more data, never a redesign on the fly.
Variance takes your money and leaves your process intact. A dead edge breaks the process itself, and it shows up in the trades long before it shows up in the streak count.
One more honest complication: the market doesn't announce regime changes. Gold in a grinding range and gold during a rate-decision week are nearly different instruments, and a breakout system will streak horribly through the former without being remotely broken. Context matters. Which is why the audit beats the tally every single time.
The behaviours that turn a streak into a blown account
We said it at the top: streaks don't blow accounts, responses to streaks blow accounts. After enough years watching this happen, to clients, to colleagues, to our own younger selves, the failure patterns are depressingly consistent. There are five.
Martingale thinking. Doubling size after losses to "win it all back on one trade". The seduction is mathematical: it works right up until it doesn't, and when it doesn't, it takes everything. A trader doubling from 1% risk through a losing run is betting 32% of their account by loss number six. The streak table says loss number six is unremarkable. The martingale makes it terminal.
Stop widening. Moving the stop away from price mid-trade because "it just needs room". This converts a defined 1% loss into an undefined one, and it has a nasty habit of working several times in a row, teaching the lesson, before one trend day converts a small planned loss into a 15% crater. Every stop you widen is a message to yourself that the plan is negotiable. Plans that are negotiable under stress are not plans.
Revenge trading. The urge to make the market give it back, right now, tonight. Revenge trades share a signature: rushed entry, oversized position, no setup, usually within an hour of the loss that provoked them. They are the single most reliable account-killer we know of, because they arrive precisely when judgement is worst and sizing discipline has already slipped.
Strategy hopping. Abandoning the system mid-streak for a shinier one, which resets your sample to zero and guarantees you're always trading something unproven. Hop three times a year and you never accumulate the few hundred trades needed to know whether anything works. The graveyard of retail trading is full of accounts that died of five almost-good strategies rather than one adequate one.
Silent leverage creep. Not one dramatic decision but a slow slide: 0.1 lots becomes 0.15, then 0.2, "just while I recover". Risk per trade drifts from 1% to 3% without a single conscious choice, and the next ordinary streak lands on triple the exposure. If you want to see exactly how much room your account really has before the broker steps in, run your numbers through the worked examples in our margin call calculator guide before the streak does the demonstration for you.
Notice what all five have in common. Each one is an attempt to shorten the streak, to end the discomfort early, and each one instead converts a survivable statistical event into a capital event. The streak was never the enemy. The urge to make it stop is.
Position sizing that survives the worst realistic run
Everything above points the same direction: sizing is the decision, and it has to be made before the streak, because during the streak you will not be the person you are now.
The honest way to size is backwards from your worst realistic run, not forwards from the profit you'd like. Take your tested win rate, find the expected worst streak for a serious sample from the table, then add a margin because reality is fatter-tailed than the model. A 55% win-rate trader planning for a thousand trades should expect nine straight losses and build for twelve. Then decide the maximum drawdown you can genuinely tolerate, and be brutally honest here, because the number your spreadsheet tolerates and the number your sleep tolerates are rarely the same. Most people say 30% and start behaving badly at 12%.
Divide tolerance by streak and you have your risk per trade. Fifteen percent maximum drawdown across a twelve-loss worst case comes out a shade over 1% per trade. That's not a coincidence; it's why the boring old 1% rule keeps being the answer serious risk managers converge on, not because it's traditional but because it's what the arithmetic produces when you feed in realistic streaks and human-scale pain thresholds. On a $2,000 account that's $20 a trade, and yes, the profits at that size are modest. So is the funeral risk.
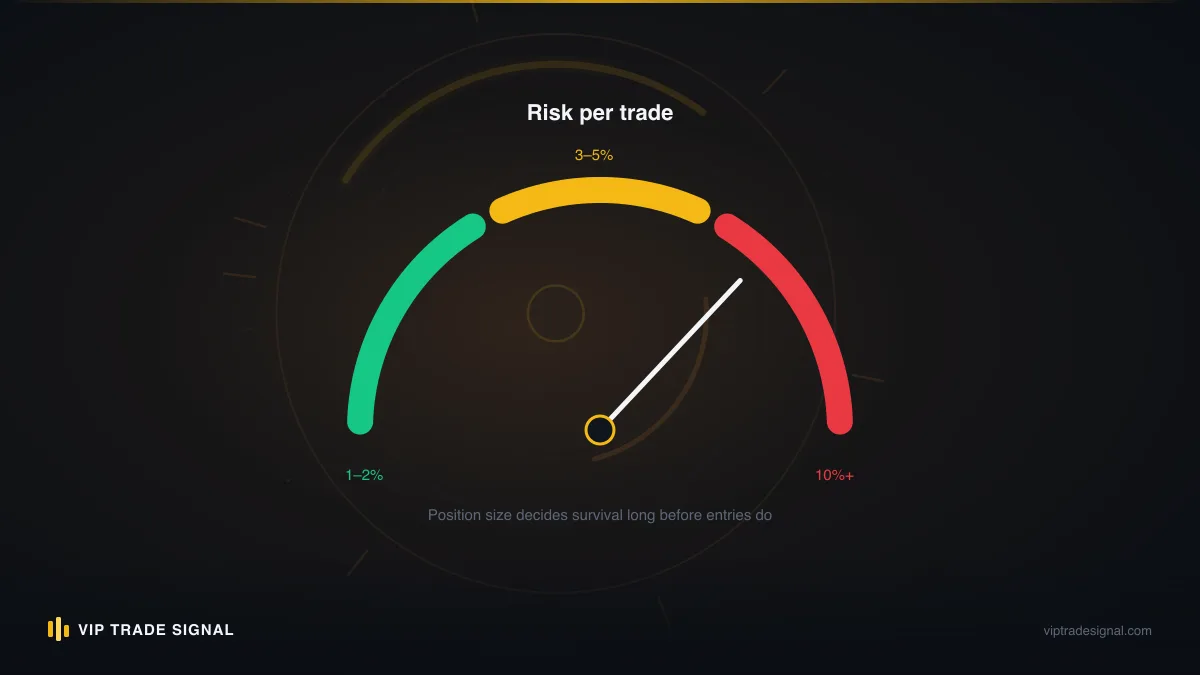
Two refinements earn their keep. First, a step-down rule: after four consecutive losses, cut risk to half; after seven, halve it again. This does the opposite of martingale, shrinking exposure exactly when either variance is running hot or the edge is genuinely wobbling, and it means your deepest losses happen at your smallest size. The cost is a slightly slower recovery when the wins return. Cheap insurance. Second, a correlation cap: if you're running multiple positions on correlated instruments, and on a gold-focused book almost everything is correlated, treat combined open risk as one trade against your limit, not several. Three simultaneous 1% gold longs are a 3% position wearing a disguise, and the streak maths above quietly assumed you weren't doing that.
What to review during a streak (and what to leave alone)
There's a strange comfort in fiddling. Mid-streak, reviewing things feels responsible, and some of it is. Most of it is sabotage in a lab coat. So split the ledger explicitly.
Review these, in the open, with the journal:
- Execution against rules. Trade by trade: valid setup, planned size, untouched stop? This is the audit from earlier and it's the highest-value hour you can spend during a streak.
- Risk arithmetic. Recount actual risk per trade in currency, not intentions. Streaks are when leverage creep gets caught, and it's also worth rechecking your account's actual buffer; plenty of traders discover mid-streak that they never really understood what their platform's margin figures meant, which is what our explainer on margin level percentage exists for.
- Trade context. Were losses clustered around news events, a particular session, a spread blowout? Structural loss mechanisms are actionable; random ones aren't.
- Your own state. Sleep, stress, screens-per-day. Not because feelings decide anything, but because degraded humans execute degraded trades, and that shows up in the audit.
Leave these alone until the streak ends and the sample grows:
- Entry criteria. Redesigning entries on five trades of evidence is astrology.
- Stop and target structure. Widening stops mid-streak because "they keep getting hit" is the streak talking, not the data.
- The strategy itself. Any change born inside a drawdown, judged on a handful of trades, is a coin flip you'll mistake for a decision. Write the idea down, date it, and test it when you're flat and calm.
The discipline here is agreeing with yourself, in writing, before the streak, which category each item belongs to. Because mid-streak, everything feels reviewable, and the line between diligent and destructive is exactly one bad evening wide.
Streaks when following signals: whose fault is it?
Follow a signal service long enough and you will sit through its losing streaks, because the provider is running a strategy and every strategy streaks. The table doesn't care whose name is on the trades. And this is where the relationship between subscriber and provider gets tested, usually unfairly, in both directions.
The unfair-to-provider version: a subscriber joins during a hot run, sizes up aggressively, hits the service's first ordinary five-loss patch, and leaves angrily calling it a scam. If the service's long-run record was honest, that subscriber just paid the entry fee for the streak and left before the recovery, the single most common way people lose money on genuinely profitable signals. The maths of the service was fine. The subscriber's timing expectations and sizing were not, and no provider on earth can protect a follower who risks 5% per signal from the streaks that 1% sizing was designed around.
The unfair-to-subscriber version is uglier and far more common in this industry: services that quietly delete losing calls, restart Telegram channels after bad months, or publish win rates with no verifiable history behind them. A subscriber can't distinguish normal variance from a dead edge if the losses keep vanishing. This is precisely why a full public record matters; you can scroll our closed signals, streaks and all, and count the red ones yourself. A provider who hides their losing streaks is telling you either that they don't understand variance or that they hope you don't. Neither is someone to follow with money.
So whose fault is a streak? Nobody's, if the trades were valid, sized as recommended, and the long-run record holds up. Yours, if you tripled the suggested risk. The provider's, if the streak reveals trades that never had a coherent setup, or a record that can't be verified. The healthy way to follow any service, including ours at $99 a month or free through a partner broker, is to decide before subscribing how you'll judge it: over how many signals, at what fixed risk, against what visible history. Judge it on a streak and you'll fire every honest provider you ever hire, and probably keep the dishonest one who never shows you a loss.
When stopping is right: the circuit-breaker rules
Everything so far says don't overreact. But there is a point where stopping is not weakness; it's the plan working. The trick is defining that point in advance, mechanically, so the decision doesn't rest on how you feel at your worst.
A circuit-breaker system worth having has three levels, agreed with yourself in writing while your account is healthy:
- The daily stop. Two or three losses in a day, or a fixed daily loss of, say, 3%: done until tomorrow. No exceptions, no "one more good setup". Its purpose isn't statistical; three losses tell you nothing. Its purpose is to separate you from the revenge-trading window, the two hours after a painful stop-out when the worst trades of most careers get placed.
- The streak stop. At your expected worst run for your sample size, seven or eight straight for most systems, drop to minimum size or demo, and run the full audit from earlier. You're not abandoning the strategy. You're refusing to fund the investigation at full price.
- The drawdown stop. A hard account-level line, 15% or 20% from peak, where all live trading halts until the audit is complete and something specific has been understood. Not felt. Understood.
Do these rules cost money? Sometimes, yes. A daily stop will occasionally bench you an hour before the setup of the month appears, and you'll hate it. A streak stop means your first winners after a bad run land at half size, so recoveries start slower than your spreadsheet says they should. Pay it anyway. The entire history of retail forex says the expensive tail event isn't the trade you missed while benched; it's the sequence you took while tilted. We've never once met a trader whose account was ruined by stopping too early. We've met a great many ruined by the opposite, and every single one of them had a reason, in the moment, why this particular evening was the exception.
Write them down while things are good. That part is not optional. A circuit-breaker invented mid-streak will be set wherever your pain currently is, and moved the moment hope shows up. One written in advance is a contract with a smarter version of you.
And if the account is already deep in the hole, floating a loss so large that closing it feels impossible and adding to it feels inevitable, that is past the point where an article helps and into the territory where structure does. It's the exact situation our drawdown management service exists for: accounts floating roughly $5k to $10k down, worked back methodically against a jointly recorded baseline, with the fee taken only as a flat 50% of what's actually recovered above it. No guarantees of recovery, ever, because anyone offering guarantees on a drawdown is lying to you, and you've been lied to enough by that point.
Coming back without revenge trading
The streak ends. They all do, one way or the other. What you do in the first ten trades afterwards decides whether it was an expensive lesson or just an ordinary chapter, because the comeback window has its own trap: the urge to recover fast, which is revenge trading wearing a business suit.
Come back at reduced size. Half risk for the first ten trades is a fair default, not because the maths demands it, but because you need to re-earn your own trust before you re-deploy your own capital, and small size makes honest execution cheap. The account doesn't need to recover this week. It needs you executing valid setups at survivable size for the next thousand trades, and a slow first week costs almost nothing against that horizon.
Measure the comeback in process, not money. Ten trades, every one a valid setup, planned size, untouched stop: that's a successful return, even if six of them lose. You cannot control the sequence, that was the entire lesson of this article, but you can control whether you were the trader the strategy needs. Keep score of the thing you control.
And do the one piece of admin that pays forever: write the post-mortem while it's fresh. What the streak was, how long, what it cost, what you felt at each stage, which rules held and which bent. File it. Because here is the closing truth, and it's the one that separates ten-year traders from eighteen-month ones: this was not your last losing streak. The table guarantees another, longer one, somewhere in your next thousand trades. The trader who survives it isn't the one with the best strategy or the steadiest nerves. It's the one who sized for it before it arrived, audited instead of panicked during it, and came back afterwards at half size with a written record of the last one open on the desk. Streaks stopped being emergencies for us the day they became appointments. Put yours in the diary. If anything in your setup couldn't survive twelve straight losses starting tomorrow morning, and be honest, you already know, fix the size tonight, not the strategy. The strategy was probably never the problem.