Draw a horizontal line on a gold chart, wait a session or two, and watch price punch straight through it by four dollars before reversing exactly where you thought it would. If you have traded XAUUSD for more than a month, this has happened to you. Probably this week.
That experience is why so many traders conclude that support and resistance levels in gold trading are a myth, some kind of hindsight trick that only works in YouTube replays. They are not a myth. They are real, they are tradeable, and our entire signal desk is built on them. But gold does not respect a level the way EURUSD respects a level. It respects an area, and it likes to make the area bleed a little before honouring it. If you draw lines the way the textbooks teach, gold will stop you out at the extreme of the move and then go exactly where you predicted, without you.
This article is the technical toolkit we actually use: how to draw zones that survive gold's overshoots, which levels deserve a place on your chart and which are clutter, where Fibonacci retracements genuinely earn their keep on gold's trending legs, and an honest accounting of what RSI and MACD do and don't do on this pair. No indicator worship. No pretending any of this wins every time. Just the parts that have survived years of live trading.
Why gold makes level-drawing harder than forex
Start with the obvious: gold moves more. A quiet day on EURUSD might be a 50-pip range. A quiet day on gold is $20, and a lively one is $60 or more. On a $3,300 metal that is not enormous in percentage terms, but in absolute dollars against your stop it changes everything about how precisely a level can be expected to hold.
There are structural reasons for the sloppiness, and knowing them stops you taking it personally.
First, gold has no single home. EURUSD is anchored by two central banks and an ocean of interbank flow that clusters around well-worn prices. Gold trades as spot in London, futures in Chicago, physical in Zurich and Shanghai, plus a thousand CFD feeds sitting on top. Each market has its own order book and its own slightly different price. The level you drew from your broker's feed is a few cents different from the level a futures trader drew from the COMEX chart. When both crowds defend "the same" level, they are actually defending a band.
Second, gold is the market's panic asset. When a headline hits, gold does not drift towards a new price, it teleports. A missile strike, a hot inflation print, a central bank surprise: any of these can drive a $30 spike in minutes, and spikes do not stop politely at technical levels. They run through them, trigger the stops resting behind them, and then, quite often, come all the way back. The level did its job. Your stop just wasn't given the chance to find out.
Third, the stop-hunting is not your imagination. Any level obvious enough for you to draw is obvious enough for everyone, which means a pool of stop orders builds just beyond it. Larger players know those pools exist and price has a way of reaching into them before reversing. Nobody needs a conspiracy theory here; resting liquidity attracts price the way an open bar attracts a wedding party. It is simply how auction markets work, and gold, with its deep options market and heavy futures positioning, does it more visibly than most pairs.
So the raw material is good. Gold trends hard, retraces cleanly, and respects structure over any horizon from an hour to a decade. It just refuses to respect a line one pixel wide. Your drawing method has to absorb that, and that is where zones come in.
Zones, not lines: the core fix for support and resistance levels in gold trading
Here is the single biggest upgrade available to anyone doing gold technical analysis: stop drawing lines, start drawing rectangles. A line says "price will reverse at 3,308.00". A zone says "sellers live between roughly 3,304 and 3,312, and somewhere in that band the reversal happens". The second claim is the only one gold ever actually honours.
How wide should the zone be? Not a fixed number, because gold's volatility breathes. We anchor zone width to the Average True Range on the daily chart. In a normal regime, daily ATR on gold sits somewhere between $30 and $45. Our working rules:
- Intraday zones (drawn from H1/H4 structure): roughly 20 to 25 per cent of daily ATR. With a $40 ATR, that is a zone $8 to $10 tall.
- Daily swing zones: 30 to 40 per cent of daily ATR, so $12 to $16 in the same regime.
- Weekly and monthly zones: these are territories, not zones. $20 to $30 tall is normal, and that is fine because you are not setting a stop on their edge anyway.
Where exactly do you put the rectangle? Use the bodies, not the wicks, as your spine. Find the cluster of candle closes and opens where price repeatedly stalled, set the inner edge of your zone at that body cluster, and let the outer edge extend towards, but not necessarily to, the most extreme wick. Wicks show where price briefly visited; bodies show where it agreed to stay. A zone drawn body-to-body with a wick allowance catches the true reversal area without demanding you defend the exact spike high.
One test tells you whether your zone is honest: look back at the last three or four touches. If the zone contains the candle closes on every touch, it is well drawn, even if wicks poked out the far side each time. If closes routinely land outside it, your zone is either too narrow or in the wrong place. Redraw it around the closes and check again. Ten minutes of this per level, done on a weekend, will improve your entries more than any indicator purchase ever will.
And yes, wider zones mean wider stops, which means smaller position sizes. A $10 zone with a stop $4 beyond it is a $14 risk before you have even added spread. On a $2,000 account risking 1 per cent, that is $20 of room, which prices you at around 0.01 lots. That is not a flaw in the method. That is the method telling you the truth about what gold costs to trade.
Which levels matter: round numbers, session extremes, weekly structure
Not every horizontal line deserves chart space. A cluttered chart produces a cluttered trader, and gold charts collect clutter faster than most because the metal creates so many swings. Here is the hierarchy we actually use, strongest first.
Prior weekly and monthly highs and lows. These are the levels every fund manager, every commercial hedger and every swing trader can see, and they behave accordingly. A prior monthly high on gold is worth more than every trendline on your chart combined. When price approaches one, expect a reaction, and expect the first touch to be the cleanest.
Round numbers, in tiers. Gold loves round numbers, but not all of them equally. The $100 levels, 3,200, 3,300, 3,400, act like magnets and barricades: options strikes cluster there, headlines are written about them, and price both gravitates towards them and stalls at them. The $50 levels matter on the daily. The $25 and $10 marks are intraday furniture, useful for fine-tuning an entry but nothing to build a trade thesis on. If a structural level and a $100 round number sit within a few dollars of each other, treat them as one fat zone. That confluence is worth more than either alone.
Prior day high and low, and session extremes. For intraday work, yesterday's high and low are the most reliable magnets on the board. The Asian session range matters in a specific way: gold usually does little overnight, coiling in a $10 to $15 band, and the London open frequently drives a false break of one side of that range before the real move goes the other way. Knowing that pattern exists does not make it a strategy on its own, but it will stop you buying the first pop above Asian highs at 8am London like a machine feeding coins into a slot.
Untested breakout origins. When gold breaks out of a range and trends, the origin of the breakout, the last consolidation before the launch, becomes a high-quality demand or supply zone on the retest. First retests of these zones are among the best trades gold offers.
What we deliberately leave off the chart: most trendlines (gold's overshoots make them a redrawing exercise), pivot-point levels from indicator packages (mechanically derived, rarely respected on gold), and any level that has already been broken and reclaimed twice. A level that has been chewed through repeatedly is no longer a level. It is a battlefield, and you do not build positions in the middle of a battlefield.
Drawing levels top-down: the monthly-to-hourly workflow
Levels drawn in isolation on the 15-minute chart are guesses. Levels drawn top-down inherit their meaning from the bigger picture. Our markup routine takes about twenty minutes on a Sunday and follows one direction only: down.
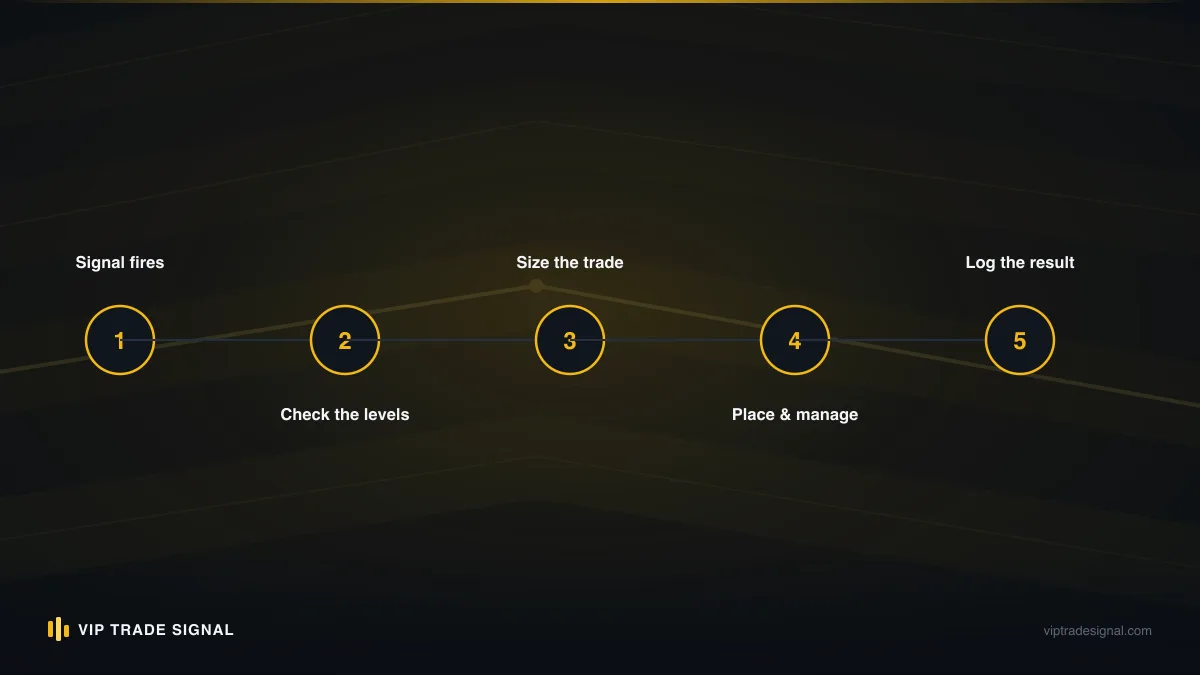
- Monthly. Mark only the swings a person standing across the room could see. All-time high, the major correction lows, the origin of the current multi-year leg. You will mark perhaps three or four territories. Colour them distinctly. These almost never change.
- Weekly. Add the highs and lows of the last significant swings, the past year or so of structure. Another four to six zones. This is also where you decide, once, which way the tide is flowing. Everything below inherits that bias.
- Daily. Now mark the tradeable swing zones: prior daily swing highs and lows, breakout origins, the levels that produced the last several reversals. Zones here get the 30 to 40 per cent of ATR width from earlier. This is the timeframe where most of our signal levels live.
- H4 and H1. Refine, don't invent. Inside the daily zones you have already drawn, find the body clusters that tighten the entry. You may add one or two purely intraday levels, prior day's high and low, the week's open, but if an hourly level does not sit inside or near a higher-timeframe zone, it is a second-class citizen and gets traded smaller or not at all.
The discipline that makes this work is refusing to redraw upward. If price does something dramatic on the hourly chart, the monthly zones do not move. Traders get into trouble when they let the last two hours of price action talk them out of levels the last two years of price action established. The whole point of the top-down pass is that it was done calmly, on a weekend, before the market started shouting at you.
Do the pass again each weekend. Most weeks you will adjust two or three zones and delete one that got destroyed. The chart stays clean, and by Monday morning you already know the five or six prices where anything interesting can happen. Everything between them is noise you are excused from watching.
The overshoot problem: when every line gets wicked
Even with well-built zones, gold will sometimes blow straight through one and reverse beyond it. This is the overshoot, the stop-run, the thing that makes traders swear at their screens in four languages, and you need explicit rules for it because it happens on gold weekly, not yearly.
The anatomy is consistent. Price approaches an obvious level with momentum. It breaks. It accelerates for a few minutes as breakout traders pile in and resting stops fire. Then, anywhere from $3 to $15 beyond the level, the move dies, and within one to three candles price is back inside the old range, leaving a long wick like a lie detector spike. The breakout traders are trapped. The stopped-out level traders are furious. And the move that follows, back through the zone in the original direction, is often the cleanest trade of the day.
Three practical responses, in ascending order of patience required:
Buffer your stop. Never place a stop at the zone edge. On intraday trades we want at least $3 to $5 of buffer beyond the zone on top of its width; on daily swing trades, $8 to $12. If the resulting stop makes your position size feel embarrassingly small, good. Gold is telling you its price of admission and most traders refuse to hear it.
Demand a close, not a touch. Treat no break as real until a candle closes beyond the zone on your trading timeframe. An H1 wick $6 through support that closes back inside it is not a breakdown. It is usually the opposite: evidence that the sellers who pushed it there found no follow-through.
Trade the failure itself. The most dependable entry gold offers is the reclaimed level: price wicks through support, closes back inside, and the next candle confirms. Your stop goes beyond the overshoot extreme, which has just been established as the price where the sellers genuinely lived. You have let the stop-run happen to someone else and used the information it revealed. We build a meaningful share of our entries this way, and if you look through our closed record at /signals/history you will see entry prices sitting a few dollars inside round numbers and prior extremes rather than exactly on them. That offset is not decoration. It is the overshoot, priced in.
The wick through your level is not the market disproving your analysis. Most of the time it is the market completing it.
None of this makes overshoots painless. Sometimes the "overshoot" keeps going and was simply a breakout, and your buffered stop loses money like any other stop. That is trading. The aim is not to dodge every loss, it is to stop donating money at the precise extreme of moves you had otherwise read correctly.
Fibonacci retracements on gold's trending legs
Let's deal with the scepticism first, because it is partly deserved. Fibonacci analysis attracts mysticism, golden spirals on sunflower photos, extension clusters predicting prices three years out, and most of it is decoration. We do not believe gold retraces 38.2 per cent of a move because the universe is built on a ratio. We believe fibs work on gold for a duller reason: enough traders and enough algorithms watch the same retracement levels on the same obvious swings that they become meeting points, and meeting points are where orders cluster. Self-fulfilling is not an insult. Self-fulfilling is the entire mechanism of technical analysis.
Used narrowly, fibonacci retracement in gold trading earns its place. The narrow use is this: gold, in a trend, moves in impulsive legs separated by retracements, and the fib tool gives you a principled guess about where a retracement ends when there is no clean horizontal level nearby, or, better, confirms a horizontal level that is already there.
Mechanics matter more than most tutorials admit:
- Draw on obvious swings only. The impulse leg should be visible at a glance on the daily or H4, say a $120 run from 3,270 to 3,390. If you have to hunt for the swing points, the swing is not obvious enough for anyone else to be drawing it, and the whole self-fulfilling logic collapses.
- Anchor to the wick extremes of the swing, and be consistent about it. Gold's spiky highs and lows are real turning points; using bodies for fib anchors on gold moves every level by several dollars and puts you off the crowd's map.
- Watch 38.2, 50 and 61.8 as a band each, not a line each. The same zone logic applies: give each ratio a few dollars of grace either side.
What the ratios tend to mean on gold, in our experience: strong trends, the kind driven by a live macro story, often turn at the 38.2 area without ever reaching 50, and waiting for the "proper" 61.8 pullback means watching the trend leave without you. Ordinary trends favour the 50 to 61.8 pocket. And a retracement that closes decisively beyond 78.6 is not a retracement any more; treat the leg as done and stand aside until structure rebuilds.
The honest failure mode: fibs are useless in ranges, and gold ranges for weeks at a time between its trending phases. Drawing retracements inside a $60 sideways chop produces levels that mean nothing because there is no impulse crowd defending them. Ask one question before reaching for the tool: is there a leg here that a hundred thousand other traders would draw identically? If yes, draw it. If you are choosing between three possible swing lows, close the tool. On its own a fib touch is a weak signal. Stacked with structure, which is where we are heading, it earns its keep.
RSI on XAUUSD: what testing actually shows
The 14-period RSI is on every platform's default chart, which is precisely why it deserves suspicion. Here is the honest account of using RSI and MACD for XAUUSD, starting with RSI, from years of watching them live and repeatedly checking the standard claims against gold's history.
The classic instruction, sell above 70, buy below 30, is a reliable way to lose money on gold. Not slowly, either. Gold trends harder than almost anything else retail traders touch, and in a genuine trend RSI on the H1 or H4 pins above 70 and sits there for days while price adds another $80. Every "overbought" reading in that stretch is not a sell signal; it is a strength reading. Traders who shorted gold on daily RSI 70 during the big bull legs of recent years were run over repeatedly, and the indicator never apologised.
What RSI is actually good for on gold, in descending order of usefulness:
Divergence at a level. Price presses to a new high inside a resistance zone you drew in advance; RSI makes a lower high than it did on the previous push. That mismatch, momentum fading exactly where sellers are expected, is meaningful. Divergence in the middle of nowhere is trivia. Divergence at your zone is a trigger.
Regime reading. In an uptrend, RSI on H4 tends to oscillate roughly between 40 and 80, with pullbacks bottoming in the 38 to 45 area. When that floor starts breaking, when pullbacks begin driving RSI to 30, the character of the market has changed even if price still looks fine. This is the quiet, unglamorous use of RSI and it is worth more than every overbought signal combined.
Range extremes, carefully. When gold is provably ranging, RSI extremes back at range boundaries do add a little. But the range does the work; RSI is seasoning.
On settings: we have watched plenty of traders tune the period, 9 for speed, 21 for smoothness, and our view after seeing the results is that tuning is mostly rearranging deck chairs. RSI(14) on H4 and D1 is where the tool is least noisy on gold. Below H1, gold's spikes make any oscillator jumpy enough that you are reacting to noise wearing a costume. And the failure zone to tattoo somewhere visible: RSI overbought in an uptrend is not a short signal on gold. Ever. If a decade of XAUUSD charts teaches one indicator lesson, it is that one.
MACD on XAUUSD: what it catches and what it misses
MACD gets grouped with RSI as "momentum", but it is a different animal: two moving averages and their gap, dressed up with a histogram. That parentage explains both its strength and its weakness on gold. Moving-average tools shine when price trends and embarrass themselves when it doesn't, and gold does both, emphatically, in alternating phases.
What MACD catches well on XAUUSD: the meat of trending legs. When gold breaks from a multi-week coil and the daily MACD crosses upward below the zero line and then climbs through it, that sequence has historically kept you on the right side of the big moves, the legs worth $150 or more, for most of their duration. It will never get you in at the low. It is a confirmation tool, structurally late by design, and used as confirmation it is genuinely useful: if you are buying a support zone in an uptrend and the H4 MACD histogram is already shrinking its red bars, your timing has a tailwind.
What it misses, and where it bleeds: everything sideways. In a $50 range, MACD crosses back and forth like a windscreen wiper, and each cross looks exactly as convincing as the ones that preceded the real moves. Count the crosses on any consolidation month on the H1 gold chart; a dozen signals, perhaps two worth taking, and no way to tell them apart at the time. The indicator cannot distinguish chop from trend because it is built from averages of the same price feeding the chop. Nothing derived from price alone escapes that circle.
A comparison we keep in our heads:
| Question | RSI(14) | MACD (12,26,9) |
|---|---|---|
| Best gold timeframe | H4, D1 | D1, H4 |
| Strongest use | Divergence at a pre-drawn zone | Confirming trend continuation |
| Worst habit | "Overbought" in strong trends | Whipsaw crosses in ranges |
| Standalone entry signal? | No | No |
| Role in our process | Trigger refinement | Regime confirmation |
The same logic covers the broader XAUUSD moving average strategy question we get asked about constantly. The 50 and 200 daily EMAs matter on gold, but not as crossover signals; golden crosses arrive weeks after the move they announce. They matter as dynamic support: in established uptrends, gold's daily pullbacks have repeatedly found buyers around the 50 EMA, and the 200 EMA has marked the last defensible line of several corrections. Treat the averages as slow-moving zones that add weight to nearby structure. Trade them as standalone signals and the range-phase whipsaws will quietly eat whatever the trend phases earned.
Confluence: stacking level, fib and momentum
Every tool so far has been graded "useful, not sufficient". That is not hedging; it is the design brief. None of these signals is strong alone, and the way you build something strong from weak parts is stacking, requiring several independent tools to point at the same price before you care about that price.
Here is what a genuine confluence looks like on gold. Say the metal has run from 3,240 to 3,390 over two weeks and is now pulling back. You check the elements:
- The 38.2 retracement of the leg sits at 3,333.
- A prior daily resistance zone, the origin of the final breakout, spans 3,326 to 3,336. Old resistance, potential new support.
- The 50 EMA on H4 is rising through 3,330.
- The round number 3,325 sits just below the whole cluster, a plausible overshoot magnet.
Four independent reasons, one $10 pocket. Now you have somewhere to be. You set an alert at 3,340 and go do something else, because the next hours of price action between here and there are officially not your problem. If price reaches the pocket, then you look for the trigger: a reclaimed wick low, an H1 bullish close from inside the zone, RSI holding its uptrend floor near 40. Zone plus trigger, never zone alone.
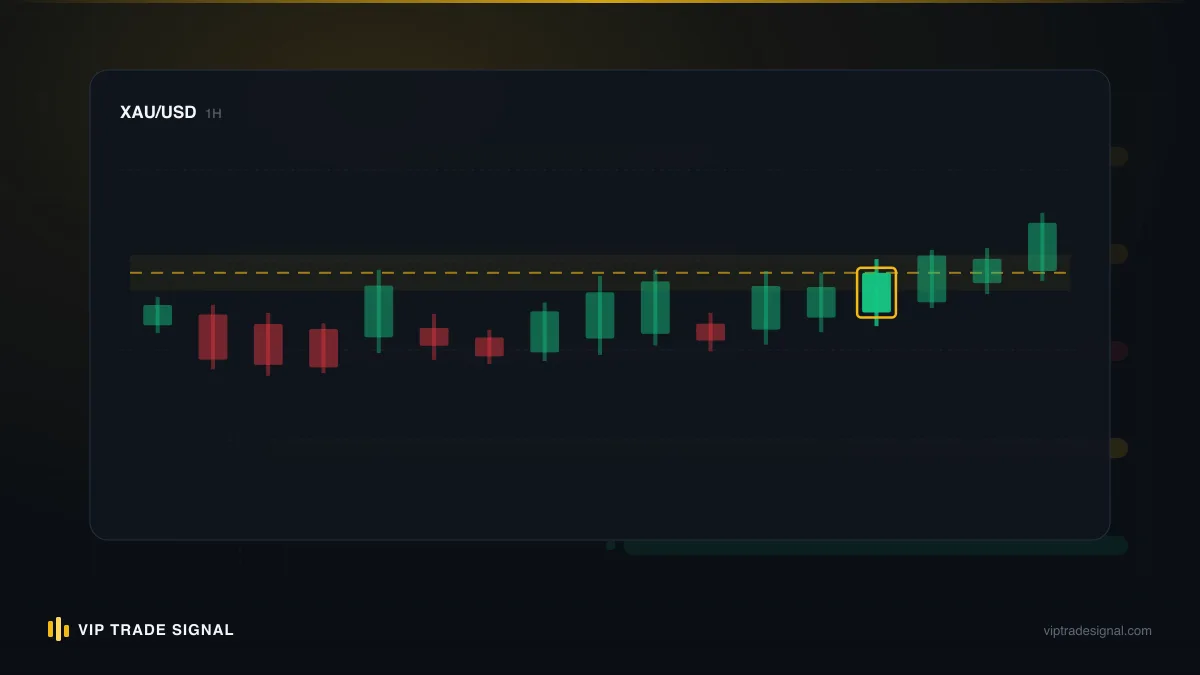
Two warnings, both from experience. First, confluence must be independent to count. The 50 EMA and MACD agreeing is one vote, not two; MACD is made of moving averages. A fib level and a structure zone agreeing is two votes, because they are derived from different logic. Second, beware manufactured confluence. Give a motivated trader a fib tool, three timeframes and twenty minutes, and they can build a five-reason case for any price on the chart. The defence is order of operations: draw your zones first, on the weekend, before you have a position or an itch. Confluence you discovered is evidence. Confluence you assembled to justify a trade you already wanted is a prosecution exhibit.
Our own desk works exactly this way, and it is why we send a handful of signals a day rather than a stream of them; if you have wondered what actually happens before an alert reaches your phone, we have written up the whole pipeline in how our signals are generated. Most hours of most sessions, price is between pockets, and between pockets the correct position is none.
Trading a level: entry, stop and invalidation
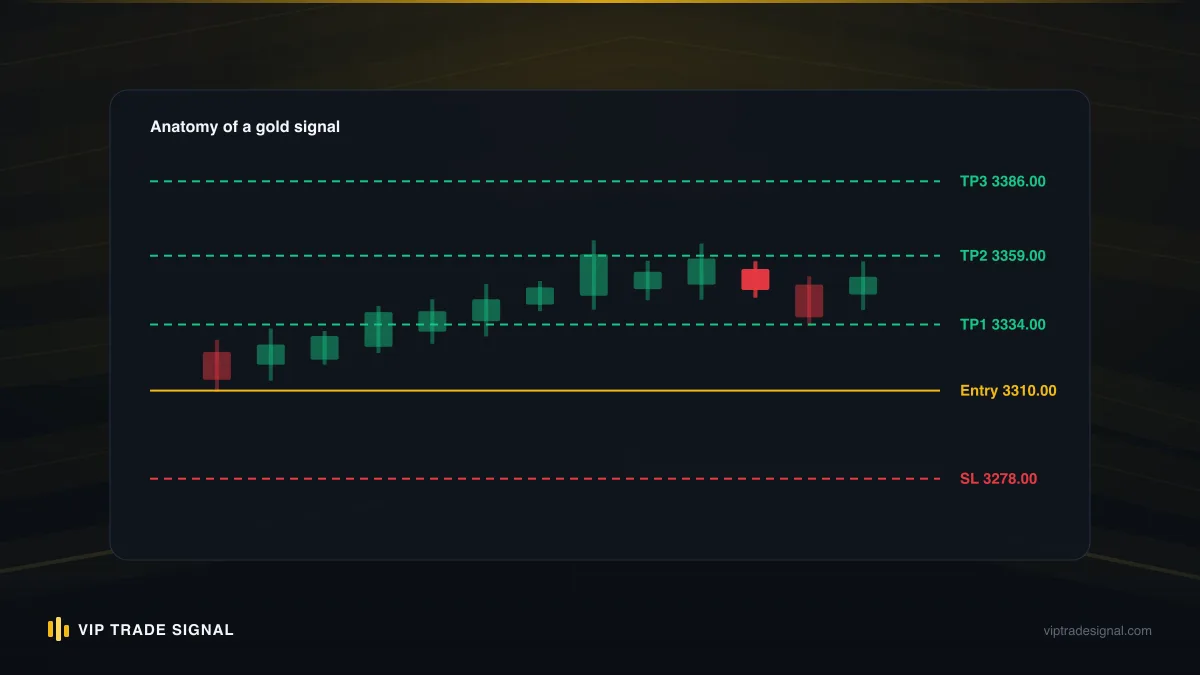
A good zone still has to be converted into an actual trade, and this is where the arithmetic gets unforgiving, so let's do it with real numbers.
Suppose that 3,326 to 3,336 support pocket from the last section is live, price has just touched 3,334, and an H1 candle has closed back above 3,338 after wicking to 3,329. A reasonable structure:
- Entry: 3,336, on the confirmation close, not the first touch. Buying the first touch of a zone is paying full price for an unconfirmed hypothesis.
- Stop: below the zone floor at 3,326, minus a $5 overshoot buffer: 3,321. Total risk, $15, call it $15.40 with spread.
- First target: the swing high at 3,390, $54 away, roughly 3.5R. A nearer partial at prior structure around 3,362 if you like taking something off early.
Now the sizing, because this is where gold punishes the casual. Risking 1 per cent of a $2,000 account is $20. One standard lot of gold moves $100 for every $1 of price, so 0.01 lots moves $1, and this stop therefore costs $15.40 per 0.01 lots. Your size is 0.01, and that is correct, not timid. The trader who "can't do anything with 0.01 lots" and sizes up to 0.10 is risking 7.7 per cent on a single gold trade, and a perfectly ordinary run of four losers, which every method produces, takes nearly a third of the account. We watch this exact arithmetic destroy people monthly. The zone was fine. The size was the blowout.
Invalidation deserves its own sentence because it is not the same as the stop. The stop is where your loss is realised; invalidation is where your idea is dead. If an H4 candle closes below 3,321, the support thesis is finished, and if for any reason you are still in, or contemplating a re-entry, the answer is no. No re-drawing the zone $8 lower. No "it's still basically holding". A level that needs re-explaining after every candle is not analysis, it is attachment. And when the trade does work, the zone you entered from becomes the trailing reference: on a runner, stops move behind each new reclaimed structure, not behind arbitrary dollar amounts.
One more honesty checkpoint: structured exactly this way, with confluence, confirmation and buffered stops, these trades still lose regularly. A 3.5R payoff means the maths can work handsomely below a 50 per cent hit rate, and it needs to, because that is the neighbourhood reality lives in. Anyone telling you their levels hold nine times out of ten is describing a backtest with the losses cropped out.
How our signals use these levels
Since we have mentioned the desk a few times, here is precisely how this toolkit shows up in what subscribers receive, because a signal is only usable if you understand the logic underneath it, something we bang on about at length in how to read a trading signal properly.
Every alert we publish on /signals is built from the process in this article: weekend top-down markup, zones sized off ATR, fib and momentum as confirmation rather than foundation, and entries structured around confirmation closes or reclaimed overshoots rather than first touches. When a signal says buy 3,336, stop 3,321, that stop is not a round number pulled from the air; it is the zone floor plus the overshoot buffer, and the distance between entry and stop already encodes everything this article said about gold's wicks. It is also why our stops sometimes look "wide" to traders raised on forex pairs. They are wide because gold is wide.
Two things we think matter about the honesty side. Every closed signal, the losers included and there are always losers, sits publicly in the history for anyone to audit, timestamped, with entry, exit and result. We do that because the signal industry's default behaviour is deleting bad calls and screenshotting good ones, and we would rather be checkable than impressive. And the commercial bit, kept brief: the service is gold-only, unlimited signals at $99 a month, or free if you trade through a partner broker (Exness, XM, IC Markets or Vantage) with $250 or more maintained. Nothing in it is personalised advice, we are not licensed advisors, and no level-drawing method, ours included, removes the risk of losing money on leveraged gold. If a service anywhere implies otherwise, close the tab.
The larger point is not the sales pitch. It is that nothing in our process is secret. Zones, structure, fibs, momentum, sizing: you have just read the whole toolkit. What a signal desk sells is not hidden knowledge, it is hours, someone watching the levels through sessions you are asleep or at work for, and the discipline of a written process applied every single day without moods. Whether that is worth paying for depends entirely on your own time and temperament, and plenty of traders reading this should simply learn the method and run it themselves.
Practice drills: mark up last month's chart
Reading about levels builds exactly none of the skill. Drawing them does. Here is a practice sequence we give to newer traders on the desk, and it costs nothing but a few evenings.
Drill one: the blind markup. Open XAUUSD, scroll back so the most recent month is off-screen, and run the full top-down pass, monthly territories, weekly swings, daily zones, H4 refinement, exactly as described above. Write the zones down. Then scroll forward one day at a time and score every interaction: did price reverse inside the zone, wick through and reclaim it, or destroy it? Keep honest counts. Most people find something like half to two-thirds of well-drawn daily zones produce a tradeable reaction on first touch, and the exercise teaches you what your half looks like.
Drill two: the overshoot census. Same month of data. Find every wick that pierced an obvious level by $3 or more and closed back inside. Count them. Measure the average overshoot depth. Then check what a stop placed at the exact level would have suffered versus a stop with the buffer. Nothing we could write here will convince you of buffered stops as thoroughly as your own tally of a single month's wicks.
Drill three: the fib audit. Mark the month's two or three obvious impulse legs, draw retracements on each, and record where the pullbacks actually ended relative to the 38.2, 50 and 61.8 bands. Also draw fibs on one stretch of pure range, and watch how meaningless the levels become. The contrast is the lesson.
Drill four: indicator honesty. Pull up RSI and MACD on the same month and log every textbook signal each produced: every overbought and oversold reading, every cross. Then mark which ones coincided with a zone you had drawn in drill one. The signals that landed on structure will cluster among the winners. The ones that fired in the middle of nowhere will cluster among the noise. One month of this beats a year of indicator-settings forums.
Do the full sequence on two or three different months, including at least one nasty ranging month, before risking a single live dollar on the method. If you have not yet traded gold at all, start with the broader groundwork in our guide to trading gold first, because levels are one layer of a stack that also includes sessions, spreads and news behaviour.
The level is a place to think, not a place to click
If one idea from these five thousand words survives contact with your Monday, make it this: a support or resistance zone is not an instruction to trade. It is a location where paying attention becomes worthwhile. The zone tells you where; the confirmation tells you whether; the sizing arithmetic tells you how much; and most of the time, the honest answer to "whether" is not this time.
Gold will keep piercing lines, running stops and embarrassing indicators, because that is what a deep, emotional, headline-driven market does. You do not fix that. You build a process that expects it: zones with real width, stops with real buffers, fibs only on legs the whole market can see, oscillators demoted from prophets to witnesses, and position sizes that respect what a $40 daily range does to a small account. None of it guarantees anything. All of it shifts the odds from donating at the extremes to trading with the crowd that actually moves this metal.
So here is the hard question to end on. Could you, right now, name the five prices on the gold chart where something worth trading could happen this week, and honestly say you drew them before the market started moving? If yes, you are ahead of most of the people you are trading against. If no, you have a free weekend coming, and now you know exactly what to do with twenty minutes of it.