Nobody opens a trading account planning for the day it's 34% down. But that day arrives for most retail traders anyway, usually within the first year, and what happens next depends almost entirely on whether they have a plan written down before the bleeding started. Most don't. They improvise. And improvised decisions made at minus 34%, with your heart rate up and your spouse asking questions, are reliably the worst decisions of your trading life.
This piece is a drawdown management playbook in the literal sense: the actual sequence of checks and rules we run when someone hands us a wounded account, reorganised so you can run it yourself. It's built around three phases, in order of how much they're worth to you: prevention, containment, recovery. Everyone wants to talk about recovery. Recovery is the least valuable phase of the three, and by the time you're in it, most of your options are already gone.
One thing before we start. Gold, forex, CFDs, all of it is high-risk trading, and no amount of process removes the possibility of losing money. What process does is decide whether a losing streak costs you 8% or your whole account. That difference is the entire subject of this article.
Why drawdown management beats return chasing
Here's a question we put to every trader who asks about our returns: would you rather compound 30% a year with a worst drawdown of 10%, or 100% a year with a worst drawdown of 60%?
Almost everyone picks the second option on instinct and the first option after thirty seconds of arithmetic. Because the arithmetic is brutal and it is not symmetric. Lose 10% and you need 11.1% to get back to flat. Lose 30% and you need 42.9%. Lose 60% and you need 150%. The trader chasing 100% a year will, at some point, eat the 60% drawdown that strategy implies, and then their next two years are spent climbing back to a number they'd already reached. Meanwhile the boring 30% trader has lapped them twice.
That's why drawdown matters more than ROI, and it's not a philosophical position, it's just how compounding works when the numbers go negative. Return is what a strategy produces when things go well. Drawdown is what it costs you when they don't. And you pay the cost in three currencies at once: capital, time, and judgement. The capital loss is visible. The time loss is sneaky, because a year spent recovering is a year of zero progress that never shows up in anyone's marketing. The judgement loss is the killer, because a trader 40% down does not think like the trader who opened the account. They cut winners early, widen stops, revenge trade, and generally do everything the drawdown needs them to do to get worse. We wrote a whole separate piece on that spiral in what drawdown does to your head, because the psychology deserves its own room.
So when you evaluate a strategy, a signal service, or your own last twelve months, look at maximum drawdown before you look at return. A strategy is not "up 80%". A strategy is "up 80% with a 55% max drawdown", and that second number tells you it will eventually destroy whoever trades it at size.
Return is what a strategy makes when it works. Drawdown is what it charges you when it doesn't, and it always collects.
The three phases: prevent, contain, recover
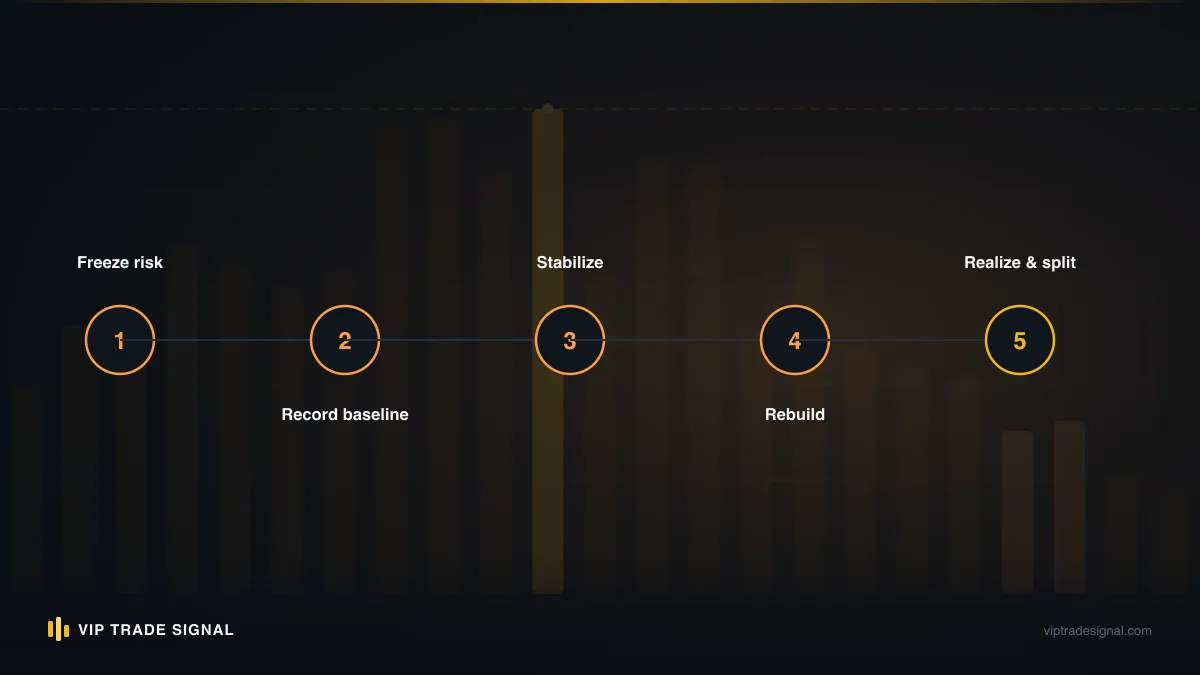
Every drawdown situation we've ever handled fits into one of three phases, and the correct actions in each phase are different. Mixing them up is where accounts die. Trying to "recover" during the containment phase, for instance, is how a 20% drawdown becomes a 50% one.
Prevention is everything you do while the account is healthy: sizing rules, exposure caps, loss limits, the equity curve monitoring that spots trouble early. Prevention is worth roughly ten times what containment is worth, which is itself worth ten times what recovery is worth. Those aren't measured figures, obviously, they're a way of saying the leverage on your effort collapses as the phases progress.
Containment starts the moment drawdown crosses your pre-agreed threshold and has one job: stop the hole getting deeper. Not fix it. Stop it. Containment is deliberately unambitious, and that's exactly why it works.
Recovery only begins once the bleeding has provably stopped, and it's slower than anyone wants it to be. The defining rule of recovery is that you climb out at reduced risk, not increased risk, which feels backwards and is the single most important sentence in this article.
The rest of this piece walks through each phase in working detail. Prevention gets the most space because it deserves it.
Position sizing: your first drawdown control
Every drawdown that ever wrecked an account was, at root, a position sizing failure. Losing streaks are normal. A streak of eight losers happens to good strategies with dull regularity; if you trade a 50% win-rate system long enough, an eight-loss run is close to a certainty, not a tail risk. What turns a normal streak into a catastrophe is the size of each loss.
The maths makes this concrete fast. Risk 1% per trade and an eight-loss streak costs you about 7.7% of the account. Annoying. Recoverable with an 8.4% gain. Risk 5% per trade and the same streak, the same strategy, the same market, costs you 33.7%, which needs a 50.8% gain to repair. Same trader, same signals, wildly different outcomes, and the only variable was a number you chose before entering.
So here are the sizing rules we actually run, not the ones that look good in a course:
- Fixed fractional risk of 0.5% to 1% per trade, calculated from stop distance, not from a fixed lot size. A $5,000 account risking 1% has $50 of room per trade. If your gold trade has a 400-cent stop (that's $4.00 on XAU/USD, or 400 points on most brokers), your size is whatever makes those 400 cents equal $50. The size changes every trade because the stop changes every trade.
- Risk off equity, not balance. If you have open floating losses, your real account is smaller than your balance says, and sizing off balance quietly increases your risk exactly when it should be shrinking. The difference between those two numbers matters more than most traders realise, and we've broken it down properly in equity versus balance drawdown.
- Round down, always. If the calculation says 0.87 lots, trade 0.8. The rounding error compounds in your favour over hundreds of trades.
- No "conviction sizing". The trade you're most confident in is not statistically more likely to win than your average trade; it just feels that way. The moment you let feelings set size, your largest positions cluster on your most emotional days, which is precisely backwards.
A word on gold specifically, since it's what we trade all day. XAU/USD moves differently to the majors. A quiet gold day covers 150 to 250 cents of range; a lively one covers 600 or more, and news days can triple that in an hour. If you carried your EUR/USD habits over, a 20-pip mental default, say, your stops will sit inside the market's ordinary breathing room and you'll be stopped out by noise on trades whose idea was perfectly sound. The fix isn't wider stops with the same lot size, which just means bigger losses. The fix is wider stops with proportionally smaller size, so the dollar risk stays pinned at your 1%. Gold punishes traders who size by habit rather than by the instrument in front of them, and it does it quickly.
Notice that none of this limits your upside in any meaningful way. A 1% risk trade that runs to 3R makes 3%. Do that ten times a year with a normal loss rate mixed in and you're compounding respectably. What 1% sizing actually limits is the depth of your worst month, and that, as we established above, is the number that decides whether you're still trading in three years.
Correlation and stacked exposure
Position sizing has a blind spot: it treats each trade as independent, and your trades frequently aren't.
Say you're running three positions at 1% risk each. Long gold, short USD/JPY, long EUR/USD. On paper that's 3% total risk across three separate ideas. In practice it's mostly one idea, dollar weakness, expressed three times, and if the Fed says something hawkish at 2pm you will watch all three hit their stops within the same hour. Your "diversified" 3% was a single 3% bet wearing three hats.
This matters even for a gold-focused trader, maybe especially for one. Gold correlates, loosely and shiftily, with real yields, with the dollar index, with risk sentiment on bad days. If you're stacking multiple gold positions from different signals or different timeframes, you don't have several trades. You have one trade at several entry prices, and your effective risk is the sum, not the average.
The rules we use to cap stacked exposure:
- Total open risk never exceeds 3% of equity, regardless of how many positions that is. Three trades at 1%, six at 0.5%, whatever, the cap is on the sum.
- Correlated positions count as one position. Two gold longs on different timeframes share a risk budget of 1.5%, not 2%. If you can't honestly say two trades would survive the same headline independently, they're correlated.
- One instrument, one direction. We don't run long and short gold simultaneously and call it hedging. That's just paying two spreads to be flat, with extra steps.
- News blackout on additions. No new exposure in the hour before top-tier releases (NFP, CPI, FOMC). Existing trades with stops in place ride it out; fresh risk waits.
This section is short because the principle is simple, but don't let brevity fool you about importance. In the wounded accounts people bring to us, stacked correlated exposure shows up in the post-mortem more often than any single bad trade. It's the difference between a losing day and a losing month arriving in one afternoon.
Daily loss limits and circuit breakers
Prop firms figured something out that retail traders resist: the daily loss limit is not there to protect the account from the market. It's there to protect the account from you, on your worst day, which is the only day that matters.
A daily loss limit works because tilt is real, measurable, and time-bound. After two or three consecutive losses, most traders enter a state where they are no longer executing their strategy; they're trying to win an argument with the market. The trades taken in that state are bigger and sloppier than anything in their normal book. A hard daily stop doesn't make you a better trader in that state. It removes you from the market until the state passes, which is the only intervention that reliably works.
Our version, which you're welcome to steal:
| Trigger | Action | Duration |
|---|---|---|
| Down 2% on the day | Stop trading | Rest of the day |
| Down 4% in a week | Halve all position sizes | Until weekly review |
| Down 6% in a week | Flat. No trades | Until Monday, minimum |
| Down 10% from equity high | Full containment protocol (below) | Until reviewed |
Two things make this work or fail. First, the limits are written down before the losing day, ideally taped somewhere visible, because a limit you're inventing while tilted is not a limit, it's a negotiation. Second, hitting a limit has to be treated as the system working, not as failure. A trader who stops at minus 2% followed their plan perfectly that day. It was a green day for process. Say that to yourself out loud if you have to. It sounds daft and it genuinely helps.
Can you automate this? Partially. Some brokers and most trade copiers support equity-stop settings, and MT4/MT5 has EAs that will close everything and lock the terminal at a threshold. Automation helps, but honestly, the trader determined to blow through a limit will find a way. The limit lives in your rules or it doesn't live anywhere.
Reading your equity curve like a professional
Most traders look at their equity curve the way you'd glance at a photo of yourself: quickly, and mostly to see if it looks good. A professional reads the curve the way a doctor reads an ECG, and learning how to read your equity curve properly is the cheapest early-warning system you'll ever install.
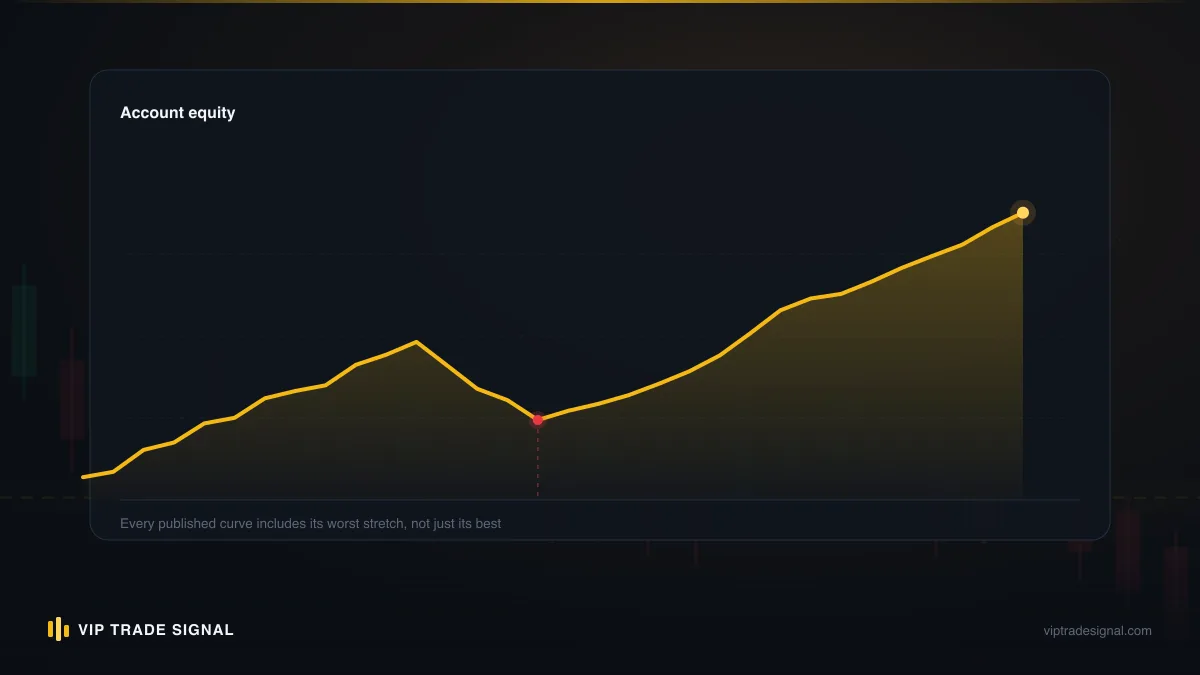
Start with the basics. Plot equity, not balance, and mark every new high. The vertical distance from the last peak to the current trough is your drawdown; the horizontal distance is its duration. Duration is the number amateurs ignore and professionals watch. A strategy that regularly recovers within three weeks and is now nine weeks underwater isn't necessarily broken, but something changed, and "something changed" is exactly the signal you want before the money confirms it.
Here's what we actually look for on a curve, in rough order of diagnostic value:
- Drawdown depth versus historical norm. If your worst-ever drawdown over 300 trades was 9% and you're currently 8% down, you're in normal territory, uncomfortable but expected. At 12% you're in unprecedented territory, and unprecedented means your live results have left the distribution your confidence was built on. That's a containment trigger regardless of how the trades "feel".
- Drawdown duration versus norm. Same logic, time axis. Longest historical underwater stretch times 1.5 is a reasonable review trigger.
- Slope changes. A curve that ground steadily upward and now saws violently sideways at the same average is telling you volatility of outcomes rose. That usually means the market regime shifted or your execution did. Either way, size down first, investigate second.
- The stair-step down. Sharp drops followed by flat plateaus, repeating. This is the fingerprint of a trader taking oversized losses, then trading scared until the pain fades, then taking another oversized loss. It's a discipline pattern, not a strategy pattern, and no amount of strategy tweaking fixes it.
- The sawtooth of doom. Long gentle climbs erased by single vertical drops. Classic sign of cutting winners early and letting one loser run, often via stop-widening. If your curve looks like this, your problem is not entries.
One habit worth building: screenshot your curve every Sunday and write two sentences about it. Depth, duration, anything unusual. It takes four minutes and it means that when a real drawdown starts, you have a dated record of when the curve first went strange, which is almost always earlier than you'd remember.
Containment: what to do the week drawdown starts
Right. The threshold broke. You're 10% down from your equity high, or whatever your written trigger was, and the plan you're about to follow was written by the calm version of you for exactly this moment. Here's ours, adapted for a self-directed trader, in order:
Day one: cut size in half. Immediately, mechanically, no debate. Every position sizing calculation now uses half your normal risk percentage. This is the single highest-value containment action, because it means that whatever is going wrong now goes wrong at half speed while you work out what it is. If the drawdown deepens another "8%" of losses, you only actually lose 4%. And if the strategy was fine and this was variance, you've given up a little upside during the recovery. That trade-off is so lopsided in your favour it's barely a decision.
Day one, part two: stop adding new strategy risk. No new instruments, no new timeframes, no new signal providers, no "this different thing will dig me out". Drawdown is the worst possible moment to evaluate anything new, because you'll grade it on whether it wins immediately, which is noise.
Day two: audit the open book. Every open position gets one question: would I open this trade today, at this price, at my reduced size? Anything that fails closes. Anything that passes stays with its original stop. What you're removing here is hope-based inventory, positions that stopped being trades weeks ago and became wishes.
Days three to five: run the post-mortem, in writing. Pull the last 20 to 30 trades and sort the damage. You're distinguishing between three causes, because each has a different fix. Variance: the trades followed your rules and lost anyway; the fix is patience at reduced size. Discipline leak: rule-breaking shows up in the log, oversized entries, moved stops, missed setups followed by chased ones; the fix is behavioural, and no strategy change will help. Regime change: the trades were clean but the market character shifted, trends died, volatility doubled; the fix is adaptation, done slowly and at small size. In our experience with client post-mortems, honest ones land on "discipline leak" far more often than anyone expects. The strategy usually wasn't the problem. The Tuesday afternoon where three rules broke in an hour was the problem.
One more thing for the containment week, and it costs nothing: tell someone. A trading friend, a partner, anyone who'll ask you in a fortnight whether you stuck to half size. Drawdowns thrive in privacy. The trader who has quietly promised themselves they'll fix it before anyone notices is under exactly the pressure that produces the catch-up trade, and a single sentence of accountability, "I'm 12% down and running my containment plan", takes most of that pressure out of the room. It also converts the drawdown from a shameful secret into a project with a process, which is, not coincidentally, how professionals treat it.
End of week one: set the recovery gate. Write down the condition under which you'll return to normal risk. Make it objective. Something like: ten consecutive trades executed to plan at half size, and equity above the containment-day level. Not "when I feel confident again". Feelings are what got us here.
What containment never includes: doubling size to get it back faster, removing stops "to give trades room", switching to a martingale anything, or depositing fresh money to prop up a method you haven't finished diagnosing. Fresh capital into an unfixed process is just a bigger drawdown scheduled for later.
Recovery without doubling risk
Everything in you will want to speed this part up. The arithmetic of drawdown recovery says you need outsized gains to get back, and the seductive conclusion is that you need outsized risk to produce them. This is exactly how 20% drawdowns become blown accounts, and refusing that logic is what separates traders who recover from traders who donate.
The professional approach is the opposite: recover at half risk, and let the win rate and time do the work. Yes, it's slower. A trader 15% down, risking 0.5% per trade with a decent edge, might need three or four months to see new equity highs. That feels like forever. But run the alternative honestly: the same trader risking 3% "to catch up" needs only a normal-length losing streak, five or six trades, to turn minus 15% into minus 30%, and now the required recovery gain has jumped from 17.6% to 42.9%. The fast road is only fast in the direction you don't want.
The numbers behind this deserve to be internalised rather than skimmed, so here's the table worth taping to your monitor:
| Drawdown | Gain needed to break even |
|---|---|
| 5% | 5.3% |
| 10% | 11.1% |
| 20% | 25% |
| 30% | 42.9% |
| 50% | 100% |
| 70% | 233% |
Read the bottom rows again. Past 50%, you are no longer recovering an account, you're rebuilding one, and the honest move is often to accept that. If you want to run your own scenarios, our drawdown recovery calculator walkthrough lets you plug in your actual depth, risk per trade and win rate, and see the realistic timeline instead of the hoped-for one. Most people find the realistic timeline sobering. Good. Sober is the correct state for this phase.
A recovery structure that works:
- Trade the gate. You wrote a recovery gate in containment; honour it. Half risk until ten clean trades and equity above the containment line.
- Step risk back up in halves, not jumps. From 0.5% to 0.75%, then to 1%, each step earned by another clean batch of trades. If any step coincides with new losses beyond norm, drop back a step. Boring. Effective.
- Measure process before profit. During recovery, your primary metric is percentage of trades executed to plan, not P&L. A week of five rule-perfect losers is a good week; the maths pays rule-followers eventually or the strategy was never real.
- Expect the flinch. Somewhere during recovery you'll get a valid setup identical to one that hurt you, and you'll hesitate or skip it. That's normal, it's covered in the drawdown psychology piece, and the practical answer is to take it at minimum size rather than skip it. Skipped valid setups during recovery quietly wreck the maths you're relying on.
And through all of it, keep the possibility of further losses said out loud. Recovery is not owed to you. A real edge plus controlled risk makes it likely over enough trades; nothing makes it certain, and anyone who tells you otherwise, including anyone recovering accounts for money, is lying to you.
Tracking tools: Myfxbook, journals, and alerts
You can't manage what you're not measuring, and self-reported memory is the worst measurement system in trading. Every trader remembers their discipline as better than their log shows. Every single one; we've never seen an exception, including in the mirror. So the tooling matters, and mercifully the good tools are mostly free.
Myfxbook (or FX Blue). Connect your MT4/MT5 account read-only and you get an automatic, unfalsifiable equity curve, drawdown stats, and trade analytics. The two numbers to check weekly: max drawdown (is it still inside historical norms?) and the gap between balance and equity (is floating pain building up off the books?). The read-only part matters for another reason too: if anyone ever manages money for you, or sells you signals, third-party verified results are the minimum standard of proof. It's why our own closed signals, winners and losers alike, sit publicly at /signals/history, because a track record you can't audit is a story, not a record.
A trade journal with a "rule followed?" column. The fancy journaling platforms are fine, but a spreadsheet does the job: date, instrument, direction, planned risk, actual risk, stop respected yes/no, setup valid yes/no, result. The two "actual versus planned" columns are the whole point. Drawdowns caused by discipline leaks are invisible in P&L data and glaring in a journal, usually as a cluster of "no" entries in the same bad week.
Equity alerts. Set an alert, via your broker app, Myfxbook, or a simple EA, at each of your written thresholds: the daily 2%, the weekly 4% and 6%, the 10% containment trigger. The alert's job is to make the threshold breach an event you're notified of, not a realisation you drift into three days late. Drift is how traders end up 18% down while still mentally "around 10%".
The Sunday review, 20 minutes. Curve screenshot, journal scan for "no" entries, open-risk sum, one paragraph of notes. This is the maintenance schedule for everything above, and 20 minutes weekly is the entire ongoing cost of a prevention system that most traders never build.
None of this is glamorous. That's rather the point. Glamour is what the industry sells; measurement is what survives.
When to hand the account to someone else
There's a version of this section that a company offering drawdown recovery services would love to write, where the answer is "immediately, to us". We're not writing that version, because it isn't true and because our own intake process turns people away more often than you'd guess.
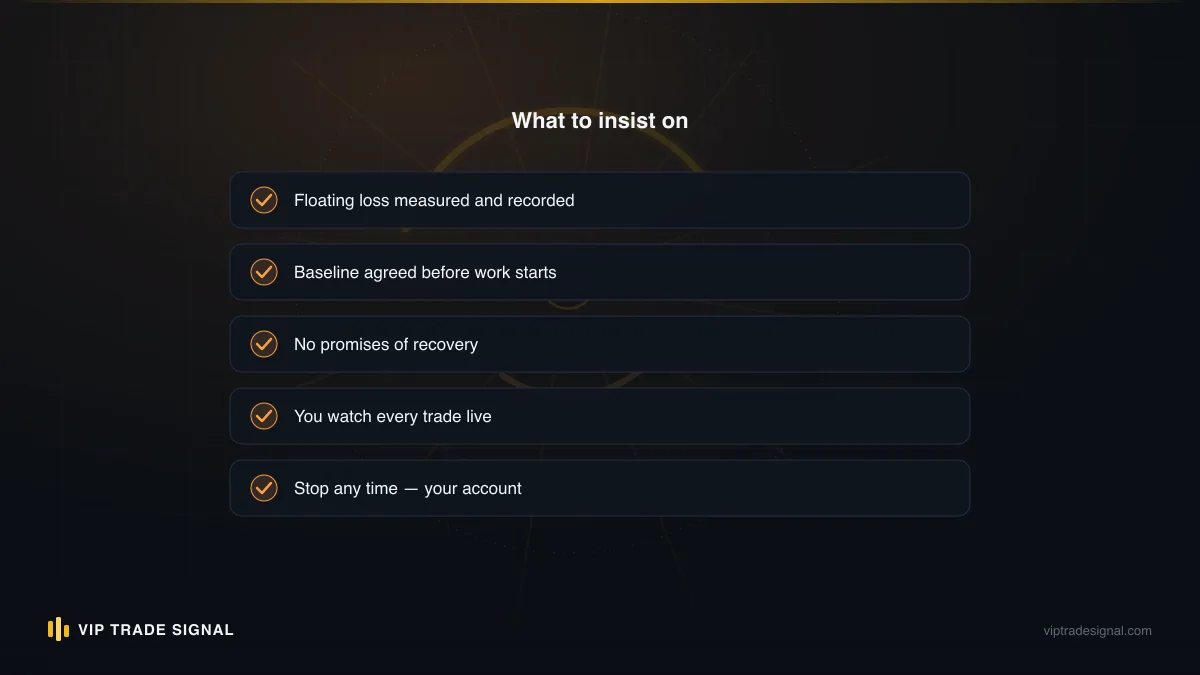
The honest decision tree looks like this. Handing over a drawdown situation makes sense when three things line up. First, the hole is deep enough that professional attention changes the maths, in practice roughly the $5,000-to-$10,000 floating loss region, because below that the fees and effort rarely justify themselves and the containment steps above are genuinely enough. Second, you've demonstrated to yourself, with a journal, not a feeling, that you cannot stop breaking your own rules on this account; the emotional charge of the open loss is driving the bus. Third, whoever you're considering will operate under real constraints: your account stays in your name, you keep the master password and control of withdrawals, the baseline is recorded in writing before anything happens, and they get paid only from actual recovered profit above it.
That last clause is the one that filters the industry. Anyone charging a large fee upfront to "recover" your account has already been paid regardless of your outcome, and their incentive to grind through months of careful half-risk trading is exactly zero. Anyone promising recovery, guaranteed, in any timeframe, is describing something no honest trader can promise; markets don't sign contracts. The structure we run at our drawdown management service is a flat 50% of recovered profit above a jointly recorded baseline, nothing upfront beyond a $200 minimum advance, and no guarantee of anything, stated in writing, because losses remain possible under any management. Fifty percent is a high fee, and we say so plainly on our pricing page; it's the trade-off for low minimums and pay-only-on-results. Whether that trade suits you is a decision to make with a calm head and a calculator, which is why the containment week comes first no matter who ends up trading the account.
And if you're below that threshold, or your journal shows your discipline holding? Keep the account. Run the playbook. The trader who climbs out of a 12% drawdown by their own written rules gains something no service can sell them, which is evidence about themselves that holds up in the next drawdown. There will be a next one. There always is.
A one-page drawdown management plan template
Everything above compresses onto one page, and it should, because a plan you can't see at a glance is a plan you won't follow at speed. Copy this, fill in your own numbers, print it, and put it where you trade.
Prevention (standing rules)
- Risk per trade: ____% of equity (suggest 0.5–1%), sized from stop distance, off equity not balance, rounded down.
- Max total open risk: ____% (suggest 3%). Correlated positions share one budget. One instrument, one direction.
- No new positions in the 60 minutes before NFP, CPI, FOMC.
- Sunday review: curve screenshot, journal scan, open-risk sum, two sentences of notes.
Thresholds and circuit breakers
- Daily: down ____% (suggest 2%) → flat for the day.
- Weekly: down ____% (suggest 4%) → half size until review; down ____% (suggest 6%) → flat until Monday.
- From equity high: down ____% (suggest 10%) → containment protocol, no exceptions, no negotiation.
Containment (triggered, in order)
- Halve all position sizing. Today.
- Freeze anything new: strategies, instruments, providers, deposits.
- Audit open positions: "would I open this today?" Close the failures.
- Written post-mortem of last 20–30 trades: variance, discipline leak, or regime change?
- Write the recovery gate: __ clean trades at half size, equity above containment level.
Recovery
- Half risk until the gate is passed. Step back up in halves, each step earned.
- Primary metric: % of trades executed to plan. P&L is secondary until new equity highs.
- Never: doubled size, removed stops, martingale, revenge deposits.
Hand-off criteria (all three, or none)
- Floating loss roughly $5k+ / deep enough that professional attention changes the maths.
- Journal proves my rules keep breaking on this account.
- Any manager: my account, my master password, my withdrawals, written baseline, paid from recovered profit only, zero guarantees offered.
Ten minutes to fill in. Most traders never do it. Be strange.
Where this leaves you
Here's the uncomfortable summary. Drawdown management in forex and gold trading isn't a technique you deploy when things go wrong; it's the operating system you run all the time, and the part of it that pays best is the part you build while your account is green and the whole subject feels theoretical. By the time it's practical, half the tools are gone.
So the honest measure of this article isn't whether you agreed with it. It's whether, one week from now, you have a filled-in page of thresholds taped up somewhere, a read-only tracker on your account, and a Sunday reminder in your calendar. That's perhaps an hour of total work. Against it, weigh the average cost of one unmanaged drawdown, which for most retail traders is the account.
We'd rather you never need the containment section. Realistically, you will, because losing streaks are woven into how trading works and no signal service, ours included, escapes them; our misses are sitting in public at /signals/history alongside the wins, which is where every service's misses should sit. When your streak arrives, the difference between an annoyance and an ending will come down to a handful of numbers you either wrote down in advance or didn't.
Write them down. Tonight, ideally. The calm version of you is the only one qualified for the job, and there's no guarantee how long they're on shift.