There's a particular moment every trader who sticks around long enough gets to meet. You open the platform, look at the equity figure, and do a bit of quiet arithmetic. The account was $10,000. It now shows $7,000. And a hopeful voice in the back of your mind says: right, we're down 30%, so we need 30% back.
That voice is wrong, and the gap between what it tells you and the truth is the single most misunderstood number in retail trading. Down 30% does not mean up 30% to recover. It means up 42.9%. The drawdown recovery calculator on this page exists to kill that illusion in about four seconds, and this article exists to help you do something useful with the number it hands you.
Because here's the thing most calculator pages won't say out loud: the required-gain figure is the easy part. Any spreadsheet can divide two numbers. The hard questions come after. How long will that recovery realistically take at the returns you actually produce, not the returns you'd like to produce? At what point does grinding it back stop being sensible? And when is the honest answer "not like this, and possibly not alone"? We'll take all three in turn.
What a drawdown recovery calculator actually tells you
Strip away the interface and a drawdown recovery calculator answers one question: given where your equity is now versus where it peaked, what percentage gain do you need on the remaining capital to get back to that peak?
Notice the phrasing. On the remaining capital. That's the whole trick, and it's why the recovery number is always bigger than the drawdown number. When you lose money, you don't just lose the money. You lose the ability of that money to earn. A $10,000 account risking 1% per trade has $100 of risk per position. The same account down at $7,000, still risking 1%, has $70. Your losses shrank your engine, and now the smaller engine has to pull the full load back up the hill.
So the question behind the question, the one you're really asking when you type your numbers in, isn't "what's my break-even percentage". It's "is this hole recoverable by normal trading, or has the maths quietly turned against me?" That's a genuinely different question at 8% down than at 40% down, and the calculator's job is to show you which side of that line you're standing on.
One important note before we go further: be honest about which number you feed it. If you have open losing positions, your relevant figure is equity, not balance. A balance of $9,400 with $2,100 of floating losses is a $7,300 account wearing a disguise. We've written a full piece on why equity versus balance drawdown are different animals, and if you've got a stack of open trades deep underwater, read what floating losses actually mean before you trust any calculator output. Garbage in, comforting garbage out.
The calculator won't judge you. But it will only tell the truth if you do.
How to use it: three inputs, three outputs
Most forex drawdown calculator tools ask for one number and give you one back. Ours asks for three, because one number was never going to be enough to make a decision with.
The three inputs:
- Your drawdown percentage (or your peak equity and current equity, and we'll work it out). Peak means the highest your equity has ever been, not your deposit. If you deposited $5,000, ran it to $6,800, and sit at $5,100 now, you are not "up $100". You're in a 25% drawdown from peak, and your head knows it even if your spreadsheet doesn't.
- Your realistic monthly return. Not your best month. Not what the strategy backtest says. The average of your last six to twelve real months, losing months included. If you don't have that history, use something between 2% and 5%, because that's the honest range for a decent retail trader over time, and anyone telling you 20% a month is sustainable is selling something.
- Your normal risk per trade. This one matters for the sanity check: the calculator will show you what your risk would need to become if you tried to force a faster recovery, which is usually the moment people go a bit pale.
The three outputs:
- Required gain to break even. The headline number. Down 20%? You need 25%. Down 50%? You need 100%.
- Estimated time to recover at your stated monthly return, compounding included. This is the number that turns an abstract percentage into "eight months of disciplined trading", which lands very differently.
- Your zone. Under 15%, 15-35%, or 35%+. Each zone has a different sensible playbook, and the second half of this article walks through all three.
Four seconds of typing. Then the real work starts: believing the output.
The math under the hood: the required gain formula
No mystery here, and you should be suspicious of any tool that pretends there is. The formula is:
Required gain % = drawdown % ÷ (100 − drawdown %) × 100
Lose 25% and you're left with 75% of your capital, so the recovery has to come from that 75%. 25 ÷ 75 = 33.3%. That's it. The entire brutal poetry of drawdown maths in one division.
What the formula hides in plain sight is how viciously non-linear it is. Small drawdowns are nearly symmetric: 5% down needs 5.3% back, barely worth mentioning. But the curve steepens, slowly at first, then all at once.
| Drawdown | Required gain | Feels like |
|---|---|---|
| 5% | 5.3% | A bad week |
| 10% | 11.1% | A bad month |
| 20% | 25% | A bad quarter |
| 30% | 42.9% | A project |
| 40% | 66.7% | A different account |
| 50% | 100% | Starting over, with scar tissue |
| 60% | 150% | Realistically, a redeposit conversation |
| 70% | 233% | The maths has left the building |
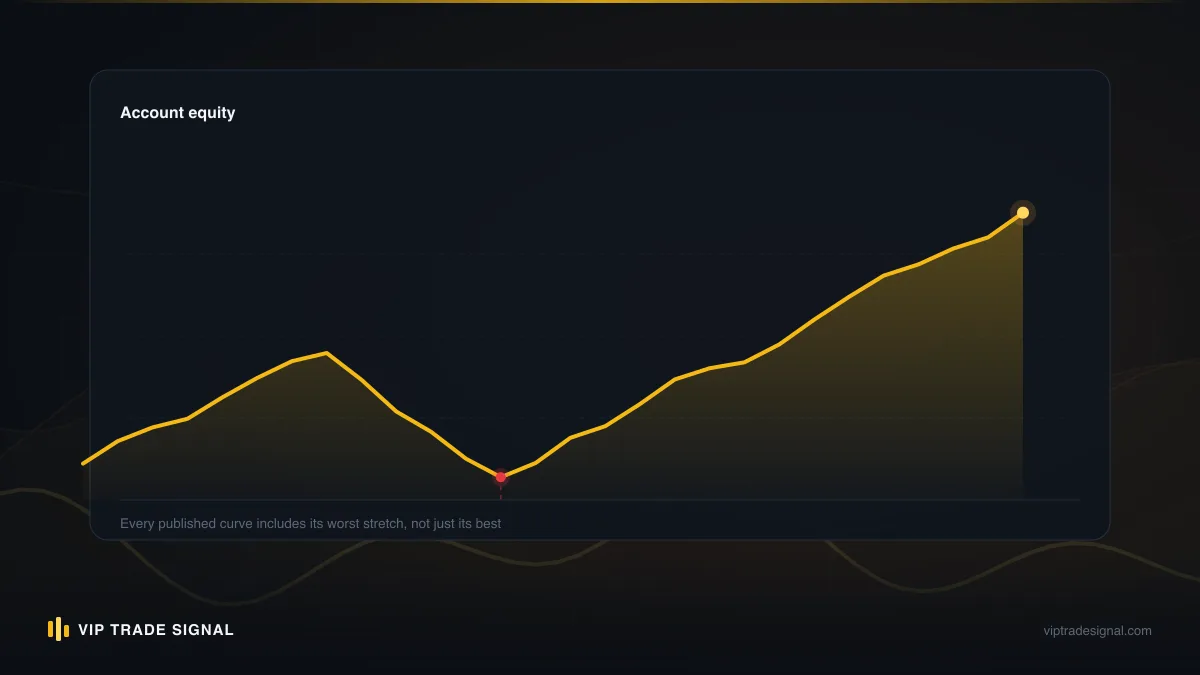
Look at the jump between rows. Going from 20% to 30% drawdown adds ten points of loss but nearly eighteen points of required gain. From 40% to 50% adds ten points of loss and thirty-three points of required gain. Every additional percent you lose costs more than the one before it, which is the strongest argument for hard drawdown limits that exists. Not discipline for its own sake. Arithmetic.
There's a second implication people miss. The curve is why "I'll just win it back" works fine at 10% and becomes fantasy at 50%. It's not that you got worse at trading. It's that the task itself got harder while your capital got smaller. Same trader, same strategy, same edge, and yet the hill is now twice as steep and your legs are half the length. Anyone who tells you drawdown depth doesn't matter because "the edge is the edge" has never sat in a 45% hole with real money.
Time-to-recover: the estimate other calculators skip
Here's where most loss recovery breakeven calculator pages stop, and where the useful thinking begins. A required gain of 43% is meaningless without a timeframe. 43% over three years is a decent, boring, achievable outcome. 43% by Christmas is a gambling plan.
The time estimate works by compounding your realistic monthly return until the hole is filled. The formula, for those who like to see the machinery:
Months to recover = log(peak ÷ current) ÷ log(1 + monthly return)
Say you're 30% down and you honestly average 3% a month. That's log(1 ÷ 0.7) ÷ log(1.03), which comes out at almost exactly one year. Twelve months of consistent, disciplined trading, with no fresh disasters along the way, just to get back to where you already were.
Sit with that for a second, because it reframes everything. How long does drawdown recovery take? At honest retail return rates:
- 10% drawdown at 3%/month: about 3.5 months
- 20% drawdown at 3%/month: about 7.5 months
- 30% drawdown at 3%/month: about 12 months
- 40% drawdown at 3%/month: about 17 months
- 50% drawdown at 3%/month: about 23.5 months
Two years to recover a halved account, and that assumes you never have another losing month, which you will. Realistic recovery timelines run meaningfully longer than the clean compounding figure, because losing months don't just pause the clock, they wind it backwards up that same cruel curve.
And this is precisely why the "realistic monthly return" input matters so much. Feed the calculator 10% a month and every hole looks shallow; a 50% drawdown "recovers" in a bit over seven months. But if 10% a month were actually your sustainable rate, you'd double your money every seven months forever and be reading this from your own island. The calculator is only as honest as its saddest input. Use your real number, the one that includes February, when everything you touched turned to mush.
The time output is the decision tool. A recovery measured in weeks is a trading problem. A recovery measured in years is a structural problem, and structural problems don't get solved by taking better trades on Tuesday.
Reading your result: the three zones
Every output from the drawdown recovery calculator lands in one of three zones, and the zones exist because the correct response changes with depth. What's sensible at 12% down is reckless at 40% down, and what's necessary at 40% down is overkill at 12%.
- Zone 1, under 15% drawdown. Required gain under 17.6%. This is weather, not climate. Normal strategies survive this with normal trading. Your job is to not make it worse.
- Zone 2, 15% to 35%. Required gain between 17.6% and 54%. Recoverable, but not by doing exactly what you were doing, because what you were doing is what dug the hole. Restructure first, then grind.
- Zone 3, above 35%. Required gain north of 54%, recovery time measured in years at honest return rates. This is where pride gets expensive and outside perspective starts earning its keep.
The boundaries aren't magic. 14.9% and 15.1% are the same situation. But the zones force a question most traders in drawdown refuse to ask, which is: what category of problem is this? Get the category right and the tactics mostly pick themselves. Get it wrong, treat a Zone 3 hole with Zone 1 tactics, and you'll spend a year learning what the curve above was trying to tell you for free.
Zone 1 (under 15%): grind-back protocols
First, the good news. If you're here, the maths is still your friend, or at least not yet your enemy. A 12% drawdown needs 13.6% back. At 3% a month that's four to five months. Entirely normal. Every trader who has traded for more than a year has been here, and most decent strategies pass through this zone several times a season without anything being wrong.
The danger in Zone 1 isn't the drawdown. It's your reaction to it.
The classic Zone 1 mistake is escalation. You're down 12%, it feels personal, and the tempting fix is to double risk "just until we're back". We'll put actual numbers on why that backfires in a later section, but the short version: the strategy most likely to move you from Zone 1 to Zone 2 is trying to leave Zone 1 quickly.
So the grind-back protocol is deliberately boring:
- Keep risk exactly where it was, or trim it slightly. If you normally risk 1%, stay at 1%, or drop to 0.75% if your confidence is wobbling. A $8,800 account (that's $10k after 12% down) risking 1% is putting $88 on the line per idea. That's the game now. Play it.
- Change nothing about the strategy mid-drawdown. Zone 1 is within normal variance for almost any real edge. Ten trades at a 50% win rate produce four-loss streaks more often than intuition says. Redesigning the system every time variance shows up is how people end up with no system at all.
- Count trades, not days. "Back to peak in 40 trades" is a plan. "Back to peak by March" is a deadline, and deadlines make traders take trades they shouldn't. The market does not know about March.
- Log the drawdown while it's happening. Entry quality, exit quality, whether losses were plan-losses or mistake-losses. A drawdown made of good trades that didn't work needs patience. A drawdown made of revenge entries at 2am needs a different conversation, possibly with yourself.
And one quiet rule that saves accounts: pre-commit, right now while you're calm, to what you'll do if this drawdown reaches 20%. Write it down. The trader who decides their Zone 2 plan while still in Zone 1 almost always makes a better decision than the one deciding at the bottom, in the dark, angry.
One more Zone 1 habit worth stealing from the desk: shrink the review window to match the drawdown. When we're flat or up, weekly reviews are fine. Inside a drawdown, even a shallow one, we review every session, ten minutes, two questions. Did every trade have a setup? Did every stop stay where it was placed? Two yeses and the day was a good day regardless of the P&L, because in Zone 1 the process is the position. The equity will follow the process back to peak on its own schedule, and no amount of staring at it changes the schedule.
That's it. Zone 1 is not exciting. That's rather the point.
Zone 2 (15-35%): restructure before grinding
Somewhere past 15%, the character of the problem changes. A 25% drawdown needs a 33% recovery, which at 3% a month is nine to ten months of flawless execution from a trader who has just demonstrated, rather publicly to themselves, that execution has not been flawless. Grinding straight back with the same approach is no longer the obvious move. It's a bet that nothing was wrong except luck, and at this depth that bet deserves scrutiny.
A drawdown under 15% is variance. A drawdown over 15% is variance plus something you did, and recovery starts with finding the something.
So before a single recovery trade goes on, Zone 2 gets a restructure. Here's the sequence we'd walk a friend through:
Step one: stop and audit. Take three to five days flat. No positions. Pull every trade from the drawdown period and sort them into two piles: trades your written plan would endorse, and trades it wouldn't. In our experience the second pile explains most of the damage past 15%. Oversized positions after a loss. Entries without a setup because sitting flat felt like losing. Averaging into losers. Widening stops because the trade "just needed room". If the second pile is thin and the drawdown really is clean variance, fine, that's useful to know too, but be a hard grader. You're the defendant here, not just the judge.
Step two: cut risk, don't raise it. This is the counterintuitive one. At 25% down, drop from 1% risk to 0.5% for the first stretch of recovery. Yes, it slows the arithmetic. It also does two things worth more than speed: it caps the damage of any lingering tilt while your judgement recalibrates, and it rebuilds the trade-execute-review loop at stakes your nervous system can handle. Earn the risk back in stages, say returning to 0.75% after twenty clean trades and 1% after the drawdown halves. Recovery is a trust exercise between you and yourself. Trust rebuilds slowly. That's what makes it trust.
Step three: narrow the book. Whatever you were trading, trade less of it. One market, your best setup, your best sessions. This is a big part of why we run a gold-only desk; a single instrument watched properly beats five watched vaguely, and never more so than when the watcher is rebuilding confidence.
Step four: set the abandon line. Decide, in writing, the equity level at which this stops being a Zone 2 grind and becomes a Zone 3 conversation. For most people that's the 35% mark. A restructure without a floor under it is just a slower way of doing the same thing.
Only after those four steps does grinding begin, and it looks exactly like the Zone 1 protocol, just longer and at reduced risk. Months of it. Unglamorous, repetitive, and the only version of drawdown recovery trading strategy that survives contact with real markets.
Zone 3 (35%+): the professional-help conversation
At 40% down you need 67% back. At an honest 3% a month, that's the better part of a year and a half, assuming a year and a half of trading better than you've ever traded, starting from the lowest confidence you've ever had. We're not going to pretend that's a trading plan. It's a hope with a spreadsheet.
So Zone 3 begins with a question nobody enjoys: should you be the one doing the recovering?
Sometimes the answer is genuinely yes. If your audit shows a strategy that works and a single identifiable catastrophe (one news event traded stupidly, one week of tilt, one oversized position), then the fix is containment and a very long Zone 2 protocol. Slow, but sound.
But often the honest answer is one of these three instead:
Option one: reset. Withdraw what's left, or leave it parked, and treat the account as tuition. This sounds like defeat. It's frequently the highest-EV move available, because the alternative is feeding a broken process another year of stress and, quite possibly, another 20% of capital. A trader who resets with $6,000 and a repaired process is in better shape than one grinding a $6,000 hole with the process that dug it.
Option two: recapitalise and restructure. Fresh capital, but only after the full Zone 2 audit, at half risk, with the abandon line set before the first trade. New money into an unexamined process is just Zone 3 with a delay.
Option three: bring in help. This is where we should be upfront, since it's a service we run and you'd smell the omission. Our drawdown management service exists for accounts floating roughly $5k-$10k down: we trade the recovery on your own MT4/MT5 account, you keep the master password and full control of withdrawals, and we charge a flat 50% of recovered profit above a baseline we both record at the start. No recovery guarantees, because nobody honest can offer one, and anyone who does offer one has told you everything you need to know about them. Half of a real recovery beats all of a hope, but whether that trade-off suits you is a judgement call, not a sales line. If you want to talk it through before deciding anything, get in touch and we'll tell you plainly whether your situation is one we'd take on. Sometimes it isn't, and we say so.
Whichever option you pick, pick it deliberately. The one unforgivable Zone 3 move is drifting: no decision, same risk, same process, checking the calculator monthly while the hole quietly deepens. The curve does not drift. It compounds.
Why raising risk to recover faster backfires (with numbers)
Every trader in a hole has run this seductive little calculation: "I risk 1% now. If I risk 3%, I recover three times faster." The logic feels airtight. It's also the most reliable account-killer in the whole recovery playbook, and it fails for two separate reasons that gang up on you.
Reason one: losing streaks scale with risk. Any real strategy has losing streaks; a 50% win-rate system will hit seven consecutive losses more often than feels believable, roughly once every couple of hundred trades. At 1% risk, seven straight losses costs about 6.8% of equity. Unpleasant, survivable. At 3% risk, the identical streak costs about 19.2%. The same trades, the same market, the same edge, and one version nudges your drawdown while the other transforms it. Now remember where you're starting: already 25% down. The 1% trader who hits the streak sits at roughly 30% down, bruised but in Zone 2. The 3% trader sits past 39% down, in Zone 3, needing a 65% gain, having tripled risk specifically to avoid ending up there.
Reason two: the curve punishes the failure asymmetrically. This is the subtle one. Because required gain is non-linear, extra drawdown taken in a failed fast-recovery attempt costs more than the same drawdown cost the first time. Losing your first 10% created an 11.1% recovery job. Losing 10% more when you're already 25% down takes the job from 33% to 53.8%, a twenty-point jump for the same ten points of loss. Raising risk in a drawdown is betting bigger at exactly the table position where losses are most expensive. A casino could not design it better.
There's a psychological compounder too, though it needs less arithmetic: trading 3% risk feels different. Stops get moved. Winners get cut early because the open profit is suddenly large and terrifying. The strategy you tested at 1% is not the strategy you're now running, so even the "edge" in your recovery maths is borrowed from a system you're no longer trading.
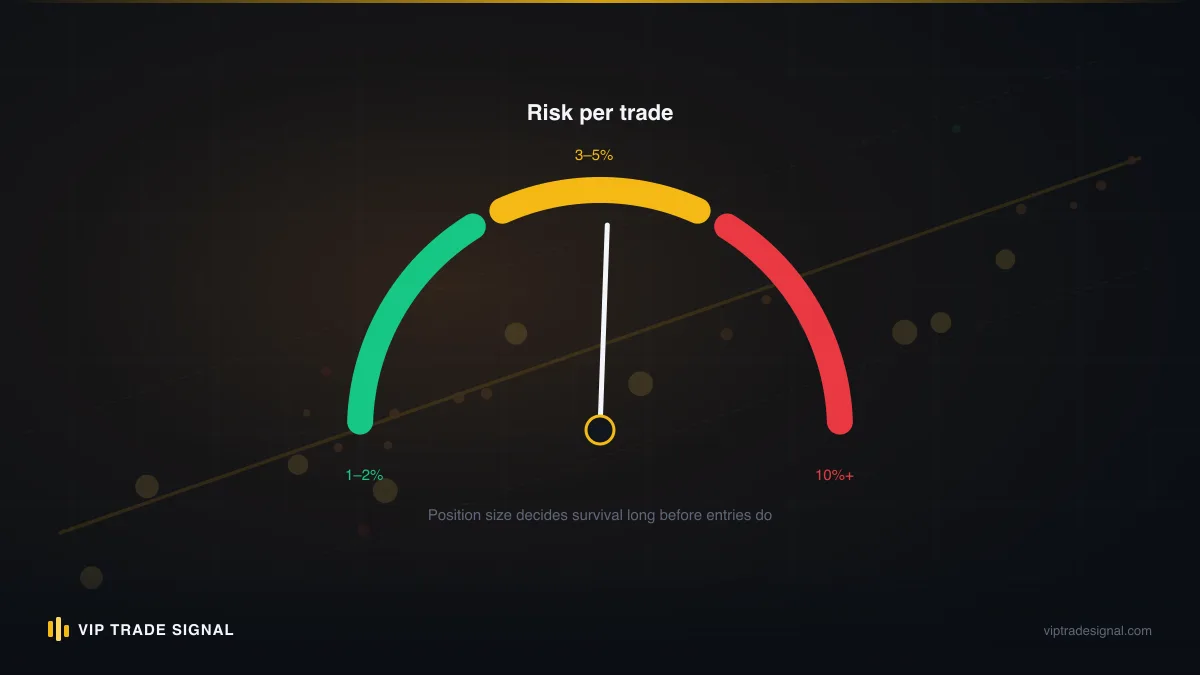
The professional pattern is the exact inverse, and it's worth stating baldly: real desks cut risk in drawdown, mechanically, and scale back up only as equity recovers. Half risk below 15% down, quarter risk below 25%. It reads timid. Play the arithmetic out over enough losing streaks and it's the difference between the traders who are still around and the ones with a great story about the year they nearly made it all back in a month.
If you take nothing else from this piece, take the exercise: before you raise risk to recover, run the failure case through the calculator first. Not the success case, which is what your imagination will volunteer. The failure case. Where does an ordinary bad fortnight at the new risk level leave you, what does the required gain become from there, and how many months does that add at your honest return? If you can look at that output and still want the trade, at least you're choosing it with open eyes. Almost nobody can.
Slower is faster here. Not as a slogan. As a sum.
Worked examples at 10%, 30% and 50% drawdown
Formulas persuade nobody. Let's run three traders through the full calculator and the full framework, start to finish. All three are invented, all three are recognisable.
Sam: 10% down. Sam runs a $10,000 account, now at $9,000 after a rough month of gold longs into a falling market. Required gain: 11.1%. At Sam's honest average of 3% a month, time to recover: about 3.6 months. Zone 1. The playbook: change nothing. Risk stays at 1% ($90 a trade on current equity), the strategy stays as designed, and Sam writes one sentence in the journal: "If this reaches 20%, I stop and audit." The biggest risk to Sam is not the market. It's Sam deciding 3.6 months is too long and discovering, via a fortnight at 3% risk, what Zone 2 looks like. If Sam simply keeps showing up, this drawdown will barely make the year-end review.
Priya: 30% down. Priya's $20,000 is now $14,000, the result of a decent strategy traded well for six months and then badly for six weeks (the audit will later show four oversized trades did most of the damage). Required gain: 42.9%. At 3% a month: twelve months clean, realistically fourteen or fifteen with normal losing months. Zone 2, comfortably inside it. The playbook: a full week flat, the two-pile audit, risk cut to 0.5% (that's $70 a trade on $14,000, which will feel insultingly small, and that feeling is part of the treatment), book narrowed to her best setup only, and an abandon line written down at $13,000, the 35% mark. Then the grind: earn back 0.75% risk after twenty clean trades, 1% when the hole halves to 15%. Priya's recovery is a year-long project with a real chance of success precisely because she's treating it as a project, not an emergency.
Marcus: 50% down. Marcus deposited $16,000 and holds $8,000, most of the damage from averaging into one catastrophic short and then revenge-trading the aftermath. Required gain: 100%. At 3% a month: twenty-three and a half months, sustained, from a process that just produced a halving. Zone 3, no ambiguity. The honest options: reset and rebuild the process before recommitting a pound; recapitalise only after a genuine audit, at half risk, with a hard floor; or hand the recovery to someone whose process isn't the one that dug the hole, on terms where they only get paid from actual recovered profit. What Marcus must not do is the thing he most wants to do, which is raise risk to 4% and "trade his way out by summer". Run that plan through the previous section: one ordinary seven-loss streak at 4% takes $8,000 to roughly $6,000, a 62.5% total drawdown, required gain 167%. The plan to escape Zone 3 in months is, in expectation, the plan to make Zone 3 permanent.
Three traders, one formula, three completely different correct answers. That's the entire argument for running your own numbers instead of borrowing someone else's confidence. Trading leveraged products can produce any of these three outcomes and worse; the calculator doesn't prevent drawdowns, it just stops you lying to yourself about the one you're in.
Recheck cadence during an active recovery
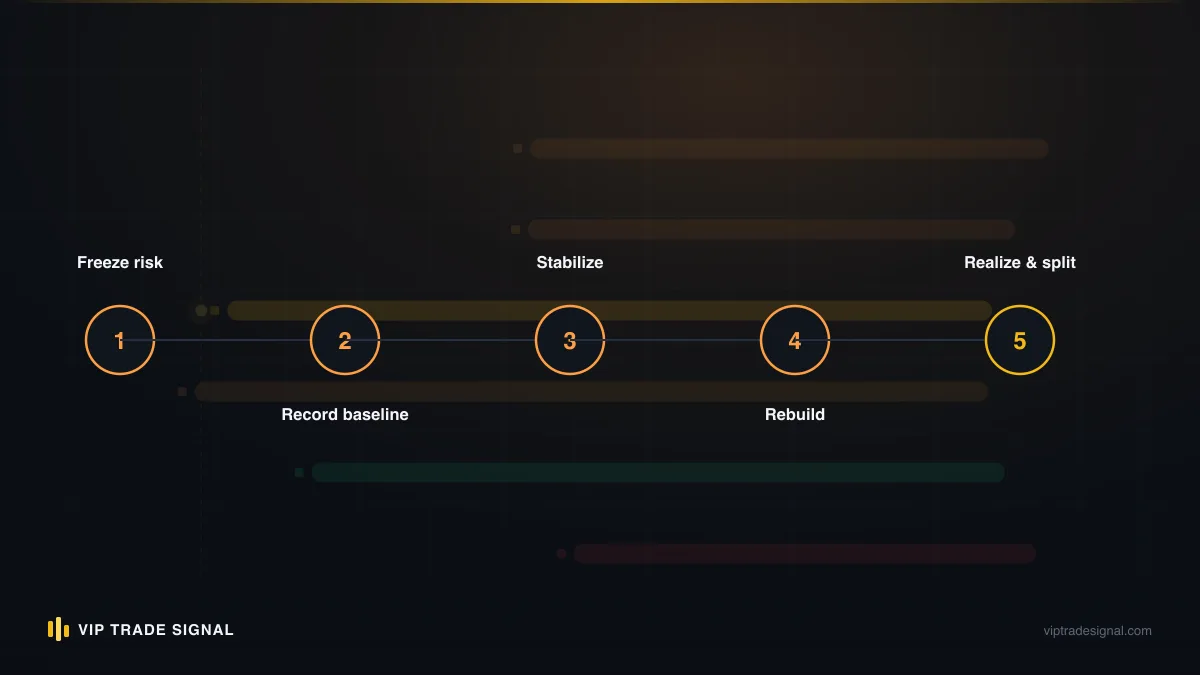
A recovery isn't a decision you make once. It's a position you manage, and like any position it needs a review schedule that's frequent enough to catch drift and infrequent enough that you're not marking your emotional state to market every four hours.
Our suggestion: rerun the calculator monthly, on the same date, and log three numbers. Current drawdown from peak, required gain remaining, and actual average monthly return over the recovery so far. That last one is the honesty engine. If you planned the recovery around 3% a month and four months in you're averaging 1.2%, the calculator will quietly re-price your twelve-month project as a thirty-month one, and you want that news early, while the response can still be calm.
A few rules for the recheck that earn their keep:
- A new equity low during recovery is a tripwire, not a data point. If the drawdown deepens past your written abandon line, the plan fires. No renegotiating with yourself at the bottom. The line was set by a calmer, smarter version of you, and that version outranks the current one.
- Zone demotions beat zone promotions to the punch. Crossing down from Zone 1 into Zone 2 triggers the restructure immediately, mid-month or not. Crossing up, from Zone 2 back into Zone 1, waits for the scheduled recheck to confirm. Bad news acts fast, good news gets verified. And yes, that asymmetry is deliberate.
- Track trades-to-recovery, not just time. If your plan is 0.5% risk and roughly 40 clean trades per 5% of recovery, the monthly log should show trade counts. A month with three trades isn't a slow month, it's a plan not being executed, which is different information.
- Don't recheck daily. The number moves with every tick and none of the moves mean anything at daily resolution. Watching your required gain fluctuate in real time is a machine for manufacturing tilt. Monthly. Same date. Move on.
The pattern to watch for across rechecks is the quiet one: drawdown flat, months passing, return trickling in below plan. Nothing dramatic, nothing to trigger any tripwire, just a recovery that isn't recovering. Three consecutive rechecks like that is its own signal, and the honest response is to treat it as a zone demotion even though the number never moved.
The number is the easy part
Here's where this leaves you. The drawdown recovery calculator will hand you three outputs in a few seconds: required gain, time at your honest return, zone. The formula behind it fits on a beer mat. None of that was ever really the hard bit.
The hard bit is that the output is usually worse than the story you'd been telling yourself, and the entire value of the exercise lives in what you do inside that gap. The trader who's 30% down and believes they're "a good week away" makes reliably terrible decisions. The one who knows it's a twelve-month project at honest returns makes different ones: smaller risk, narrower book, written tripwires, no deadlines. Same account, same market, and over a year those two traders end up in different postcodes.
So, three moves, in order:
- Run your real numbers today. Equity, not balance. Peak, not deposit. Your actual average monthly return, February included.
- Name your zone out loud and adopt its playbook, including the one clause every zone shares: the written line where the plan changes.
- Put the recheck in your calendar before you close this tab. Monthly, same date, three numbers logged.
And if the calculator puts you deep in Zone 3, sitting $5,000 or more underwater and staring at a multi-year grind, then let the number do its final job and force the bigger conversation, whether that's a reset, a restructure, or handing the recovery to a desk that charges from recovered profit and nothing else. What the number will not do is improve while you look away from it.
You now know your real break-even. The only question left is whether the plan you're running today has any realistic chance of reaching it, and you're the only person who can answer that honestly. Preferably before the next recheck.