There's a particular kind of account statement we see more than any other. The balance line is beautiful. It steps upward in tidy little increments, month after month, not a single losing week visible anywhere. And underneath it, if you know where to look, the equity line is a cliff face. The account shows a 2% balance drawdown and a 45% equity drawdown at the same moment, on the same money, from the same trades.
Both numbers are technically correct. Only one of them can margin-call you.
Understanding equity drawdown vs balance drawdown is not an academic exercise. It's the difference between reading an account honestly and being lied to by your own trading platform. It's the number prop firms actually breach you on, the number your broker's margin engine actually watches, and the number every grid and martingale vendor works very hard to keep you from seeing. If you've ever looked at a Myfxbook page with a 90% win rate and a suspiciously smooth gain line and felt something was off but couldn't name it — this is the thing you were sensing.
Two drawdowns, one account
Start with the two definitions, because almost every confusion downstream comes from blurring them.
Balance is the cash value of your closed trades. Deposit $10,000, close a trade for +$300, your balance is $10,300. Open a new trade that's currently losing $2,000? Balance doesn't move. It only changes when a position closes and the profit or loss becomes realised.
Equity is balance plus the floating profit or loss of everything currently open. Same account: balance $10,300, open trade floating at −$2,000, equity is $8,300. Equity is what your account is actually worth if everything closed this second. It's the liquidation value.
Drawdown, in either flavour, measures the drop from a peak to a subsequent trough. So:
- Balance drawdown is the decline in your closed-trade balance from its highest point. It only grows when you actually close losers.
- Equity drawdown is the decline in your real-time account value from its highest point, open positions included. It grows the moment a trade moves against you, whether or not you ever close it.
On an account with no open positions, the two are identical. The instant you open a trade, they can diverge. And on certain styles of trading, they don't just diverge; they live on different planets.
Here's the uncomfortable core of it. A trader who refuses to close losers can keep balance drawdown at zero indefinitely. Every trade that goes their way gets closed for a small win; every trade that goes against them gets held, "waiting for it to come back". The balance chart shows a flawless staircase. Meanwhile the held losers stack up as floating loss, equity sinks, and the account drifts toward the one event that finally reconciles the two numbers: the stop-out, where the broker force-closes everything and forty-five percent of equity drawdown becomes forty-five percent of very real balance drawdown, all at once.
A flat balance line above a sinking equity line isn't a track record. It's a countdown.
That's the picture in one sentence. Now the detail.
How balance drawdown is measured
Balance drawdown is the friendly one, which is exactly why marketing prefers it.
The mechanics are simple. Track the running peak of the account balance. Whenever the balance falls below that peak, the gap is the current balance drawdown; the largest such gap over the account's life is the maximum balance drawdown. If your balance peaked at $12,000 and later sat at $10,800 after a string of closed losers, that's a $1,200 drawdown, 10% of the peak.
Notice what has to happen for this number to move: a losing trade has to actually close. Realisation is the trigger. A trader with iron discipline and hard stop-losses will produce a balance drawdown that tracks reality fairly closely, because their losers get realised quickly and show up in the number within hours.
A trader without stops produces something else entirely. Say Sam, a trader we'll invent for the afternoon, runs a $10,000 account and takes profits at +30 pips religiously but has no exit plan for losers. Over three months Sam closes 60 winners averaging $50 each. Balance: $13,000, drawdown on the balance line: essentially nil, because nothing losing has ever been closed. Sam's statement, filtered to closed trades, is the sort of thing that gets screenshotted into a Telegram channel.
What the screenshot doesn't show is the eleven open positions from those same three months, each one a trade that went the wrong way and got held. Their combined floating loss is $4,100. Sam's equity is $8,900, below the starting deposit, while the balance reads $13,000 and the "win rate" reads 100%.
This is why balance drawdown, on its own, is close to meaningless for judging risk. It's not that the number lies, exactly. It answers a real question: how much realised money has been given back from the peak. It just answers it in a way that a trader (or a signal vendor, or a fund manager) can game completely by simply not closing losers. Any drawdown figure that a participant can suppress at will, without reducing actual risk by a single dollar, is not a risk measure. It's a formatting choice.
Balance drawdown does have honest uses. On a fully-stopped strategy where every trade carries a hard stop and positions don't linger, it's a decent proxy for realised pain, and it's what you'll reconcile against your bank withdrawals. But as a health check on a live account with open positions, it ranks somewhere below useless, because "below useless" is what you call a gauge that reads fine right up until the engine seizes.
How equity drawdown is measured
Equity drawdown uses the same peak-to-trough logic but applies it to the number that matters: the mark-to-market value of the account.
Track the running peak of equity (balance plus floating P/L) and measure every dip below it. Because equity updates tick by tick, equity drawdown captures the full journey of every trade, not just its ending. A position that went 400 pips against you before crawling back to break even leaves no trace on the balance line. On the equity line it's a visible trench, and it should be, because for the hours or days you sat in that trench, the money was genuinely at risk. If the market had kept going, the loss was real. The fact that it came back doesn't retroactively make the risk imaginary.
Run the numbers on Sam's account and the picture inverts. Peak equity was $11,200 back in week three, before the losers started stacking. Current equity is $8,900. That's a $2,300 fall: an equity drawdown of about 20.5% and still growing, on an account whose balance-based statement shows nothing but wins. And 20.5% is the current reading; if any of those eleven positions spent time deeper underwater than they are now, the maximum equity drawdown is worse.
A few practical notes on measuring it, because the details bite:
- Equity drawdown is usually quoted from peak equity, not from deposit. An account that grew from $10,000 to $14,000 and then sank to $9,800 is in a 30% equity drawdown even though it's "only down $200" on the deposit. The peak is the reference because that $14,000 was yours (you could have withdrawn it) and the strategy gave it back.
- It's a high-water mark, so it can only ratchet. Maximum equity drawdown never improves. A strategy that once hit 55% equity drawdown carries that number forever, and should.
- Tick data matters. Platforms that sample equity every hour or on trade events will miss the worst intraday spike. The genuinely ugly moment, the 3 a.m. wick during a news release, often lives between the samples. Myfxbook and MT4/MT5 both understate the true worst point for this reason; the real number is whatever the deepest tick was.
If you take one habit from this article, make it this: whenever anyone shows you a drawdown figure (a signal service, an EA vendor, a money manager, your own journal), your first question is balance-based or equity-based? If they don't know, they've told you something. If they know and won't say, they've told you more. We publish every closed signal, wins and losses alike, on our history page, and even there we'd tell you the same thing: closed-trade records describe outcomes, and only an equity line describes the risk that was taken to get them.
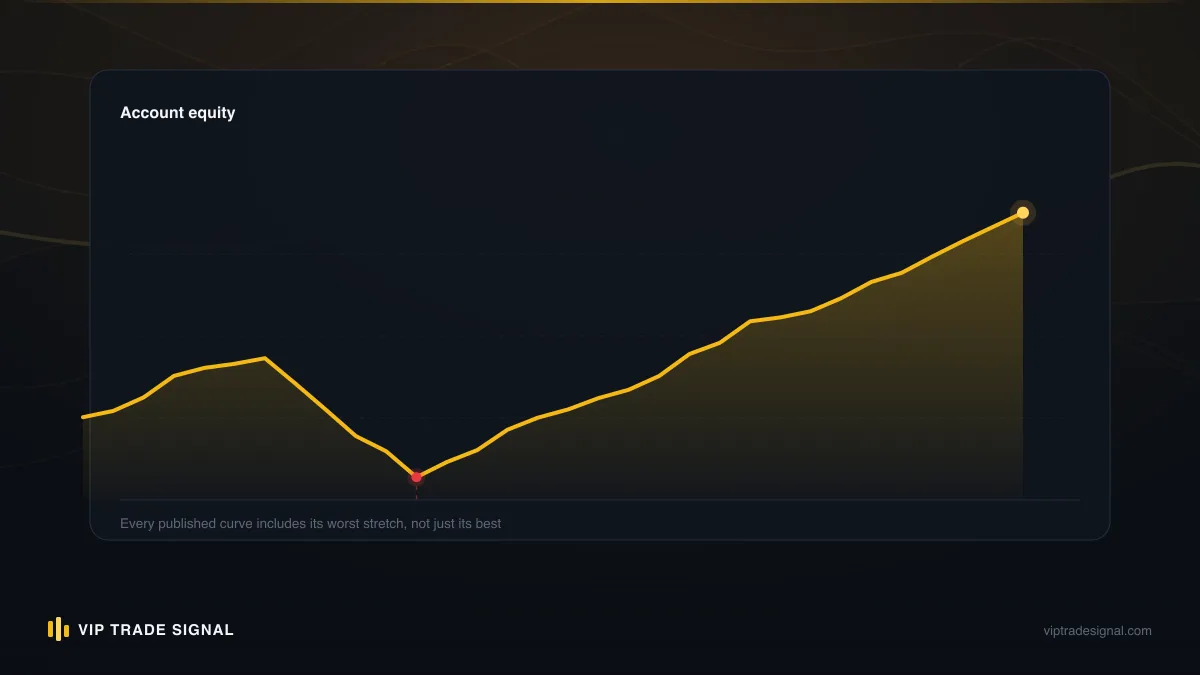
Equity drawdown vs balance drawdown: the open-position gap
The gap between the two drawdowns has a name: floating loss, sometimes called floating drawdown when you express it against the peak. It is exactly the unrealised red on your open positions, and it behaves in ways that trip up even experienced traders.
First, it's asymmetric in practice. Floating profit rarely accumulates, because winners get closed; that's what taking profit means. Floating loss accumulates whenever a trader hesitates, hopes, or "manages" a position by waiting. So on most retail accounts the equity line spends most of its life at or below the balance line. The gap almost always points one way: down.
Second, the gap compounds quietly. One open loser floating −$300 is a rounding error on a $10,000 account. But floating losses attract company. The trader who held one loser holds the next one too, because the psychology that produced the first hold produces every subsequent one, and each new held position adds its own floating loss and its own margin requirement. Three months later there are eleven open tickets, the gap is $4,100, and closing any single one of them feels pointless because it barely dents the total. This is how floating loss affects account equity in the real world: not as one dramatic bad trade, but as sediment.
Third, and this is the part that catches people, the gap consumes your capacity to trade long before it consumes your account. Free margin, the room you have to open new positions or absorb further adverse movement, is calculated from equity, not balance. Every dollar of floating loss is a dollar less of buffer. An account can have a five-figure balance and be unable to open a 0.10-lot position, because the floating losses have eaten the equity down to the margin already posted. The trader experiences this as the platform mysteriously refusing orders. The platform is not being mysterious. It's reading the real number.
There's a simple bit of arithmetic worth internalising:
Equity = Balance + Floating P/L, therefore Equity drawdown ≈ Balance drawdown + Floating loss (both measured against the relevant peaks). The gap between the two published drawdown figures is the floating loss, restated. When you see a strategy advertising 4% drawdown, and an equity-based audit shows 38%, nobody miscounted. The missing 34 points are sitting in open positions, right now, waiting for a resolution that will be either a miracle or a margin call. We wrote up the mechanics of floating losses on their own at /blog/floating-loss-forex if you want the deeper treatment, including how swap charges make an old floating loss cost you money every night it stays open.
Case study: flat balance, sinking equity
Let's build the full statement, because the abstract version never lands as hard as the ledger does. Everything here is illustrative, a composite of the pattern rather than any client's account, but if you've spent time around rescued accounts you'll recognise every line of it.
A trader we'll call Farid opens a $20,000 account in January and buys an EA, one of the "smart hedging" ones, that trades gold. The logic underneath the branding is a grid: buy, and if price falls 200 points, buy again bigger, and again, harvesting small profits whenever price bounces enough to close a basket.
Here's the month-by-month picture:
| Month | Balance | Closed P/L (month) | Open positions | Floating P/L | Equity | Equity DD from peak |
|---|---|---|---|---|---|---|
| Jan | $20,760 | +$760 | 0 | $0 | $20,760 | 0% |
| Feb | $21,540 | +$780 | 2 | −$900 | $20,640 | 4.2% |
| Mar | $22,310 | +$770 | 4 | −$2,600 | $19,710 | 8.5% |
| Apr | $23,050 | +$740 | 7 | −$5,900 | $17,150 | 20.4% |
| May | $23,820 | +$770 | 11 | −$9,400 | $14,420 | 33.1% |
| Jun | $24,560 | +$740 | 15 | −$13,300 | $11,260 | 47.7% |
Read the balance column alone and this is a dream: six green months, roughly $760 a month, never a losing period, a balance drawdown of zero. This is the column the EA vendor screenshots. It's the column Farid emails to his brother in April with the words "finally found something that works".
Now read across. Peak equity was $21,540 in February. By June, equity is $11,260, an equity drawdown pushing 48%, because gold trended, the grid kept averaging into the trend, and each "profitable" month was funded by rolling the real losses forward into an ever-larger open basket. The account hasn't made $4,560. It has lost roughly $8,700 of real value while realising $4,560 of decoration.
The ending writes itself. In early July gold runs another 3% without a meaningful pullback. The basket's floating loss blows past the margin available to support it, the broker's stop-out triggers at 50% margin level, and fifteen positions close at market in one cascade. Farid's balance, that pristine staircase, reprices to about $9,100 in a single afternoon. Six months of 0% balance drawdown becomes a 62% balance drawdown in four hours, which is to say: the equity drawdown was the truth all along, and the balance line just took six months to admit it.
Two details deserve underlining. The stop-out never happens at a kind price; by construction, it happens at the worst price the account survived to see. And the psychological damage front-runs the financial: by May, Farid knew. Most people in this position know months before the end. The flat balance line isn't fooling them anymore; it's the thing they hide behind when they can't face closing the basket. That's the stage where the account is still genuinely salvageable, and it's precisely the stage where our drawdown management service does its work: accounts floating $5,000–$10,000 down, structured exit of the basket, fee charged only as 50% of profit actually recovered above a baseline we record together on day one. No recovery is ever guaranteed, and we say that in writing before touching anything, because a service that guarantees recovery from a 48% hole is running the same con as the EA that dug it.
Why prop firms track equity, not balance
If you want to know which drawdown number the professionals consider real, look at who has actual money at stake on the answer. Prop firms fund traders with the firm's capital, so they've thought harder about drawdown measurement than almost anyone. And with one voice, the serious ones measure equity.
The standard prop firm rule set looks something like: maximum daily loss 5%, maximum overall loss 10%, both computed on equity (some firms compute the daily figure against the day's starting equity, others against balance-or-equity-whichever-is-higher; read your specific rules, the details vary and they matter). The overall limit is often trailing: it follows your equity high-water mark up, so a trader who grows a $100k account to $110k might now breach at $100k rather than $90k.
Why equity? Because a balance-based limit would be an open invitation to exactly the behaviour in Farid's statement. A funded trader with a balance-only drawdown rule could hold losers indefinitely, keep the measured drawdown at zero, and let the firm's capital absorb unlimited floating risk. The firm would be blind to the danger until stop-out. No business that survives its first year measures its risk that way. Equity-based measurement means the breach happens the moment the value of the account crosses the line, mid-trade, wick included. Many a funded trader has been breached by a position that later came back to profit, and every one of them felt robbed, and every one of them was measured correctly.
There's a lesson in the resentment, actually. Traders hate equity-based rules because equity-based rules price the journey, not just the destination. "But it would have come back" is the eternal cry, and it's unfalsifiable in the individual case and dead wrong as a policy. Sometimes it doesn't come back. The firm can't fund "sometimes".
Turn the logic on yourself. You are, functionally, a prop firm with one trader. Your savings are the firm's capital; your trading is the trader. If the arrangement only works when the risk manager measures balance and looks away from equity, the arrangement doesn't work. Run your own account on the rule the funders use: a hard equity drawdown limit, trailed from your high-water mark, breached means flat and reassess. Ours, for what it's worth, sits well under what most prop firms allow, because gold moves too fast to give it 10% of room, but the exact number matters less than the fact that it's equity-based and actually enforced.
Grid and martingale: engines of hidden equity drawdown
It's worth being blunt about which strategies produce the flat-balance, sinking-equity signature, because the pattern isn't random. It is the designed output of two families of systems: grid and martingale, plus their hybrids, which dominate the retail EA market precisely because of the statement shape they produce.
A quick sketch of each:
- Martingale doubles (or multiplies) position size after a loss, so that any eventual win recovers everything plus a small profit. Sequence: lose 0.10, open 0.20, lose, open 0.40, lose, open 0.80... one bounce and the whole ladder closes green.
- Grid places orders at fixed intervals against the move (buy every 200 points down, say), accumulating an averaged position that closes profitably on any decent retracement. No doubling required, though most commercial grids scale the size anyway.
- "Hedged recovery" systems open opposing positions around a loser and juggle the pair, which sounds sophisticated and is mostly a grid wearing a suit: the floating loss doesn't go away, it just gets distributed across more tickets.
All three share one property: they convert losing trades into held trades. Losses are never realised; they're refinanced. And that single property mechanically manufactures the divergence this whole article is about. The closed-trade record shows a stream of small wins near a 100% win rate, because by construction the only trades that close are winners (until the final day, when everything closes at once). The equity line shows the truth: an account riding an ever-larger open position against an ever-longer trend, with a loss profile that isn't a distribution so much as a cliff.
The seductive part (and grids are genuinely seductive, we'd be lying to say otherwise) is that the strategy works most of the time. Markets range more than they trend. A gold grid can print tidy profits for eight months, ten months, long enough for the trader to raise the stake, tell friends, maybe compound the account. Then comes the trend that doesn't pull back. Gold has produced multiple 8–12% one-directional runs in recent years; each one was a scythe through the grid community. The strategy's true cost is concentrated in one rare event, which means the flat-balance months aren't profit — they're premium collected for having sold insurance against a move that eventually happens. Anyone measuring balance drawdown sees the premiums. Only equity drawdown sees the policy.
You can identify these systems from a public track record in about thirty seconds, even when the vendor hides the strategy. Win rate above 85% with average losses several times average wins; "open trades" on Myfxbook showing clusters of same-direction positions at stepped prices; a gain line that's eerily smooth while the drawdown chart, the equity-based one, shows deep periodic trenches. If a signal provider's history shows no losses at all, you are not looking at a strategy without losses. You're looking at a strategy that hasn't closed them yet.
Which number your broker's margin engine watches
Everything above is analysis. This section is mechanics: the part where the platform stops keeping score and starts acting.
Your broker's margin engine watches exactly one derived number: margin level, which is equity divided by used margin, expressed as a percentage. Balance appears nowhere in the formula. An account with a $50,000 balance and $2,000 of equity is, to the margin engine, a $2,000 account, full stop.
Two thresholds live on this number, and it pays to know yours precisely; they're in your broker's spec pages, and they differ meaningfully between firms:
- Margin call, commonly at 100% margin level (some brokers 80% or 120%): equity has fallen to equal the margin posted on your open positions. In the old days someone telephoned you; now the platform turns your account red and blocks new positions. It's a warning, nothing has closed yet.
- Stop-out, commonly at 50% (anywhere from 0% to 50% across brokers): equity has fallen to half the posted margin, and the broker begins force-closing your positions at market, worst loser first, repeating until the margin level recovers above the threshold or nothing remains.
Walk through a live example, because the speed surprises people. You hold 2.0 lots of XAU/USD at 1:200 leverage with gold at $3,300: used margin is $3,300. Suppose your equity currently stands at $8,000. Margin level: 242%. Feels comfortable. But 2.0 lots of gold moves $200 per $1.00 of price movement. Gold falls $16, an ordinary session, not even a news day, and equity drops $3,200 to $4,800: margin level 145%. Another $7.50 of downside and you're at margin call. Nine dollars beyond that, a single unfortunate hour or one CPI print, and the stop-out engine is closing your positions at whatever the market will pay during the very move that hurt you.
Notice what never entered the story: balance. It could have been $8,000 or $80,000 of realised history; the engine priced only the equity in front of it. This is the precise sense in which equity drawdown is the drawdown. Balance drawdown is a report about the past. Equity drawdown is an input to a machine that closes your trades. When people ask us why we bang on about balance vs equity in forex like it's a moral issue, this is why: one of these numbers has an enforcement mechanism attached. We've written a fuller primer on the balance/equity/margin triangle at /blog/equity-vs-balance-forex if the terms themselves are still settling.
One more wrinkle worth knowing: weekend and rollover gaps. Stop-outs assume a market to close into. Gold gapping $30 at the Sunday open can take equity through the stop-out level before the engine can act, and the positions close at the gapped price, not the threshold price. On rare occasions that leaves a negative balance. Most reputable retail brokers in most jurisdictions offer negative balance protection and reset you to zero. But "reset to zero" is a strange thing to be grateful for, and the protection exists precisely because equity, unlike balance, can move faster than anyone can react.
Monitoring both on MT4/MT5 and Myfxbook
Knowing which number matters is worth little if you only look at it after the damage. Here's how to actually watch both, with the specific fields and their traps.
On MT4/MT5, live: the Trade tab of the Terminal window shows Balance, Equity, Margin, Free Margin and Margin Level on one line, updating tick by tick. The habit to build is embarrassingly simple: read equity, not balance, as "my account". Better, track the gap. Balance minus equity is your total floating loss; write it down daily if you hold positions overnight. A gap that grows week over week is the sediment forming. On mobile, the same figures sit at the top of the Trade screen.
On MT4/MT5, historically: here's the trap. Right-click in Account History and generate a statement, and the drawdown figures in the summary are computed from closed-trade balance data. The detailed report's "Maximal Drawdown" on a live account with a history of held losers can read a serene 3% while the account lived through 40% equity excursions. The platform isn't lying; it's answering the balance question because that's the data the report uses. The equity journey between trade closes simply isn't in the history file. For the true equity picture you need something that recorded equity as it happened, which is where third-party tracking earns its keep.
On Myfxbook (or FX Blue, or your prop firm's dashboard; same principles):
- The headline "Drawdown" figure on a Myfxbook page is equity-based and tracked from connected data, which makes it far more honest than any self-generated MT4 statement. Respect it.
- But check "Open Trades" anyway. Myfxbook can only chart the equity it witnessed; deep intratick spikes between updates get smoothed, and an account currently carrying a large open basket shows that pain in the open-trades tab before it fully shows in the drawdown history. A gain curve that's smooth plus an open-trades tab full of stacked same-direction losers equals a drawdown figure that's about to get worse.
- Check the track record start date against the account's real age. A common laundering move is connecting the tracker after the ugly period, or resetting it entirely. Verified track record, verified trading privileges, and a start date that matches the broker history. All three or it didn't happen.
For your own accounts, a plain spreadsheet does most of this: date, balance, equity, floating P/L, margin level, five entries, thirty seconds a day. The single most useful risk chart a discretionary trader can keep is their own daily equity line with the balance line laid over it. When the lines hug, you're realising your losses like an adult. When they diverge, you have your answer before any dashboard tells you. And the question of what to actually do about a wide gap comes down to structured basket reduction, which we cover honestly (including when the right answer is just closing everything) in our FAQ.
Closing the gap safely
Suppose the audit stings. Balance $13,000, equity $8,900, eleven open losers, gap of $4,100 and widening. What now? Because "close everything at market this instant" is clean advice that almost nobody follows from a deep hole, and pretending otherwise helps no one.
The honest menu has four options, and only four:
- Close everything now. Realise the $4,100, take the balance to $8,900, and start again with full margin, a clear head and a rule that prevents recurrence. Financially this is very often the best move, because every alternative pays ongoing costs (swap charges nightly, margin locked, opportunity gone, tail risk live) to maybe avoid a loss that has already economically happened. The equity is $8,900 today whether you press the button or not. Pressing it changes nothing but the honesty of the ledger. And yet almost nobody does it in one go, because realising a loss feels like creating one. It isn't. The creation happened months ago.
- Close in stages, worst first. Rank the open positions by a blend of size, distance from market, and swap cost, and close the most toxic 20–30% now, the next tranche on any retracement, the rest on a schedule you write down before you start. This converts one unbearable decision into five tolerable ones. The discipline is the schedule: staged closing without a written schedule is just holding with extra steps.
- Reduce and offset. Trim position sizes, let correlated positions net against each other, use small opposing positions to cap the basket's delta while you unwind. Genuinely useful in skilled hands, and genuinely dangerous otherwise, because "hedging the basket" is the exact story every recovery grifter tells. The test is simple: is total open risk falling every week? If the ticket count or the total floating loss is growing, whatever it's called, it's averaging down.
- Hold and hope. Listed for completeness. This is the strategy that produced the gap, continued.
Whichever route, two rules are not optional. First, cap the tail before anything else: whatever remains open gets a hard stop, today, so the worst case is a known number instead of a stop-out cascade. Second, fix the intake: none of this matters if tomorrow's losers get held like yesterday's. The recurrence rule can be as blunt as "no position stays open past 48 hours without a stop attached". Blunt rules survive contact with a bad week; elegant ones don't.
Some accounts shouldn't attempt this solo, and the pattern is consistent: the gap is deep (that $5k–$10k floating range is where we live), the trader has already tried a staged unwind twice and folded both times, and every look at the terminal produces either paralysis or revenge trades. That's not a knowledge problem (you could recite this article); it's an execution problem, and a second pair of hands with no emotional stake in the basket is the actual product of drawdown management done properly. Anyone offering that service should charge on recovered profit only, from a baseline you both record, with you keeping the master password and the withdrawals. That's how we structure it: a flat 50% of what's actually recovered. High, and we say so plainly, because there's no upfront beyond a $200 advance and no fee at all if the recovery doesn't happen. And anyone who guarantees the recovery has told you everything you need to know about them.
The only drawdown number worth trusting
Strip everything above to what you'd tell a friend across a pub table and it's this: your account is worth its equity. It was never worth its balance. Balance is a receipts drawer; equity is the till. Balance drawdown tells you how the closed trades went, which is history. Equity drawdown tells you what the strategy actually risks, which is the only thing the next trade cares about, and the only thing your broker's stop-out engine, your prop firm's breach monitor, and the eventual reconciliation of every held loser will ever act on.
So, three moves before you next open a position:
- Pull up your account right now and write down three numbers: balance, equity, and the gap. If the gap is a few percent and shrinking, carry on. If it's double digits and growing, you already knew, and today's the cheapest day you'll ever fix it.
- Reprice your own track record in equity terms. Your real maximum drawdown is the deepest your equity ever went, wicks included, not what the statement summary says. If you don't have that data, start recording it tonight; you can't manage a number you've never seen.
- Apply the same audit to anyone you'd let near your money. Signal service, EA, account manager: ask for the equity-based maximum drawdown and watch what happens to the conversation. The good ones answer in one line. If you're evaluating having an account managed at all, that single question filters the field faster than any review site.
The trader with the honest 18% equity drawdown and the modest gain line is running a better business than the one with the perfect balance staircase and the basement full of open losers. One of them knows their number. The other is going to learn it all at once, at the worst price of the year, on an afternoon the market picks.
Know which one you are. The terminal's showing you, tick by tick, right now.