Nobody quits a signal service because of one losing trade. They quit at trade eleven of a losing streak, at two in the morning, staring at an account that's down 34% and a Telegram channel that's gone suspiciously quiet. Then, three weeks later, the system recovers without them, and they've locked in the worst month while missing the repair job that followed.
That sequence has a name, and it's the least understood concept in retail trading. This is drawdown explained for signal followers, and I mean actually explained: the recovery maths that catches almost everyone out, why the drawdown on your account will be deeper than whatever number the provider publishes, how to tell a normal rough patch from a broken system, and how to write yourself a max-drawdown policy before you're in the hole rather than during.
I'll say the uncomfortable part now. If you follow any signal service long enough, ours included, you will sit through a drawdown that makes you feel sick. The people who survive it aren't calmer than you. They just decided in advance what they'd do, and then did it.
Drawdown explained for signal followers: the three numbers that matter
Drawdown, in plain terms, is the drop from a peak in your account to a subsequent low. Your account hits $12,000, then a losing run takes it to $9,600 before it turns around. That's a $2,400 drawdown, or 20% measured from the peak. Not from your starting balance. From the peak. This distinction matters more than it looks, because an account that grew from $10,000 to $12,000 and fell back to $9,600 is only down 4% on deposits, but it's down 20% in drawdown terms, and 20% is the number your nervous system responds to.
So if you've ever typed "what is drawdown in forex" into a search bar at midnight, that's the core of it: peak-to-trough decline, expressed as a percentage of the peak. But there are three related numbers, and confusing them is how people misread both their own accounts and providers' track records.
Balance drawdown measures closed trades only. Your balance drops when a losing trade is actually closed. It's the tidy number, the one that appears on statements.
Equity drawdown includes open positions. If you're holding a gold trade that's floating $800 against you, your balance hasn't moved but your equity has. Equity is what your broker actually cares about, because margin calls and stop-outs are triggered by equity, not balance. It's also the number that hurts to look at.
Maximum drawdown is the worst peak-to-trough fall over the whole history of an account or strategy. One number, summarising the single ugliest stretch. When a signal provider says "max drawdown 18%", this is the figure they mean, and later in this piece I'll show you why you should mentally add to it.
Here's a scenario that shows why the balance-versus-equity gap matters. Say a signal service opens a gold long at 3,340 with a stop at 3,318. Price grinds down to 3,322 and sits there for two days. Your balance is untouched; nothing has closed. Your equity, on a one-lot position, is floating roughly $1,800 down. If you judge the service by balance, everything's fine. If you judge it by equity, you're in an $1,800 drawdown right now, and if three more trades open while that one floats, your equity drawdown can get deep fast even though your closed-trade record still looks clean.
Most published track records use balance. Most panic decisions are made on equity. Keep both in view.
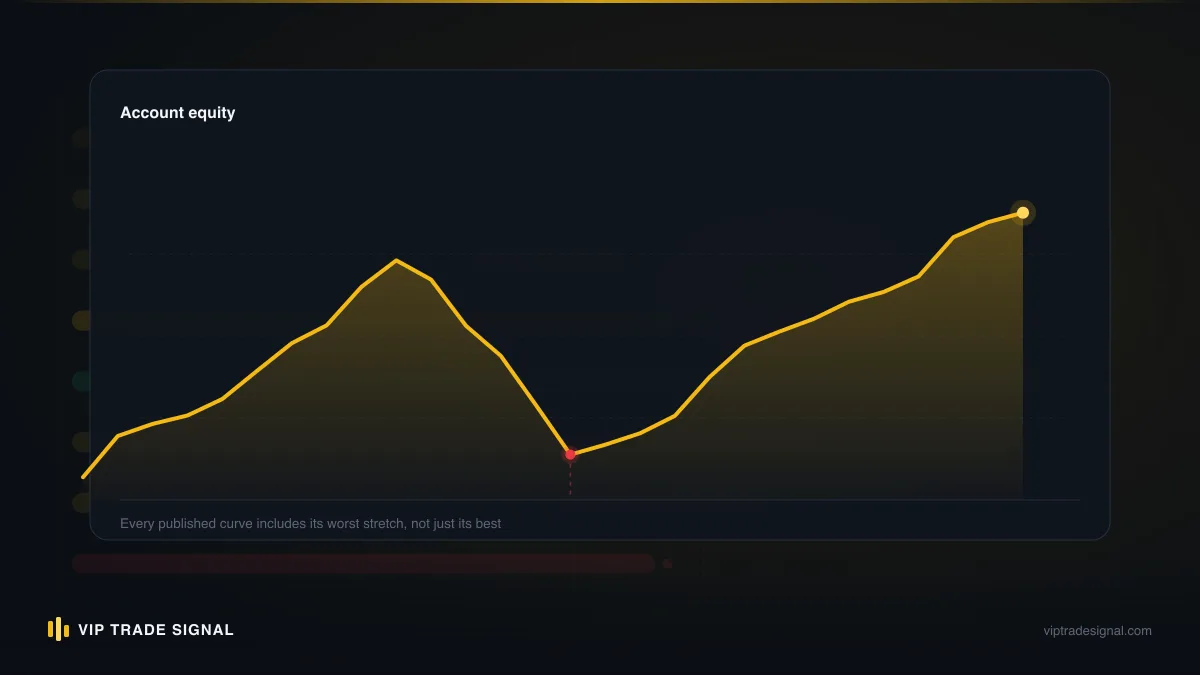
An equity curve isn't a line that goes up. It's a series of peaks with valleys between them, and the valleys are where all the important decisions happen. When you look at any strategy's curve, train your eye to look at the depth and the length of the valleys before you look at the summit. The summit tells you what you might make. The valleys tell you what you'll have to sit through to make it.
The recovery maths that surprises everyone
Here's the bit of arithmetic that should be tattooed on the inside of every trader's eyelids: losses and gains are not symmetrical. A 20% loss does not need a 20% gain to repair. It needs 25%, because you're now growing a smaller base.
Run the numbers on a $10,000 account:
| Drawdown | Account value | Gain needed to recover |
|---|---|---|
| 10% | $9,000 | 11.1% |
| 20% | $8,000 | 25% |
| 30% | $7,000 | 42.9% |
| 40% | $6,000 | 66.7% |
| 50% | $5,000 | 100% |
| 60% | $4,000 | 150% |
| 75% | $2,500 | 300% |
Look at the shape of that right-hand column. It's not a straight line. It bends upward, gently at first and then viciously. The difference between a 10% drawdown and a 20% drawdown is annoying. The difference between a 40% drawdown and a 60% one is the difference between a bad quarter and a different life.
At 50% down you need to double your money just to get back to where you started. Doubling an account is what excellent traders hope to do over a couple of good years. Needing to do it just to break even, while bruised and probably tempted to over-risk, is close to a death sentence for the account. And past 60%, be honest with yourself: almost nobody comes back. Not because the maths forbids it, but because the psychology and the position sizing required to attempt it usually finish the job the drawdown started.
This asymmetry is the single strongest argument for controlling risk per trade. A follower risking 1% per signal who eats a ten-trade losing streak is down roughly 9.6% (the compounding works slightly in your favour on the way down, one small mercy). A follower risking 5% per signal on the identical signals is down about 40% after the same ten trades and now needs a 67% gain to see daylight. Same signals. Same provider. Same market. One account is having a bad month; the other is functionally destroyed.
Drawdown isn't the thing that kills accounts. Drawdown multiplied by oversized risk is.
I keep that table pinned above my desk, because in a losing streak there's a voice that whispers "size up, win it back in three trades". The table is the answer to that voice. The way back from a deep hole is slow by design, and every attempt to make it fast makes the hole deeper.
Why your drawdown will be deeper than the provider's
Here's a promise I can make with total confidence: your personal max drawdown following a signal service will be worse than the max drawdown the provider reports. Not because providers are all lying (though some are, and we'll get to that), but because of four structural gaps between their account and yours.
You started at a random point. The provider's 18% max drawdown is measured across their full history. You joined on one specific day. If that day happened to be a local peak, and it often is, because services get most of their sign-ups right after a hot streak, then your very first weeks are spent in the valley that follows. The provider's curve shows an 18% dip somewhere in year two. Your curve shows down 18% from day one. Identical trades, completely different experience, and the newer you are, the less accumulated profit you have to cushion it.
Your execution is worse than theirs. Track records are usually built on the provider's own execution: instant fills, tight spreads, entries at the quoted price. You're copying with delay. On gold, which moves fast and spreads out during news, entering 40 cents worse and exiting 40 cents worse per trade is completely realistic for a manual copier. That slippage comes straight out of winners and adds straight onto losers, which deepens every drawdown by a few extra percent. We wrote about the mechanics of getting fills right in our piece on executing signals properly on MT4 and MT5, and cutting execution slippage is one of the few free improvements available to any follower.
You cherry-pick, and you cherry-pick badly. Almost every follower skips some trades. Asleep, at work, didn't like the look of the chart. The trouble is that skipping isn't random. People skip after losses (gun-shy) and take everything after wins (confident), which means they systematically miss the recovery trades that follow losing clusters. The provider's record includes every trade; yours includes a fear-weighted sample of them. Fear-weighted samples underperform. Always.
Your sizing drifts. The provider assumes fixed fractional risk. You risked 1% for a fortnight, then 2% on a "high conviction" signal that lost, then 0.5% for a nervous week, then 3% trying to catch up. Uneven sizing means your losses cluster on your biggest trades, because the big trades are the emotional ones, and emotional trades skew toward exactly the wrong moments.
Add these up and a service with a genuine, honestly measured 18% max drawdown can hand a real follower a 30% one without anything going wrong on the provider's side. So here's the working rule: take the provider's published max drawdown, multiply by 1.5, and treat that as the floor of what you should be prepared for. If you can't stomach the multiplied number, either cut your risk per trade until you can, or don't follow the service. There is no third option in which you get the provider's smooth curve. Their curve was never on offer.
Reading a provider's max drawdown honestly
Now the other side of it: the published number itself. "Max drawdown 12%" on a sales page can mean a dozen things, most of them flattering. When you're evaluating a max drawdown signal provider figure, here's what to actually check.
Balance or equity? You know the difference now. A grid or averaging strategy can show a beautiful balance drawdown of 8% while routinely floating 40% underwater in equity, because losing positions are held open and never appear in the closed-trade record until they're either rescued or catastrophic. If a provider shows balance drawdown only, and especially if their trade history shows lots of long-held positions closed for small wins, assume the equity picture is far uglier. Ask for it. The reaction to the question tells you plenty.
Over what period? A 10% max drawdown over four months is nearly meaningless; the strategy simply hasn't met enough market conditions yet. Gold alone has, in recent years, served up violent rate-driven selloffs, geopolitical spikes, and months of dead sideways chop. A max drawdown figure earns respect after it has survived at least a full year of varied conditions, and ideally two.
Does the history include everything? The classic trick is the memory-holed account: run three accounts, delete the two that blow up, publish the survivor. Or quietly restart the track record after a disaster ("new and improved strategy v2"). The defence is a continuous, timestamped, public record with the losses left in. It's exactly why we publish every closed signal, winners and losers, at our full signal history, and it's why the first thing I'd check with any provider, us included, is whether the ugly months are still visible. A track record with no visible drawdown isn't a good track record. It's an edited one.
Is the number suspiciously low relative to the returns? Returns and drawdown are bound together by risk. A service claiming 15% monthly returns with 6% max drawdown is claiming a risk-adjusted performance that the best funds on earth do not achieve. One of the numbers is false, and it's usually the drawdown, because drawdown is easier to hide. As a very loose rule of thumb for a directional strategy with stops, expect max drawdown to be somewhere between one and three times the monthly return figure. Claimed numbers far outside that band deserve deep suspicion, and this applies whether the signals come from humans or software; automated systems have their own ways of hiding risk, which we covered when comparing EAs against human signal services.
None of this means a provider with a 25% historical drawdown is bad. Honestly reported, a 25% drawdown with solid long-run returns is a more trustworthy profile than a claimed 5% drawdown, because the first number looks like markets and the second looks like marketing.
Normal drawdown vs broken-system drawdown
The hardest question a signal follower ever faces is this one: is the current losing streak normal variance, or has the thing actually stopped working? Get it wrong one way and you quit a working system at its low. Get it wrong the other way and you ride a dead strategy into the ground. And the miserable truth is that from inside the drawdown, the two feel identical.
But they're not identical from the outside. Here's what distinguishes them.
Normal drawdown looks like this: losses are the size they're supposed to be, roughly one planned risk unit each, because stops are being honoured. The trade frequency and style haven't changed. The strategy is losing in conditions it's historically lost in, say a trend-following approach chopping up in a rangebound month. The provider is communicating normally, posting the losses with the same rhythm as the wins. The depth of the drawdown is within, or modestly beyond, the historical worst.
Broken-system drawdown looks like this: individual losses start exceeding the planned risk, because stops are being widened mid-trade or removed. Position sizes creep up after losses, the classic martingale tell, and if you want to see how that ends, the answer is always the same and always terminal. New instruments or setups appear out of nowhere ("today we're trying US30"). The provider goes quiet after losers, or deletes them, or reframes them ("we're still holding, not a loss yet"). The drawdown blows through the historical max and keeps going without any change in behaviour.
Notice that almost every red flag on the second list is about behaviour, not results. That's the key insight. You usually cannot tell from the P&L alone whether a system is broken, because a fair coin produces long ugly streaks too. But you can absolutely tell when the discipline around the system has broken, and discipline failure precedes account failure as reliably as thunder follows lightning.
So during a drawdown, shift what you're watching. Stop staring at the running total and start auditing the process: Are stops where they said they'd be? Are sizes constant? Is the style recognisable? Is the communication honest? A provider losing 15% while doing everything exactly as documented is a provider you can keep following. A provider down 8% who has started moving stops is a provider you leave today, while the leaving is cheap.
Losing streaks: the probabilities nobody internalises
Time for the section that reorganises how most people think about losing runs. Ask a typical signal follower how many consecutive losses a 60% win-rate strategy should produce, and they'll guess three, maybe four. The real answer, over a meaningful sample, is far worse, and the gap between intuition and arithmetic is where accounts go to die.
The probability of a losing streak of a given length isn't about one sequence; it's about how many chances the market gets to deal you one. Over 200 trades, roughly a year of signals at four a week, a strategy gets nearly 200 overlapping opportunities to start a streak. Here's what that produces:
| Win rate | Chance of 5+ losses in a row (200 trades) | Chance of 8+ in a row | Longest streak you should plan for |
|---|---|---|---|
| 70% | ~38% | ~1% | 6-7 |
| 60% | ~87% | ~11% | 8-10 |
| 50% | ~99% | ~53% | 10-12 |
| 40% | ~100% | ~95% | 13-16 |
Sit with the middle row, because 55-65% is where honest gold signal services genuinely live. At a 60% win rate, a five-loss streak across a year of trading isn't a risk. It's close to a certainty, at nearly nine in ten. An eight-loss streak is roughly a one-in-nine shot, which means give it a couple of years and you'll probably meet one. And these are the streaks of a perfectly healthy system, performing exactly to spec. Nothing is wrong. The coin is fair. It just came up tails eight times, because over hundreds of flips, it does.
Now stack this against the recovery table from earlier. Eight consecutive losses at 1% risk is about 7.7% down: unpleasant, survivable, forgettable within a quarter. Eight consecutive losses at 4% risk is 27.9% down, needing a 39% recovery. Same streak. Same system. The streak was never the variable that mattered. Risk per trade was, and it's the one variable that's entirely yours.
This is also the cleanest test I know for whether a provider understands their own product. Ask them: "What's the longest losing streak your strategy has had, and what should I expect?" A serious answer names a number, probably one that makes you wince slightly, and explains the win-rate maths behind it. A marketing answer waves the question off ("our accuracy is 92%!"). Surviving losing streaks with signals starts long before the streak arrives, in that conversation, in checking a full public history rather than a highlight reel, and in sizing every trade as if the eight-loss run starts tomorrow. Because on any given day, it might.
Setting your personal max-drawdown line
Everything so far has been diagnosis. Now the prescription, and it starts with a single number you choose while calm: your personal maximum drawdown. The equity level at which you stop, no debate, no "one more trade", regardless of how convinced you are that the turn is near.
Why pre-commit? Because the person who hits the line is not the person reading this. The person who hits the line is tired, angry, down money, and flooded with loss-aversion chemistry that makes "hold on and hope" feel like wisdom. You are currently the most rational version of yourself that will ever consider this question. Legislate now, so future-you only has to obey.
How to pick the number. Work through three inputs:
- The provider's history, multiplied. Take their honest max drawdown and apply the 1.5x follower multiplier from earlier. A provider with a 16% historical max means you should expect to see 24% at some point. Your line has to sit below that with room to spare, or you'll be stopped out of the service by ordinary variance.
- Your real financial pain threshold. Not the tough-guy answer. The actual number at which losing more would change your behaviour, your sleep, or your household conversations. For most people funding an account from salary, that's somewhere between 20% and 35% of the account. If the honest answer is 15%, that's fine, but then your risk per trade must be small enough that 15% accommodates a realistic bad run.
- The recovery maths. Set the line at a depth you can plausibly climb out of. Below 40%, recovery requires 67%+ gains and starts to become a multi-year project. I'd argue no signal follower should ever set a line deeper than 40%, and most should sit at 25-30%.
Where those three inputs conflict, the smallest number wins, and then you back-solve risk per trade from it. Here's the back-solve, and it's the most practical paragraph in this article: take your max-drawdown line, divide by the losing streak you should plan for at the provider's win rate (from the table above), and the result is your ceiling on risk per trade with a margin for streaks that overlap. A 25% line and a 10-loss planning streak gives 2.5% at the absolute maximum, and because streaks cluster and slippage exists, you'd sensibly halve that to around 1-1.25%. Notice what happened: your risk per trade just got derived from your survival requirements, rather than from optimism. That's the correct direction of travel. Most people pick a risk number that sounds nice and discover their implied drawdown tolerance later, in the worst possible way.
Write the number down. Physically. Tell someone who'll hold you to it. A max-drawdown line that exists only in your head has a strange habit of relocating itself downward every time price approaches it.
The action plan for when you hit the line
A line without a plan is just a place to feel bad. Here's what actually happens when your equity touches your number, written as instructions to your future self, because that's who'll be executing them.
Step one: flatten and disconnect. Close open copied positions, or let them run to their existing stops if the stops are close, but take no new signals. If you're using a copier, switch it off, don't just lower the size. The point of the line is a full stop, and partial stops have a way of un-stopping.
Step two: do nothing for two weeks minimum. Not "look for a better service". Not "trade my own ideas to win it back", which is the single most reliable way to turn a 25% drawdown into a 50% one, because revenge trading your own setups after a signal drawdown combines maximum emotion with minimum edge. Two weeks of no positions. The account sits. You sleep.
Step three: run the autopsy, on paper. Three questions, answered with the account history in front of you. Did the provider's results match their published history, or did your copy underperform their record? If your copy underperformed, was it execution, cherry-picking, or size drift, all of which are fixable on your side? And did the provider's behaviour stay disciplined through the losses, or did you see the broken-system flags from earlier?
Step four: decide from the autopsy, not the feeling. The outcomes branch cleanly. Provider disciplined, drawdown within their historical pattern, your copying was faithful: the system is probably fine and your line was set too tight for their volatility, so if you resume, resume at half your previous risk with a recalculated line. Provider disciplined but your copying leaked: fix the leak before a single new trade. Provider showed broken-system behaviour: you're done with them, permanently, and the remaining balance is the fee you paid for the lesson.
Step five: if you resume, resume small. Half risk for the first twenty trades back. This isn't superstition. It's an acknowledgement that your judgement is still bruised, and that if the drawdown does continue, you want it continuing at half speed while your confidence in the autopsy is tested against live results.
The whole plan fits on an index card. It should live next to the written line, and the day you need it, you'll be very glad it was written by the calm version of you.
Drawdown throttling: cutting risk as losses grow
There's a refinement worth adding for anyone who wants their account to fight back automatically: throttle risk as drawdown deepens, instead of holding it constant all the way to your line.
The scheme is simple. Full risk while the account is within a few percent of its peak. At 10% drawdown, cut risk per trade to 75% of normal. At 15%, cut to half. At 20%, cut to a quarter. At your line, stop, as before. The percentages are adjustable; the shape is the point, and the shape is: the deeper the hole, the smaller the shovel.
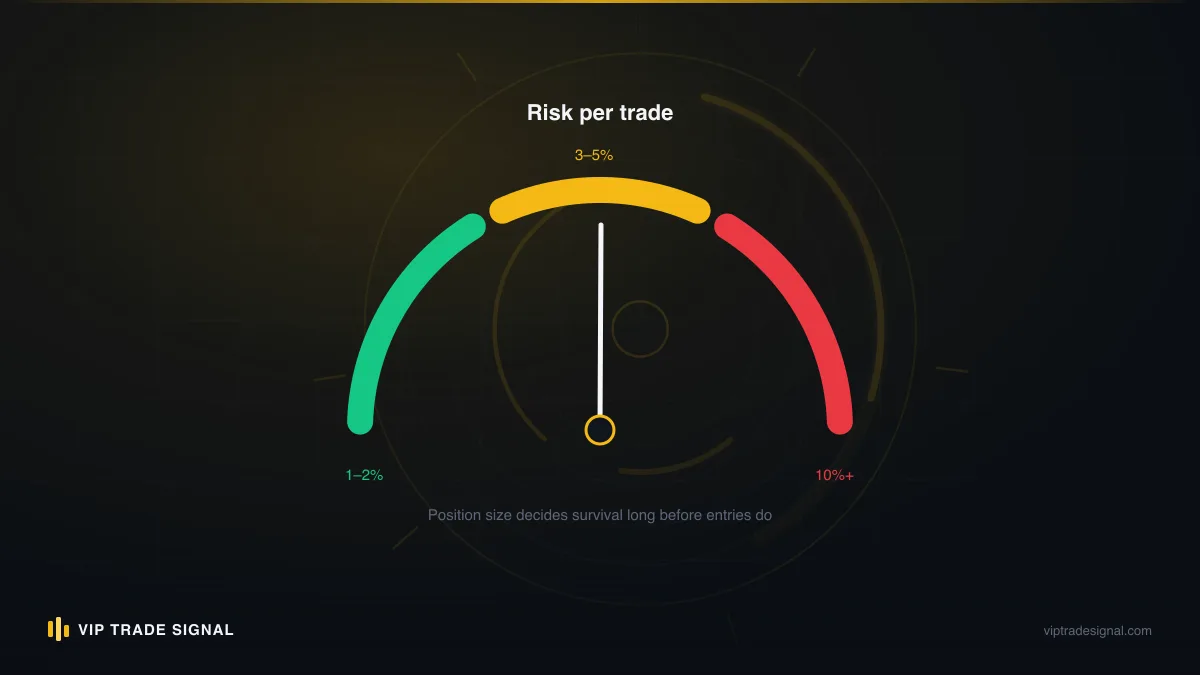
Two things happen when you throttle, and both are quietly enormous. First, the arithmetic: a losing streak that continues after you've halved risk digs at half speed, which pushes your worst-case drawdown noticeably shallower for a modest cost in recovery speed. An account that would have hit 30% at constant risk might bottom at 21-22% with throttling, and the recovery-maths table says the difference between needing 43% back and needing 28% back is not small. Second, the psychology: every threshold crossed is a pre-planned action taken, which replaces the helpless feeling of watching the account sink with the competent feeling of executing a policy. People who are executing a policy make fewer catastrophic improvisations. That's not a platitude; it's the entire reason checklists exist in aviation.
The objection you'll hear is that throttling slows recovery, since you're taking your smallest positions right before the rebound. True, and accepted. Throttling deliberately trades some recovery speed for survival insurance, and if that trade offends you, revisit the recovery table until it doesn't. On a $10,000 account risking 1%, throttling means your trades shrink from $100 risk to $75, then $50, then $25 as things get ugly. Small numbers. Large consequences.
One warning: throttling is for followers with fixed-risk copying. If your provider sizes positions for you, or you're on pooled or managed execution, check how sizing actually works before assuming you can throttle; there are services where the honest answer to "can I halve my risk?" is buried in the fine print, and it's a fair question to put to any provider's support desk, or to check against our FAQ if the provider is us.
The psychology of watching an account sink
Let's talk about the part the tables can't fix, because the maths of drawdown is the easy half. The hard half is that drawdown is experienced, minute by minute, by a brain that was never designed for it.
Loss aversion is the headline act. Losses register roughly twice as loudly as equivalent gains, which means a 20% drawdown doesn't feel like the mirror of a 20% run-up. It feels like a 40% run-up would, an event, a crisis, a summons to do something. And "do something" is precisely the impulse that converts drawdowns into disasters: doubling risk to accelerate the comeback, abandoning the service at the low, overriding signals with panic exits that turn planned 1R losses into unplanned 2R ones.
Then there's the checking. In drawdown, people check their equity ten times as often, and every check is a fresh dose of pain that produces no information. If you take one behavioural rule from this piece, take this: during drawdown, check the account once per day, at a fixed time. Not before bed. The account does not need supervision. It needs you rested.
There's also a quieter effect worth naming: drawdown shame. People hide sinking accounts from partners and end up managing the worst period entirely alone, which is exactly when isolated decision-making is most dangerous. The fix is embarrassingly simple. Tell one person your max-drawdown line when you set it, and tell them when you're in drawdown. Not for advice. For witness. Lines announced to another human being get kept; private resolutions relocate.
And know this about the timeline of a drawdown: the bottom feels like the middle. At the low, there's no bell, no signpost, nothing that distinguishes the last losing trade of a streak from the tenth of twenty. Which is why every attempt to "wait for things to improve before resuming" fails: the evidence of improvement only exists in hindsight, well after the recovery is underway. Your policy, your line, and your throttle exist precisely because real-time judgement at the bottom is not available to anyone. Not to you, not to me, not to the provider. Anyone who claims they can feel the bottom is telling you about their marketing, not their skill.
When professional drawdown management makes sense
Sometimes the drawdown has already happened, and it's beyond the tidy percentages in this article. An account floating $5,000 or $8,000 underwater, usually with open losing positions that have been held too long, often after following a service or an EA that turned out to be running the broken-system playbook. If that's where you are, the honest options are three, and none of them is painless.
Option one: close everything, take the realised loss, and rebuild slowly with the survival framework above. Brutal, clean, and more often than not the right answer, because it converts an open wound into a known number.
Option two: work out of it yourself. Possible, but reread the recovery table and the psychology section first, because you'd be attempting the hardest task in trading, deep-hole recovery, in the worst state, already bruised, with the strong pull toward oversizing that bruised traders always feel.
Option three: hand the recovery to someone who does it dispassionately. This is a real service category, and it's one we operate: for accounts floating roughly $5k-$10k down, our desk takes over the drawdown management side, working the account back toward a jointly recorded baseline, and we charge a flat 50% of recovered profit above that baseline. Half of the recovery is a genuinely steep fee, and I won't pretend otherwise; you're paying for discipline, execution, and the absence of your own loss-aversion at the controls, on a pay-for-results basis with no upfront recovery fee. And the caveat that matters most, the one any honest desk will lead with: there are no recovery guarantees. None. An account can be beyond sensible recovery, and a firm that promises to rescue any drawdown is exhibiting exactly the overconfidence that created the drawdown in the first place. If a provider guarantees recovery, run.
How to decide between the three? Mostly on position quality and margin room. If the open positions are hedged chaos consuming most of your free margin, option one's certainty usually beats option three's possibility. If the account has margin room and the losing positions are in an instrument with real two-way movement, gold being the obvious example, managed recovery has something to work with. Either way, decide the same way you set your line: on paper, with the numbers, ideally with that witness of yours in the room. Not at 2am, alone, in the app.
Your drawdown policy: fill this in tonight
Theory absorbed, tables read, psychology acknowledged. None of it protects you until it's written down with your numbers in it. So here's the template. Ten minutes, tonight, before the next signal arrives, because the entire value of a drawdown policy comes from writing it while nothing is wrong.
My drawdown policy, dated _______
- Account starting equity: $_______. Current peak equity (update monthly): $_______.
- Provider's published max drawdown: _____%. My planning figure (x1.5): _____%.
- Provider's approximate win rate: _____%. Losing streak I'm planning for: _____ trades.
- My risk per trade: _____% (check: line ÷ planning streak, then roughly halved).
- My throttle: at _____% drawdown I cut risk to 75%; at _____% to 50%; at _____% to 25%.
- My max-drawdown line: _____% (equity $_______). At this number I flatten, disconnect the copier, and take no trades for 14 days.
- My checking rule during drawdown: once daily at _______, and not before bed.
- My witness: _______. They know the line, and they'll know if I move it.
- After any stop-out: written autopsy of execution, cherry-picking, size drift, and provider discipline before any restart. Restarts begin at half risk for 20 trades.
- Broken-system triggers that end the service relationship immediately: stops widened mid-trade, sizes growing after losses, losses deleted or reframed, silence after losing days.
That's the whole policy. Notice what's not in it: predictions, targets, opinions about where gold is heading. Drawdown policy is entirely about your behaviour, because your behaviour is the only input you control, and, conveniently, it's the input that determines whether variance merely bruises you or finishes you.
A last thought to close on. Every equity curve you have ever admired, every fund, every legendary trader, every honest signal service, contains drawdowns that felt unbearable to the person living through them. The curve you're jealous of was, at several points along its length, an account that looked broken, held by someone who had decided in advance not to break with it, and whose position sizing gave them the right to hold on. That's the entire game for a signal follower. Not finding the service that never draws down, because it doesn't exist and anyone selling it is lying. Finding an honest one, sizing so their worst stretch is survivable on your account, drawing your line while you're calm, and then, when the valley comes, doing the boring, pre-written thing instead of the dramatic thing. The traders still standing in five years won't be the ones who avoided drawdown. They'll be the ones who had a policy for it.