Nobody checks the engine while the car is still running fine. That's the whole problem. Traders pull their statements apart after the blow-up, line by line, hunting for the moment it went wrong — and the moment is always there, visible, weeks before the account died. The margin level had been sliding for a month. Three positions were quietly bleeding swap. Half the equity was tied up in one floating loss that "just needed a pullback". Every one of those was measurable in advance. Nobody measured.
We run an intake audit on every account that comes to us, and over the years it has hardened into fifteen specific checks. Not vibes, not "how do you feel about your trading" — fifteen numbers you can pull out of MT4 or MT5, each with a green, amber and red threshold. This article is that trading account health check, handed over in full, because the honest truth is most accounts don't need us. They need a mirror and twenty minutes.
A word before we start. This is a diagnostic, not a prophecy. A red score doesn't mean your account dies next week, and a green score doesn't mean you're safe — leveraged gold and forex can hurt anyone on any given Tuesday. What the score tells you is how much room you have left when the market does something unkind. That's the only question that matters between now and your next losing streak, and a losing streak is coming, because losing streaks always come.
Why accounts need physicals, not just post-mortems
Here's a pattern we see so often it's almost boring. A trader emails us with an account that's floating 40% down. We ask for the statement. And the statement tells a story with a clear beginning: fourteen weeks earlier the account was fine — profitable, even. Then one position went underwater and didn't get closed. Then a second was opened to "average in". Then margin level dipped under 300% for the first time, which felt uncomfortable but survivable, so nothing was done. Every single step was visible in real time. Every step was ignored, because there was no habit of looking.
Post-mortems are easy. The account is dead, the emotions have burnt off, and hindsight makes everyone a genius. The physical is harder precisely because the account still looks alive. Your equity curve is only down a bit. The floating loss "isn't realised yet". You can still open trades. It takes a specific kind of discipline to run a cold forex account audit on an account you're emotionally invested in defending — which is exactly why the audit needs to be a checklist with numbers, not a feeling.
Think about how medicine works. A doctor doesn't ask whether you feel healthy; feelings are unreliable and people lie, mostly to themselves. The doctor takes your blood pressure, and blood pressure has thresholds — below this, fine; between this and that, watch it; above that, we act today. Nobody argues with the cuff. The fifteen vitals below work the same way. You don't get to negotiate with margin level. It's a number, it has thresholds, and it doesn't care about your thesis on gold.
And there's a second, sneakier reason to run a scheduled trading account review: accounts degrade in ways that daily watching hides. If you stare at your terminal every day, a slide from 900% margin to 400% over six weeks feels like nothing, because each day only moved a little. Pull the same two numbers six weeks apart and the trend screams at you. The health check is how you defeat the boiling-frog problem. You're not looking for today's disaster. You're looking for the slope.
Pulling the numbers from MT4/MT5 in minutes
Everything you need is already in your terminal; none of this requires a plugin, a spreadsheet subscription or an analytics service. Here's the whole extraction, which genuinely takes about five minutes once you've done it twice.
First, the live numbers. In MT4 or MT5, the Trade tab at the bottom of the terminal shows Balance, Equity, Margin, Free Margin and Margin Level in a single row. Write down all five. If your broker's mobile app is your main window, the same figures sit at the top of the Trade screen. These five numbers feed vitals one through four almost directly.
Second, the open-position detail. Still in the Trade tab, look at each open position and note four things per position: the symbol, the lot size, the open date, and the swap column. That swap column is the one almost nobody reads, and it's where slow-motion damage hides. If you're carrying eight positions, this is eight rows in a notebook. Two minutes.
Third, the history. Right-click in the Account History tab, choose Custom Period, and pull the last three months. Then right-click again and Save as Detailed Report. The HTML report MT4 spits out includes your maximal drawdown figure, profit factor, and the full trade list with dates. MT5's report is prettier and adds a few extras, but the same essentials are there. For drawdown duration — how long you've been under your equity high-water mark — you'll need to eyeball the trade list or your own records, because the terminal reports depth better than it reports time. We'll deal with that in vital six.
That's it. Five live numbers, a per-position table, and one saved report. If pulling this takes you more than fifteen minutes, that itself is diagnostic information: an account you can't summarise quickly is usually an account carrying too much clutter.
One practical tip before the vitals. Do the pull at a consistent moment — we like Friday after the New York close, when nothing is moving and weekend risk is about to matter anyway. Gold in particular can gap hard over a weekend, which is a subject worth its own reading if you hold positions through Fridays: our piece on weekend gap risk in gold covers why that Sunday open candle deserves your respect.
Vitals 1-3: margin level, free margin ratio, leverage in use
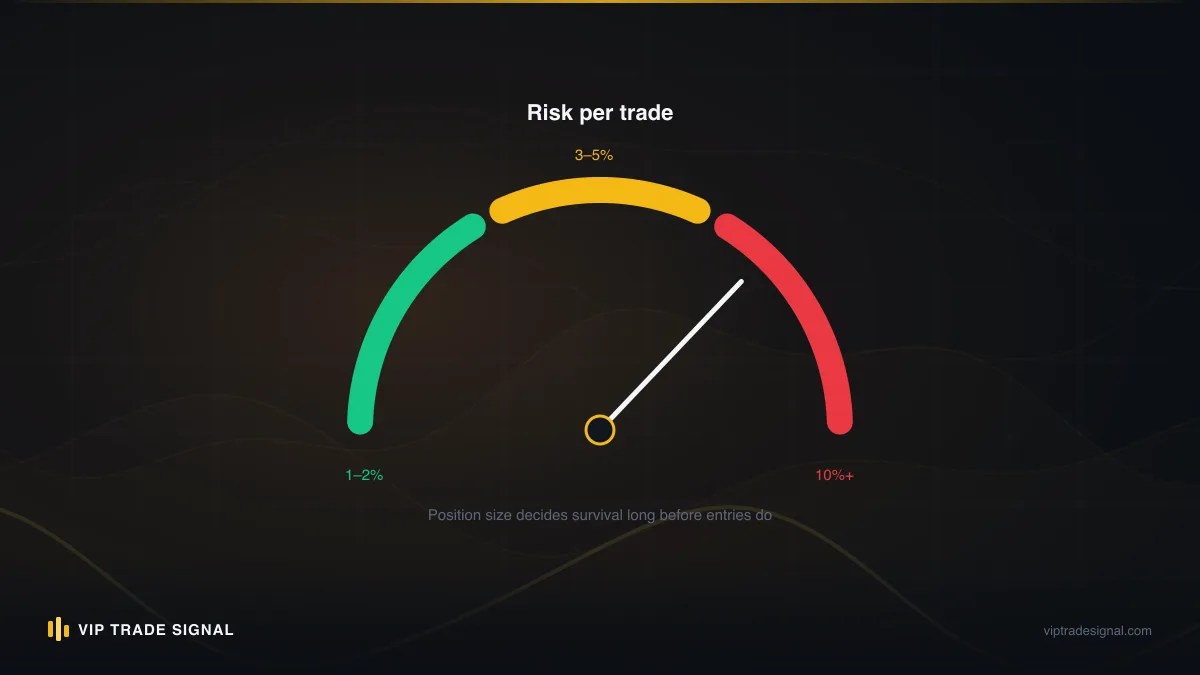
Vital 1: Margin level. This is equity divided by used margin, expressed as a percentage, and it's the single most honest number in your terminal because it's the one your broker acts on. Below 100% on most brokers you can't open new trades; at the stop-out level — often 50%, sometimes 20% — the broker starts force-closing your positions at market, worst first, with no interest in your opinion.
Green: above 1,000%. Amber: 400% to 1,000%. Red: below 400%.
Traders regularly push back on that red line. "The stop-out is at 50%, why is 400% red?" Because margin level doesn't fall linearly — it accelerates. A gold position that drags you from 800% to 400% will drag you from 400% to 150% on the same-sized move, because equity is shrinking while used margin stays put. At 400% you are one bad overnight session from the zone where the maths gets violent. We've watched accounts go from 350% to stop-out inside a single London morning.
Vital 2: Free margin ratio. Free margin divided by equity. This asks a slightly different question: of the money in the account, how much is actually available to absorb losses or respond to opportunity? Green: above 70% of equity free. Amber: 40-70%. Red: below 40%.
Why does this matter separately from margin level? Because free margin is your fire brigade. When a position moves against you and you need to hedge, or a genuine A+ setup appears, free margin is what you act with. An account at 45% free margin can't respond to anything; it can only sit and pray. Praying is not a risk management technique, though it's certainly the most popular one.
Vital 3: Leverage actually in use. Not the leverage on your account application — the leverage you're really using, which is total notional exposure divided by equity. Say you've got $5,000 of equity and you're holding 0.5 lots of XAU/USD with gold at 3,300. That's roughly $165,000 of notional. You are running 33:1, regardless of what the 500:1 sticker on your account says.
Green: effective leverage under 5:1. Amber: 5:1 to 15:1. Red: above 15:1.
Those thresholds will look conservative to anyone raised on prop-firm Instagram. They're not conservative; they're arithmetic. At 33:1, a 3% move in gold — which happens — is a 99% move in your equity. The sticker leverage your broker advertises is a marketing number. The effective leverage you compute here is the one that decides whether you survive the year.
Vitals 4-6: floating P/L, drawdown depth, drawdown duration
Vital 4: Floating P/L as a share of equity. Add up the unrealised profit or loss on all open positions and divide by equity. Green: floating loss under 5% of equity (or floating profit — lucky you, though unbanked profit has its own risks). Amber: floating loss of 5-15%. Red: floating loss above 15%.
The reason this vital exists separately from drawdown is psychological, not mathematical. Realised losses are grieved and processed; floating losses are denied. A trader who would never dream of losing 20% of the account in closed trades will happily sit on a 20% floating loss for months, because it "isn't a loss until you close it". That sentence has killed more retail accounts than any market crash. The market does not know your entry price and does not owe you a return to it.
Vital 5: Drawdown depth. How far your equity sits below its all-time (or twelve-month) high-water mark, in percent. Your saved MT4/MT5 report gives you maximal drawdown; comparing current equity to your known peak gives you the live figure. Green: under 10% from peak. Amber: 10-25%. Red: beyond 25%.
The red threshold isn't arbitrary. The arithmetic of recovery is brutally asymmetric: down 10% needs 11% to recover, down 25% needs 33%, down 50% needs 100%. Somewhere past the 25% mark, recovery stops being a normal trading task and becomes a special project with its own risks — chiefly the temptation to size up to "get it back faster", which is how a 30% drawdown becomes a margin call. If drawdown as a concept is fuzzy for you, start with what drawdown actually is and why it compounds and come back; this vital will land harder.
Vital 6: Drawdown duration. Depth gets all the attention, but time underwater is the quieter killer. How many weeks since your equity last made a new high? Green: under 4 weeks. Amber: 4-12 weeks. Red: beyond 12 weeks.
A deep-but-brief drawdown is often just variance — a bad fortnight inside a working method. A shallow-but-endless one is worse news, because it means the method itself has stopped producing. Twelve weeks without a new equity high, even down only 8%, tells you something is broken: the edge has decayed, the market regime has changed, or discipline has quietly rotted. Duration is the vital that catches strategies dying politely, and almost nobody tracks it.
Vitals 7-9: swap bleed, concentration, correlation
Vital 7: Swap bleed. Total that swap column across every open position, work out the daily cost, and express it monthly as a share of equity. Green: under 0.5% of equity per month. Amber: 0.5-2%. Red: above 2%.
Swap is a rounding error on a three-day trade and a landlord on a three-month one. Take a concrete case: a 0.3-lot short on gold paying $4 a night in swap costs you roughly $120 a month, with Wednesday's triple-swap making it worse. On a $4,000 account that's 3% of equity per month, every month, just for the privilege of staying wrong. We've audited accounts where the swap bleed over a year exceeded the total realised trading loss. The trader had been fighting the market and losing to the calendar.
Vital 8: Concentration. What share of your total exposure sits in one instrument or one directional idea? Green: no single idea above 40% of exposure. Amber: 40-70%. Red: above 70%.
Now, a fair objection: we run a gold-only signal service, so isn't 100% concentration our entire business model? Yes — deliberately, and with a control that changes everything: hard stops on every position and known risk per signal, published wins and losses alike. Concentration with defined risk on each position is a specialisation. Concentration in one stopless, growing floating loss is a hostage situation. This vital isn't really measuring instrument diversity; it's measuring how much of your account is riding on a single "it has to come back" belief.
Vital 9: Correlation. Count your open positions, then count your actual independent ideas. Long gold, short USD/JPY and long silver looks like three trades. In a dollar-driven session it's one trade — short the dollar — wearing three costumes, and it wins or loses as one. Green: your positions represent genuinely distinct ideas, or you're consciously running a single-idea book with sizing that accounts for it. Amber: two or three positions that mostly move together while you're sizing them as if independent. Red: four-plus positions that are one macro bet in disguise.
The tell is your P/L column at a news release. If every row goes red in the same second, you don't have a portfolio. You have one large position with extra commission.
Vitals 10-12: position age, size distribution, hedge exposure
Vital 10: Position age. Look at the open date on each position against your intended holding period. A scalp that's five days old isn't a scalp any more; it's a mistake with seniority. Green: every open position is inside its intended timeframe. Amber: one position has overstayed. Red: multiple positions are older than your strategy has any business holding, or you can't actually say what the intended timeframe was.
That last clause matters. In our intake audits, "how long did you plan to hold this?" is the question that most often gets silence. A position with no planned exit horizon isn't a trade. It's a hope with a ticket number.
Vital 11: Size distribution. List your last twenty trades by lot size. Healthy accounts show boring consistency — 0.10, 0.10, 0.12, 0.10 — because size is set by a rule, usually a fixed percentage of equity at risk. Sick accounts show a sawtooth: 0.10, 0.10, 0.50, 1.00, 0.05. That pattern has a name, and the name is tilt. The 0.50 and the 1.00 are revenge trades trying to win back the morning; the 0.05 afterwards is the flinch. Green: largest recent position no more than twice your median size, with a rule behind any variation. Amber: occasional unexplained size spikes. Red: sizing visibly tracks your emotional state rather than any rule.
This is the vital most likely to embarrass you, and the most useful for exactly that reason. Your size history is a polygraph you can't argue with.
Vital 12: Hedge exposure. Are you holding offsetting positions in the same instrument — long 0.5 lots of gold and short 0.3? Green: no internal hedges, or a deliberate, documented hedging rule you can state in one sentence. Amber: one hedge you can explain. Red: locked positions you opened to "stop the bleeding while I figure it out".
We'll be blunt about locking, because our opinion here is unfashionable: it's almost always self-deception with a technical name. The moment you lock, you've realised the loss in every way that matters — the spread is paid twice, the swap runs on both sides, and the P/L is frozen — but the platform lets you avoid seeing a closed red number. You've paid a fee to postpone a feeling. Accounts arrive at our desk locked-and-frozen often enough that we wrote a full piece on what to do with trapped positions, and the first step is always the same: admit the loss already happened.
Vitals 13-15: rule adherence, journal, loss-limit status
Vital 13: Rule adherence. Take your last twenty trades and your written trading rules, and score each trade: did it follow the rules at entry, in sizing, and at exit? Green: seventeen or more of twenty compliant. Amber: twelve to sixteen. Red: under twelve — or, the most common red of all, there are no written rules to check against.
Notice what this vital doesn't measure: profit. A rule-following losing streak is a variance problem, and variance problems fix themselves or get fixed with small adjustments. A rule-breaking winning streak is a time bomb with a pleasant ticking sound. If you can't tell which of the two you're in, nothing else in your trading is knowable.
Vital 14: The journal. Does a trading journal exist, and was it written in during the last week? Green: entries within the past week, including reasons for entries and exits. Amber: a journal exists but the last entry is from a different month. Red: no journal, or a journal that's just a P/L diary of numbers with no reasoning.
A P/L log tells you what happened; only a reasons log tells you why, and only why is fixable. The journal is also your early-warning system for vital 11 — size spikes almost always show up alongside journal entries that get shorter and angrier, or stop entirely. When the journal goes quiet, the account is usually about to get loud.
Vital 15: Loss-limit status. Do you have a defined daily or weekly loss limit — a number at which you stop trading, full stop — and when did you last breach it without stopping? Green: a written limit exists and has held for three months. Amber: a limit exists but got "flexed" at least once recently. Red: no limit, or a limit that's routinely trampled.
This is the last vital because it's the one that guards all the others. Every catastrophic account failure we've ever audited — every single one — involved a session where the trader kept going past the point where any rule said stop. The limit is the circuit breaker. An account without one isn't wired to code, however pretty its equity curve looks this month.
Scoring: green, amber and red, explained properly
Score each vital 0 for green, 1 for amber, 2 for red, and add them up. Out of a possible 30:
| Total score | Reading | What it means in practice |
|---|---|---|
| 0-5 | Green account | Healthy. Recheck monthly; watch any single amber for trend. |
| 6-11 | Amber account | Functioning but degrading. Fix the reds this week; recheck fortnightly. |
| 12-19 | Red account | Structurally at risk. Stop opening new positions until the score drops. |
| 20-30 | Critical | Survival mode. The only job now is capital preservation. |
The total matters less than the pattern, though, so read your card twice. A 10 built from ten scattered ambers is a discipline problem — lots of small slippages, nothing lethal, fixable with tightened habits. A 10 built from five hard reds in vitals 4, 5, 8, 10 and 12 is a different animal entirely: that specific cluster — big floating loss, deep drawdown, everything concentrated in one old position, hedged to freeze it — is the fingerprint of an account organised around defending one bad trade. The number is the same. The disease is not.
Also weight the structural vitals over the situational ones. A red on margin level can be caused by one oversized position and fixed in a single click. A red on rule adherence or loss limits can't be clicked away, because it isn't in the account — it's in you. Our rough hierarchy: reds in vitals 13-15 predict the future, reds in 4-6 describe the present, reds in 1-3 threaten the next 48 hours. Triage in that order of urgency, but invest in that order reversed.
An account rarely dies of one red. It dies of six ambers that nobody wrote down.
Finally, track your total over time, because the slope beats the snapshot. An account that scores 8 today and scored 3 last month is in worse shape than one holding steady at 11, whatever the raw numbers say. Keep the scores in the back of your journal — one line, dated, fifteen digits and a total. After six months you'll have something almost no retail trader possesses: an objective record of your account's trajectory, written by someone with no incentive to flatter you.
Reading a red score without panicking
So you scored 16. First: nothing about that number requires action in the next ten minutes, unless vital 1 is flashing and your broker's stop-out is genuinely near. The account that took three months to get sick will not be cured tonight, and the attempt to cure it tonight is precisely how red accounts become dead ones. Panic-flattening everything at 3am and revenge-trading the "recovery" the next day are the same mistake wearing different hats.
Here's the sequence we'd actually walk through, in order.
- Remove the acute threat. If margin level is red, reduce until it isn't — trim the largest loser first, not the position you're least attached to. This is the only same-day action a red score demands.
- Freeze new risk. No new positions until the total score is out of the red band. Not "only A+ setups". None. Every red account we've audited believed its next trade was an A+ setup.
- Deal with the oldest floating loss. Vitals 4, 10 and 12 usually point at the same position. Close it, or set a hard stop at a level you choose in daylight, calmly, and never widen. One or the other. "Monitoring it closely" is not on the menu — that's what got you here.
- Rebuild the structural layer. Write the loss limit. Restart the journal. Re-read your rules, or write them for the first time. This is dull, and it's the actual cure; everything above it was first aid.
- Recheck in two weeks, same day, same time, same fifteen vitals. Progress is the score falling. Not profit — the score. Profit will follow structure or it won't, but it never durably precedes it.
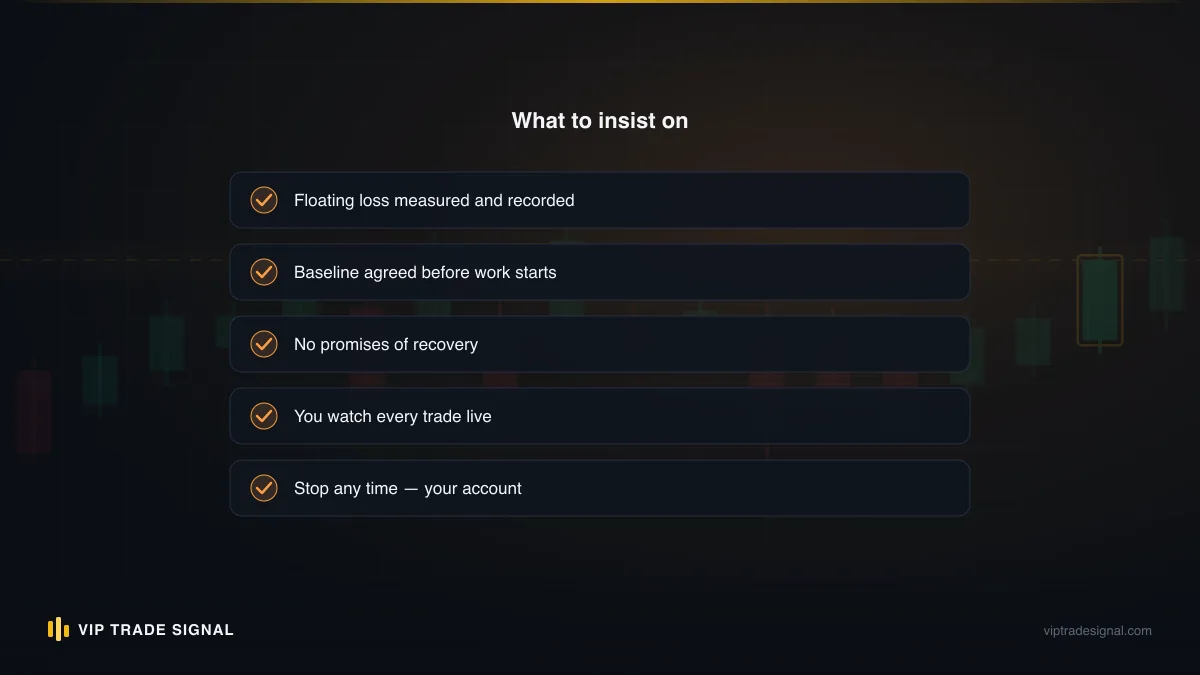
Notice what's absent from that list: any attempt to trade your way out. The recovery-by-bigger-positions instinct is the single most destructive impulse in retail trading, and it's exactly when a second pair of eyes earns its keep. It's also the honest reason our drawdown management service exists — for accounts floating roughly $5k-$10k underwater, we take over the recovery on a flat 50% of profit recovered above a baseline we both record on day one. No fee unless the account actually recovers, and no guarantees that it will, because anyone guaranteeing recovery in a leveraged market is lying to you. Most red-scoring readers won't need that. The checklist plus a frozen trigger finger fixes more accounts than we do.
What a red score is really telling you is that your account has stopped being a trading account and become a rescue operation, and rescues run on different rules: capital preservation first, ego last, timeline measured in months. Traders who accept that generally make it back. Traders who demand their money back by Friday generally donate the rest.
What we look at that a self-check can't catch
An honest limitation: the fifteen vitals are the measurable surface, and we designed them that way on purpose — numbers you can pull yourself, thresholds that don't need judgement. But when an account lands on our desk for a full account risk assessment, there are things we routinely find that a self-administered check misses. Worth knowing what they are, if only so you can half-check them yourself.
The first is entry-quality drift. Your trades this quarter versus last: same setups, or a slow loosening? Traders under drawdown pressure unconsciously widen their definition of a valid entry — the pullback that needed three confirmations in January needs one by June. From inside, every trade still feels rule-compliant, which is why vital 13 can score green while the rules themselves have quietly inflated. Reading a hundred entries side by side exposes it in minutes; reading your own is like proofreading your own writing. You see what you meant, not what's there.
The second is broker-side friction. Slippage patterns, spread widening around news on your specific account type, swap rates that crept up without an email, commission structures that stopped making sense for your trade frequency two hundred trades ago. Almost no retail trader benchmarks execution, and on an active gold account the difference between decent and poor fills compounds into a real percentage over a year. Not scandal — friction. But friction is a vital too; it just doesn't show in your terminal as a single number.
The third is the story test, and it's the big one. We ask a trader to explain each open position in one sentence, and then we compare the sentences to the account's own records. The gaps are where the truth lives. "I'm long from 3,340 because the trend is up" — but the position was opened the day the trend broke, and doubled the day after. The account remembers what actually happened; the narrative has been quietly edited since. No checklist catches a story you've been telling yourself for six weeks, because you'll answer every question from inside the story.
None of this means the self-check is inadequate — for catching the account-killers, the fifteen vitals do the job. It means the self-check has a blind spot shaped exactly like you. If your score is red and your own explanation for it feels suspiciously reasonable, that's the moment to get in touch and let a stranger read the statement cold. Strangers are terrible at sympathy and excellent at arithmetic, which is the correct ratio for this job.
The recheck cadence that keeps accounts honest
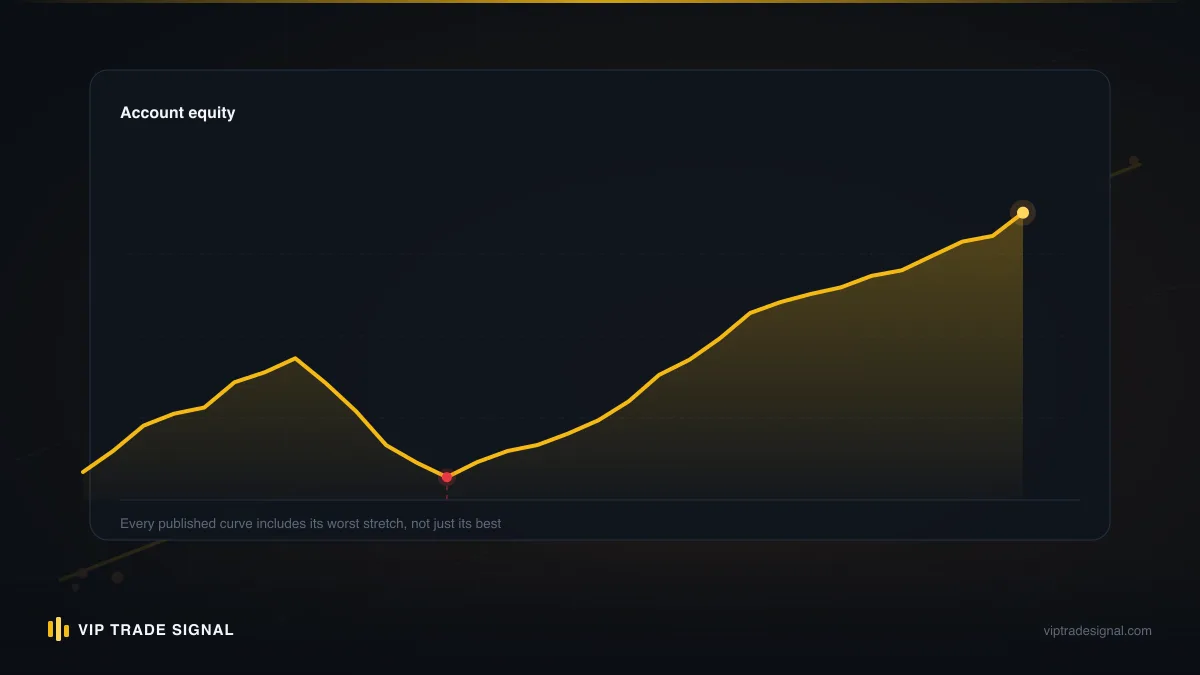
A single health check is a photograph. The value compounds when it becomes a film, and that means a fixed cadence — chosen once, in advance, and kept regardless of how trading feels. "I'll check when things seem off" is not a cadence. Things always seem fine from inside; that's the disease this whole system exists to treat.
Our recommendation, tiered by your last score. Green accounts: monthly, first Friday after the New York close, twenty minutes. Amber: fortnightly until you've strung two consecutive greens together. Red: weekly, but with a crucial constraint — you're checking the score, not the P/L. A red account rechecked daily becomes an obsession, and obsessed traders start making trades to move the score, which corrupts the instrument. The score is a thermometer. Licking it more often doesn't cool the fever.
Put the recheck in your actual calendar, and treat it with the seriousness you'd give a client meeting — because that's what it is. You are the client. Three more habits that make the cadence stick:
- Same conditions every time. Same day, same session, markets quiet. A health check run mid-London-volatility measures the market's mood, not your account's structure.
- Write before you interpret. Fill in all fifteen scores first, then read the card. If you interpret as you go, the third amber starts bending how you score the fourth. You will be tempted to grade on a curve. The curve is how accounts die.
- One line in the journal. Date, fifteen digits, total, and a single sentence: what's the trend? That sentence, accumulated over months, becomes the most honest document in your trading life.
And schedule one deeper review per quarter — the same fifteen vitals plus the last three months of closed trades against your rules, an hour instead of twenty minutes. The monthly check catches the account getting sick. The quarterly one catches the trader.
Here's the part that surprises people: the cadence changes behaviour before it changes anything else. Traders who know Friday's check is coming think twice on Wednesday about the position that would turn vital 10 amber. The audit stops being a report card and becomes a quiet hand on your shoulder mid-week. Half the value of measuring is that measured things behave better — that's as true of trading accounts as of anything else humans manage.
Twenty minutes, this week
Let's land this somewhere concrete, because a checklist you nod along to and never run is worth exactly nothing.
This Friday, after New York closes, pull the five numbers from your Trade tab, note your open positions with their dates and swaps, and save the three-month detailed report. Score all fifteen vitals cold — no interpreting until the card is full. Write the total in your journal with the date. Total time: twenty minutes, maybe thirty on the first pass while you find where everything lives.
If you score green, good — you've just bought yourself a baseline, and the monthly recheck will tell you if that ever starts to slip, long before your P/L does. Most traders never establish a baseline, which is why their first real look at account structure happens during the emergency, when every number is on fire and none of them mean anything calmly.
If you score amber, you've caught the account at the cheapest possible moment to fix it. Ambers cost discipline to repair. Reds cost money. The gap between those two prices is the entire return on twenty minutes of Friday admin, and it is enormous.
And if you score red — especially that particular cluster of a deep floating loss, an old position, a lock and a silent journal — then be honest about what you're now managing. It isn't a trading account any more; it's a recovery project, and recovery projects punish improvisation. Work the five steps from earlier, in order, with new risk frozen. If the account is floating something in the $5k-$10k range down and you'd rather not run the rescue alone, that's the specific situation our drawdown desk was built for, and the fee only ever comes out of profit actually recovered above the baseline we record together. No recovery, no fee, and no promises either way — anyone who promises you the market will cooperate has confused marketing with weather forecasting.
But run the check first. Fifteen numbers, twenty minutes, no opinion required from anyone — least of all from a signal desk with a service to sell you. Your account already knows exactly how healthy it is. All you have to do is ask it in a language it can't lie in.