A Myfxbook link has become the retail forex equivalent of a firm handshake. Every account manager has one. Every Telegram signal channel pins one. "Fully verified, check the Myfxbook" is supposed to end the argument, and for most people it does — they click through, see a green line going up and a percentage with a plus sign in front of it, and consider the diligence done. Total time on page: about eleven seconds.
That's a problem, because Myfxbook is genuinely useful and almost universally misread. The platform does exactly what it says: it connects to a trading account and reports what it sees. What it does not do is tell you whether what it sees is meaningful, whether the account is real money or a cent account in a party dress, whether last year's blown account has been quietly deleted, or whether the headline gain number was manufactured with a deposit trick a twelve-year-old could execute. All of that is left to you, the reader — and most readers never get past the green line.
So this is a guide on how to read a Myfxbook track record the way an auditor would: badge first, then five numbers in a fixed order, then a deliberate hunt for the three manipulations that pass casual inspection every single day. It takes about ten minutes per account once you know the drill. Given that people wire four and five figures to strangers on the strength of these pages, ten minutes seems like a reasonable ask.
Why Myfxbook gets cited everywhere and read nowhere
First, credit where it's due. Myfxbook solved a real problem. Before third-party verification, a track record was a screenshot, and a screenshot is worth exactly nothing. Photoshop existed. Demo accounts existed. The industry's evidential standard was, functionally, "trust me."
A live Myfxbook connection is better than all of that. The platform pulls trade data directly from the broker's server via an investor password or API connection, timestamps it, and publishes statistics you didn't compute yourself. When it's set up honestly, it is hard to fake trades that never happened. That's a real improvement, and it's why we publish every closed signal — the losers included — at /signals/history rather than asking anyone to take our word for anything. Public, timestamped, complete: that's the standard third-party verification made possible.
But here's the thing about any trust signal that becomes standard: the people you most need protection from adopt it fastest. Scammers were early to Myfxbook for the same reason phishing emails were early to SSL padlocks. The platform's presence on a sales page now tells you almost nothing, because everyone has one. What matters is what's inside the page — and the page is designed, reasonably enough, for traders analysing their own performance, not for suspicious strangers auditing someone else's. The defaults are friendly. The gotchas are in the tabs nobody opens.
The core misreading is simple. Visitors treat "has a Myfxbook" as the verification. It isn't. The verification is a specific pair of badges, a set of privacy settings, and a trade history you can actually inspect. Miss any one of those and you're not reading a track record, you're admiring a marketing graphic that happens to be hosted on a credible domain.
And the misreading is profitable. A manager who can convert an eleven-second glance into a $5,000 deposit has no incentive to make the page more honest than it needs to be.
The two badges, and the myfxbook track record verified meaning
Everything starts in the top-left of an account page, where Myfxbook shows verification status. There are two separate badges, they verify two entirely different things, and conflating them is the single most common mistake people make on the platform.
Track record verified means Myfxbook has confirmed the trade history is complete and untampered — that the platform is reading every trade directly from the broker's server, with nothing filtered, edited or imported by hand. Without it, an account's history can be uploaded manually or connected in ways that allow selective reporting. Think of it as the badge that says "the story is complete."
Trading privileges verified means Myfxbook has confirmed the person publishing the page actually controls the account — that they hold the master (trading) password, not just a read-only investor password. Without it, anyone can connect someone else's account using a shared investor password and present it as their own. Think of it as the badge that says "the storyteller owns the story."
You need both, and they answer different failure modes:
| Badge combination | What it actually tells you | Auditor's verdict |
|---|---|---|
| Both verified | Complete history, publisher controls the account | Proceed to the numbers |
| Track record only | History is real, but possibly someone else's account | Assume borrowed results until proven otherwise |
| Privileges only | It's their account, but history may be partial or curated | Assume the losers are missing |
| Neither | A self-reported graphic on a credible domain | Close the tab |
The "trading privileges verified myfxbook" badge deserves special attention because the failure it prevents is so common. Investor passwords get shared constantly — in prop firm communities, in "transparency" gestures, in leaked lists. A scammer who obtains one can connect a genuinely excellent account to a fresh Myfxbook profile, slap their Telegram handle on it, and harvest deposits off the back of trading they had nothing to do with. Track record verified will show green the whole time, because the history is complete and untampered. It's just not theirs.
One more wrinkle: badges reflect the connection now. An account can have been verified for years and had its status quietly lapse after a password change. Check the "last update" timestamp near the top of the page while you're there. An account that last synced three weeks ago is not a live track record; it's a museum exhibit, and you should wonder what's happened since the doors closed.
When the badges are missing — and the excuses you'll hear
Ask a manager why their page shows a grey badge and you will hear one of about four stock answers. It's worth knowing them in advance, because they're delivered with total confidence and they all sound plausible for roughly five seconds.
"My broker doesn't support privileges verification." Occasionally true for obscure offshore brokers — which is itself information, because why is a manager who wants your trust using a broker that can't support standard verification? The major brokers all support it. If the excuse is real, the broker choice is the red flag; if it isn't, the excuse is.
"I don't share my master password with third parties for security." Sounds prudent. Isn't. The verification process doesn't hand Myfxbook standing control of the account; it's a confirmation step. Managers who trade client money via limited power of attorney arrangements — we've written about how LPOA actually works and what it does and doesn't authorise — handle far more sensitive access daily. This excuse is the verification equivalent of "my dog ate it."
"The badge is pending, Myfxbook is slow." Verification takes hours to a few days. A page that's been live for eight months and is still "pending" is not pending. It's declining, with a cover story.
"Badges don't matter, look at the results." The results are precisely what the badges exist to make believable. This one is at least honest about its logic: trust me, don't check. You already know what to do with that.
Here's our house rule, and you're welcome to steal it: an unverified badge is not a yellow flag to weigh against other evidence. It's a gate. The moment you start accepting explanations for its absence, you've reverted to exactly the trust-me standard the platform was built to replace. There are thousands of fully verified accounts on Myfxbook. Nobody needs to compromise.
And note what a missing badge costs an honest manager: nothing but a few days' admin. Note what it costs a dishonest one: everything. The asymmetry is the point. When someone won't pay a trivial cost that would only inconvenience a fraud, the inference writes itself.
The one genuine grey area is brand-new accounts — a manager who opened a fresh account last week may legitimately still be mid-verification. Fine. Bookmark the page, come back in a fortnight, and see whether the badges arrived. What you don't do is deposit during the grey area. Fraud loves a grey area.
The five numbers to read first, in order
Badges green? Good. Now ignore the big gain number — we'll come back to why — and read five figures in a fixed order. The order matters because each one determines how seriously you should take the next.
1. History length. Top of the page: when did the account start trading? Under six months tells you essentially nothing; a coin-flipping strategy has a decent chance of looking brilliant for six months. Twelve months is a minimum for a serious look. Two-plus years, spanning at least one nasty market regime (a rate-shock year, a gold spike, a long chop), is where confidence becomes reasonable. Everything else on the page is downstream of this number, because every statistic is only as meaningful as the sample it's computed from.
2. Maximum drawdown. The deepest peak-to-valley loss the account has taken. This is the number that tells you what living with this trader feels like, and — as we'll get to shortly — the listed figure is best understood as a floor, not a ceiling. Anything above 40% means the strategy has already survived a near-death experience once and is presumably willing to have another. Between 20% and 40%, proceed carefully. Under 15% across multiple years is genuinely uncommon and worth respect, assuming the history is long enough to mean anything.
3. Total trades. Statistical sample size, plainly. Fifty trades is an anecdote. Two hundred starts to be a record. A thousand-plus and the averages begin to deserve the name. Also glance at trade frequency: 900 trades in two months is a scalping bot whose backtest-to-live gap will be enormous, and whose results are hostage to execution quality you can't replicate.
4. Profit factor. Gross profit divided by gross loss. Below 1.0 the account loses money; that's occasionally on public display, which is almost charming. Realistic good sits around 1.3 to 2.0. Above 3.0 across a large sample, you're usually looking at either a short lucky window or — far more often — a martingale-style strategy that hasn't taken its catastrophic loss yet. Grid and martingale systems produce gorgeous profit factors right up until the day they produce a margin call.
5. Average win versus average loss, and win rate together. A 90% win rate sounds superb until you see the average winner is $14 and the average loser is $390. That shape — high win rate, tiny wins, occasional enormous loss — is the fingerprint of no-stop-loss trading, and it's the single most common shape among flashy Myfxbook pages. The equity curve looks like a staircase to heaven. The open-trades tab looks like a hostage situation.
Ten minutes, five numbers, fixed order. You've now done more analysis than 95% of the page's visitors. The remaining work is checking whether the numbers you just read were manufactured.
Drawdown on Myfxbook: why the listed figure flatters everyone
Of the five numbers, drawdown is the one where the platform itself will quietly mislead you — not through dishonesty, but through measurement mechanics that happen to favour the person being audited.
Myfxbook's headline drawdown is calculated from equity at the moments it samples, and its standard figure leans heavily on closed outcomes. A trader running positions without stops can sit on a floating loss of 55% for three weeks, and provided those positions eventually claw back to profit before being closed, the listed drawdown barely registers the ordeal. The account holder was three bad candles from a margin call. The statistic remembers a flesh wound.
This is not a small distortion. It is the distortion for exactly the strategy type most likely to be marketed to you — grid, martingale, "recovery zone" systems whose whole design is to convert would-be realised losses into long-lived floating ones. Their listed drawdowns are fiction with a methodology.
So audit floating exposure directly. Open the "Open Trades" tab — right now, while you're on the page. A verified account currently sitting on minus 30% floating, with the headline drawdown listed at 12%, has just told you which number to believe. Then look at the history for clusters: many positions in the same instrument, same direction, opened at stepped intervals, all closed within the same minute. That's a basket being rescued, and it means the true historical drawdown lived somewhere the summary statistics don't visit.
The listed drawdown is the account's best day in court. The open-trades tab is the security-camera footage.
Two more practical checks. First, the drawdown chart under the Analysis section shows drawdown over time; a strategy that repeatedly plunges and recovers is showing you its habits, and habits repeat. Second, compare drawdown to the gain that accompanied it. A 60% annual gain against a 45% drawdown is not a good trader; it's a leveraged coin toss that came up heads this year. As a rough yardstick, a gain of less than twice the max drawdown means you're being asked to risk a pound to make a pound — and the market makes no promises about which comes first.
We run gold, which moves hard enough to punish exactly this kind of hidden-exposure trading. Losses on the page and no floating skeletons in the open-trades tab — that's the whole bar, and it's remarkable how many pages fail it.
Manipulation 1: hidden trade history
Now the deliberate stuff. The first and crudest manipulation is simply hiding the evidence, and Myfxbook — built for traders' privacy as much as for public audit — makes it one click.
Account owners can toggle the visibility of their trade history. The summary statistics stay public: gain, drawdown, profit factor, the lovely green line. The individual trades that generated them go dark. The sales pitch survives; the audit trail doesn't. You'd think this would be rare among people actively soliciting money. Open ten manager pages from Telegram ads and count how many have a visible history tab. It will be an educational afternoon.
What hidden history prevents you from checking is nearly everything that matters:
- Lot sizing over time. Was the gain earned at consistent risk, or did the account bet big once, get lucky, and revert to micro-lots to preserve the statistic?
- Loss distribution. Are losses regular, controlled and stopped — or absent for months, then one monster?
- Instrument drift. Does the "gold specialist" have a history full of exotic crosses and crypto CFDs from the phase before the current pitch?
- The rescue pattern. Those same-minute basket closures we just discussed only show up in trade-level data.
- Weekend and news-gap behaviour. Positions habitually held through NFP and Fed announcements tell you the real risk appetite regardless of what the bio says.
The excuse offered is always "protecting my strategy." It doesn't hold. Closed historical trades reveal roughly nothing exploitable about a strategy's future signals — every prop firm, fund and regulator on earth reviews trade-level history precisely because it's evidence, not secret sauce. What trade history reveals is conduct. That's why it gets hidden.
There's a softer variant worth knowing: history visible, but the account is young and the manager's previous accounts are nowhere linked. Myfxbook profiles can list multiple accounts, and managers curate that list. The profile showing one beautiful eight-month account may belong to someone on their fifth attempt, accounts one through four having ended the way most aggressive accounts end. You can sometimes catch this through the manager's forum posts, old community threads, or a web search of their username plus "myfxbook" — dead accounts leave cached shadows. It's the same survivorship trick fund marketers have run for decades, just with a fresher interface: show the fund that lived, incinerate the record of the ones that didn't.
Auditor's rule: statistics without inspectable trades are claims, not evidence. The badge verifies that Myfxbook saw the trades. If you can't see them, you're back to trust-me — with better graphic design.
Manipulation 2: demo accounts and cent-account dressing
The second manipulation targets the question almost nobody thinks to ask: real money, and how much of it?
Start with the obvious one. Myfxbook tracks demo accounts exactly as happily as live ones, and it does label them — there's a "Demo" tag in the account information block. But the label sits in the info panel, not stamped across the equity curve, and a screenshot or an embedded widget on a sales page crops it effortlessly. Rule one, then: never judge from a screenshot or widget; always click through to the actual Myfxbook page and read the account type field with your own eyes. Demo results aren't merely unproven, they're structurally different — no slippage that matters, no requotes, no psychological weight, execution quality no live account will see. A demo track record is a rehearsal tape sold as a live album.
Cent accounts are subtler, and honestly more interesting. These are real-money accounts — the "Real" label shows, truthfully — where balances are denominated in cents. A deposit of $87 displays as 8,700 units. Percentages are unaffected, so the gain figure is honest as far as it goes. What's distorted is stakes. The swaggering manager with the 300% verified gain may be risking, in total, less than your monthly phone bill. And risk tolerance does not scale. A strategy someone happily runs on $87 — full-margin punts, no stops, revenge doubling — is not the strategy they'd survive running on your $20,000, and more to the point, it's not a strategy at all. It's a lottery ticket with a stats page.
So read the deposit history (it's in the account info and the history tab) and answer three questions. What's the actual deposit in actual currency? A number under about $500 means you're looking at a marketing exhibit, whatever the percentages say. Is the broker one of those known for cent denominations, and does the balance look suspiciously like a large round number of tiny units? And has meaningful money ever been withdrawn — because a manager genuinely living on trading profits leaves withdrawal footprints, and their total absence from a supposedly lucrative account is its own quiet tell.
There's also the flip: an account seeded small precisely so it can be traded recklessly. Blow it, delete it, nobody ever sees; triple it, publish it, and it becomes the storefront. At $100 a ticket a marketer can run this lottery until they hit a winner. This is why history length and deposit size have to be read together — a short, small, spectacular account isn't a discovery. It's a survivor of a process designed to produce survivors.
If you're evaluating someone to trade your account rather than just sell you signals, this is exactly where the diligence stakes jump — we've laid out the broader safety checklist in is forex account management safe, and the deposit-size check belongs near the top of it.
Manipulation 3: custom date ranges and the vanishing losing period
The third manipulation is the most elegant, because it involves showing you completely genuine data — carefully framed.
Myfxbook lets viewers (and, more usefully for our purposes, embedders) set custom date ranges. Every statistic recomputes for the window: gain, drawdown, profit factor, the lot. So a manager whose account did minus 38% across a grim eight months, then caught a strong run, simply embeds the widget with the range starting the week the run began. The widget is verified. The data is real. The eight months of carnage have not been deleted — they've been framed out of shot, which for the eleven-second visitor is the same thing.
The defence is trivially simple, which is what makes the trick's continued success so annoying: on the actual Myfxbook page, set the range to All history yourself, and treat any marketing material showing a partial window as a partial window. When someone leads with "up 140% since January," your first question is not about the 140%. It's about what predates January.
The harder variant is the clean amputation: close the old account, open a new one, connect only the new one. Nothing on the fresh page hints at the predecessor — same trader, same strategy, new birth certificate. This is the account-level version of the survivorship trick from the hidden-history section, and it's rampant because it's cheap. Your countermeasures are circumstantial but real. An account inception date that sits oddly close to when the person started marketing themselves. A "veteran with ten years' experience" whose oldest visible account is fourteen months old — ask, directly, where the other nine years live. A username with forum posts referencing accounts that no longer appear on the profile. None of these is proof. Together they're a pattern, and auditing is pattern work.
Date-range games also hide inside the annual and monthly tables. Myfxbook's Monthly Analytics view shows gain by calendar month, and it's one of the most honest views on the platform — which is precisely why sales pages never screenshot it. A strategy showing +9%, +11%, +8%, −41%, +12% has told you its true character in one row of a table. Always open it. Thirty seconds, and it defeats every framing trick at once, because calendar months don't care where the marketer wanted the story to start.
One heuristic to close this section: honest operators volunteer their bad periods, because they know the bad periods are coming up in due diligence anyway and being first to mention them is cheap credibility. When every number you're shown has been pre-framed to flatter — when you have to extract the losing months — you've learned something about the relationship on offer. The framing is the confession.
Gain versus absolute gain: the deposit-inflation trick
Here's the reason we told you to skip the big headline number earlier. Myfxbook shows two gain figures, "Gain" and "Absolute gain," they diverge wildly on manipulated accounts, and the divergence is the tell.
Gain is time-weighted. It chains together period returns so that deposits and withdrawals don't distort the percentage — the standard, correct way to measure a trader's skill independent of cash flows. Absolute gain is simply net profit divided by total deposits: the blunt answer to "how much money did this account actually make relative to what was put in?"
On an honest account with a single deposit, the two track closely. The trick lives in the gap. Time-weighted chaining means returns earned on a tiny balance carry full weight in the headline figure forever. So: deposit $100, run it hot — coin-toss trading is fine, remember the lottery from the last section, and you only publish the winners — and turn it into $700. That's +600%, permanently chained into the Gain figure. Now deposit $20,000 of calm, and trade it gently at a few percent a year, or barely at all. Years later the page still leads with a triple-digit lifetime Gain, while Absolute gain — profit over total deposits — sits in single digits. Both numbers are computed correctly. One of them is describing $600 of profit on a page being used to solicit six-figure allocations.
The audit takes twenty seconds. Read both figures — Absolute gain sits right there in the left-hand info column — and when they differ by a large multiple, open the deposit history and find out why. What you're looking for is the shape: small early deposit, explosive early gain, then a much larger deposit and a much quieter chart. That shape has one honest explanation (a trader who genuinely scaled up after proving the strategy — in which case the recent performance on the large balance should still look respectable on its own) and one dishonest one. The recent-months check from the previous section settles which you're looking at.
While you're in the deposit history, note withdrawals too, in the other direction this time: a large withdrawal right after a strong run, leaving a small balance to trade aggressively again, is the same trick run on a loop — harvest the real money, keep the casino balance small, keep the percentage engine running. The percentages compound in the marketing. The risk never compounds in the account.
The general principle is worth stating because it applies well beyond Myfxbook: any performance statistic that can be moved by cash flows rather than trading will, on marketing pages, have been moved by cash flows rather than trading. Percentages answer "how skilled?" Currency answers "how much, on how much?" An auditor always asks the second question, in pounds and dollars, before believing any answer to the first.
A full worked audit, start to finish
Let's run the whole drill on a composite page — call the manager Sam, managing "VIP accounts" from a Telegram channel with 40,000 subscribers and an ad budget. Sam's pinned message links a Myfxbook showing +212% and the caption "fully verified, DM to invest." Here's the ten-minute pass, in real order.
Minute one — badges and pulse. Track record verified: green. Trading privileges verified: grey. Sam's pinned FAQ pre-empts this: "I don't share my master password with third-party sites for security reasons." You already know this excuse. Strictly, the audit can end here — the gate rule — but let's keep walking for the education.
Minutes two and three — the five numbers. History: 9 months. Max drawdown: 11.8%, suspiciously serene. Trades: 1,140 — heavy frequency for the style claimed. Profit factor: 3.4, which on a thousand-plus trades is either world-class or structural. Win rate 91%, average win $6.10, average loss $88.40. There it is: the staircase-to-heaven shape. The 3.4 profit factor isn't skill; it's the arithmetic of a strategy that hasn't paid its bill yet.
Minute four — open trades. Fourteen positions, all gold longs, stepped entries every four dollars down, floating minus 27% on a page listing 11.8% max drawdown. The listed drawdown was the best-day-in-court figure; this tab is the footage. The account is mid-rescue right now, while the pinned message solicits deposits.
Minutes five and six — account information. Type: Real. Broker: an offshore name you'd struggle to spell twice. Deposit history: $214 total. Absolute gain: 61% against the headline 212% — the gap says the big percentages were earned early and small. Withdrawals: none, ever, from a man selling a lifestyle of them.
Minutes seven and eight — history and monthly table. Trade history: visible, to Sam's partial credit. Lot sizes wander from 0.01 to 2.0 with no relationship to balance. Four separate days show six-plus positions closed inside the same minute — basket rescues on the record. Monthly analytics: seven green months between +4% and +16%, one month at −0.2%, and the current month, courtesy of the open float, unpublished-ugly.
Minutes nine and ten — the person. The Myfxbook username, searched, surfaces a two-year-old forum thread where the same handle promoted a different broker and an account that no longer exists on the profile. Predecessor account, amputated.
Verdict: one grey badge, one strategy-shape red flag, one live floating catastrophe, a stake of $214, and a vanished prior account. Sam might even believe in the system — plenty of martingale evangelists do, right up until the account does what these accounts do. Doesn't matter. You're not auditing sincerity. Total elapsed time: under ten minutes, and every check used nothing but the free page and a search engine. And if Sam had already taken money on the strength of that page, the next stop is knowing how to report a forex scam properly — though the entire point of the ten minutes is never needing that article.
Red-flag combinations to memorise
Individual flags have innocent explanations sometimes. Combinations rarely do — fraud is a system, and systems leave matching parts. These are the pairings that should end your evaluation on the spot, roughly in order of how often they appear in the wild.
- High win rate + average loss many times the average win. The no-stop signature. The equity curve will look wonderful until the one week it doesn't, and that week is not survivable at real size.
- Serene listed drawdown + ugly open-trades tab. The account is telling you its statistics and showing you its reality simultaneously. Believe the tab.
- Grey privileges badge + a confident security excuse. Verification costs an honest manager days of admin and a fraud everything. The excuse is the tell.
- Triple-digit Gain + single-digit Absolute gain. Deposit inflation. The skill on display was rented on a tiny balance.
- Real account + sub-$500 total deposits + solicitation of four-figure investments. They're asking you to fund a risk they've never taken themselves.
- Short shining account + a backstory of long experience. Ask where the other years live. Watch what happens to the conversation.
- Hidden trade history + any request for money whatsoever. Statistics without inspectable trades are claims. You don't wire money to claims.
- Marketing screenshots with date ranges that never start at inception. The framing is the confession.
Notice something about that list: not one item requires you to judge whether the trading is good. That's deliberate, and it's the deepest point in this whole piece. Amateurs audit performance. Auditors audit integrity of evidence — completeness, ownership, stakes, framing — because performance claims are only worth evaluating once the evidence would survive a hostile reading. Most pages fail on evidence long before you'd need an opinion on the strategy. Which is convenient, because evidence is checkable in ten minutes and strategy quality genuinely isn't.
Keep a literal checklist if it helps. Badges, five numbers in order, open trades, deposit history, both gain figures, monthly table, all-history range, username search. Eight lines.
Where this leaves you
Here's the uncomfortable summary. Myfxbook is one of the best tools retail forex ever built for honesty, and in practice it functions, for most visitors, as a prop in other people's marketing — not because the platform lies, but because reading it properly takes ten minutes and the average visitor spends eleven seconds. The gap between those two numbers is where the industry's worst people make their living.
You now have the ten-minute version. Badges first, and treat a grey one as a locked gate rather than a talking point. Five numbers in fixed order, with history length deciding how much the other four are worth. Drawdown read from the open-trades tab, not the summary. Then the three manipulations hunted deliberately, with the Gain-versus-Absolute-gain gap as your fastest single tell. None of it requires maths beyond division. All of it requires actually clicking the tabs.
Two closing thoughts, one about them and one about us. About them: apply the standard symmetrically. A page that passes this audit deserves genuine credit — full badges, visible history, real stakes, losses on the record. Those accounts exist. The audit isn't cynicism; it's how the honest ones get found.
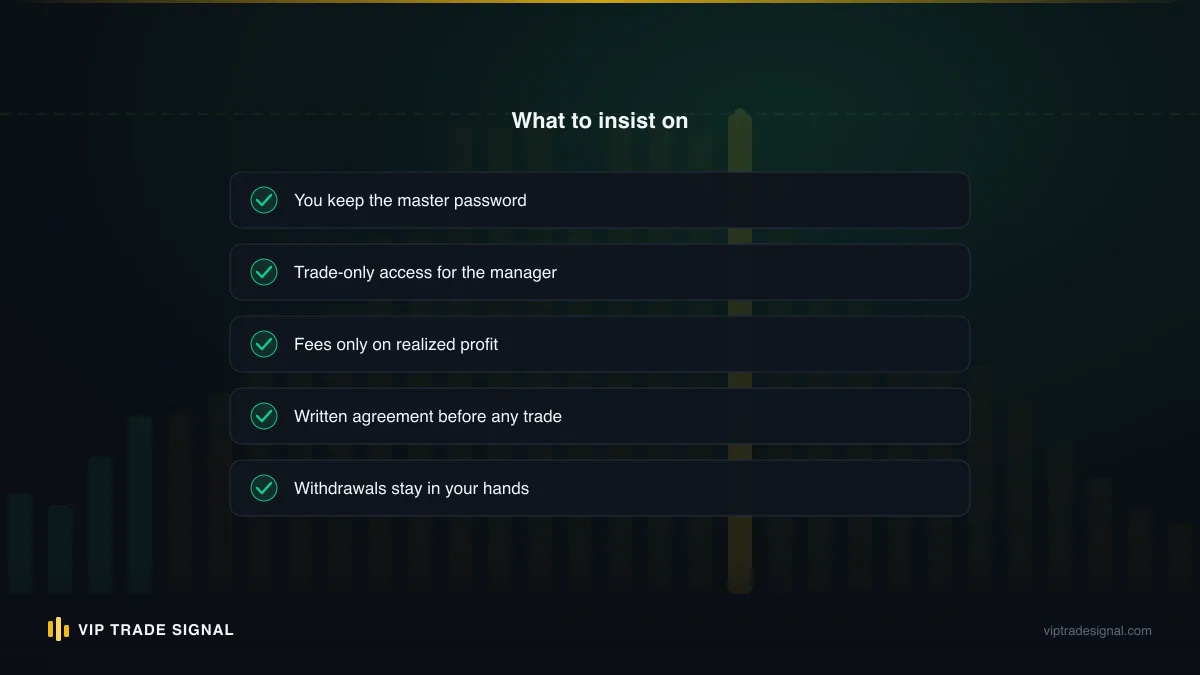
About us: we hold ourselves to the standard because we ask you to use it. Every closed gold signal we've issued sits at /signals/history, losses in full view, and if you're considering our account management service — where we trade your own MT4/MT5 account, you keep the master password and the withdrawals, and we're paid 50% of realised profit only — the right move is to audit us exactly as hard as you'd audit Sam. Ask for evidence, read the open positions, question the fee structure; the FAQ covers the mechanics, and anything it doesn't, ask directly. Gold is a violent instrument, we lose trades every month, and nothing here is personalised advice or a promise of profit — anyone who offers you the latter has told you everything you need to know about their Myfxbook before you've even opened it.
Ten minutes. Before any money moves. Every time.