There is a particular kind of email we get every few weeks. The subject line is usually calm. The screenshot attached is not. A gold account, balance somewhere around $17,000, equity somewhere around $7,000, and forty-odd open positions stacked in one direction like commuters pressed against a train door. The sender bought a grid EA three months ago. The vendor's myfxbook page showed a balance line so smooth you could iron a shirt on it. Nobody mentioned the other line.
That gap between balance and equity is the whole subject of this piece. Grid trading floating drawdown risk is the one number that decides whether a grid system survives, and it is the one number almost no vendor publishes, because publishing it would kill the sale. The good news is you don't need the vendor. You can compute a grid's worst-case exposure yourself, on a napkin, in about ten minutes, before you ever let it touch live money.
We'll do exactly that below, with real gold numbers. We'll also look at why the balance curve lies by design, what separates a grid from a martingale (less than you'd hope), and what rescue actually looks like when a grid is nine grand underwater and still adding positions. Fair warning: some of what follows is uncomfortable arithmetic. It is much cheaper to be uncomfortable now than at 3am during a margin call.
How a grid actually works
Strip away the marketing and a grid is a very simple machine. It places orders at fixed price intervals, the levels of the grid, and takes small profits whenever price crosses back through a level. A buy grid on gold might open 0.10 lots every $5 down: one position at 3,300, another at 3,295, another at 3,290, and so on. Each position has a take profit a few dollars above its entry. When price chops sideways, positions open and close constantly, and each close books a small win.
That is the entire trick. A grid converts sideways movement into a stream of little realised profits. And gold does spend a lot of time going sideways, which is why grid EAs backtest so beautifully on range-bound stretches and why the first few months of live running often feel like free money.
Notice what's missing, though. There is no stop loss anywhere in that description. There almost never is. A grid's answer to a losing position is not to close it but to open another one at a better price and wait. The system doesn't have losing trades in the conventional sense. It has open trades and it has won trades, and its accounting depends entirely on the assumption that every open trade eventually becomes a won trade because price eventually comes back.
Sometimes price does come back. Gold has retraced enough moves over the years to make grid sellers look like geniuses in hindsight. But "eventually" is carrying an enormous amount of weight in that sentence, and your margin does the carrying in the meantime. A grid is, in plain terms, a bet that price will revisit your entries before your equity runs out. That's a probabilistic bet with a finite bankroll behind it, which means it can be lost, and when it's lost it's lost all at once.
One more mechanical point, because it matters later. Grid exposure is cumulative. Each new level doesn't replace the previous position; it stacks on top of it. Ten levels into an adverse move you are not carrying one bad trade, you're carrying ten, and the oldest one is the deepest underwater. Keep that stacking in mind. It's why the maths in a moment goes quadratic rather than linear, and quadratic is the word that ends accounts.
The balance curve illusion
Open the sales page of any grid EA and you'll find the same graph: a balance line marching up and to the right, month after month, barely a wobble. It looks like the output of someone who has solved trading. It is actually the output of someone who has redefined losing.
Here's the mechanism. Balance only records closed trades. A grid closes winners quickly and never closes losers, so every trade that reaches the balance line is, by construction, a win. The losers exist, often dozens of them, but they sit in the open-positions tab as floating loss, invisible to the balance curve entirely. The graph isn't fabricated. It's just answering a different question than the one you think you're asking. You want to know "is this system making money?" The balance curve answers "has this system booked its winners?" Those are not the same question, and the distance between them is precisely the floating drawdown.
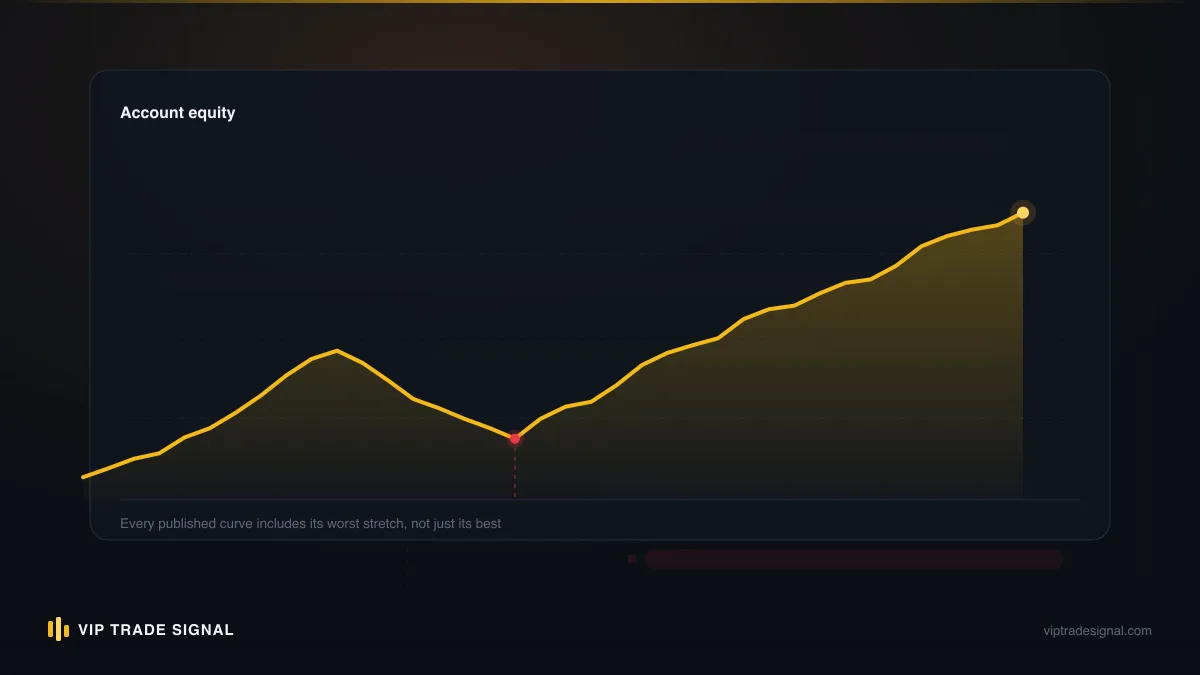
The honest graph is the equity curve, balance plus the open profit and loss, and on a grid it looks nothing like the brochure. It grinds upward in the flat periods, then plunges every time gold trends, sometimes recovering, each plunge deeper than the banked profits are tall. We've reviewed accounts where the grid had realised $1,900 in closed profit over seven months and was simultaneously floating $9,000 down. On the vendor's preferred chart, that account is a success story.
A grid never loses on paper because the paper only records the wins. The losses live in the open-positions tab, compounding quietly, waiting for a trend.
So a simple rule when you evaluate any grid, vendor-sold or homemade: refuse to look at balance at all. Equity or nothing. On myfxbook, that means the equity growth line and the open-trades tab, not the headline gain figure. If a vendor's page hides open drawdown, or shows a track record that conveniently restarts every few months (accounts that blow up don't leave graphs behind, they just get replaced with fresh ones), you already have your answer. And if you're running a grid yourself right now, pull up your own equity curve tonight. Plenty of people genuinely do not know their own number, because MT4's default view puts balance in big print and floating P/L in small.
Grid trading floating drawdown risk: where the losses live
Every trading system loses. The only real question is where the losses go. A stop-loss system sends them to the balance line immediately: small, frequent, visible, painful in the honest way. A grid sends them to floating drawdown instead: deferred, aggregated, and growing, right up until the day they all arrive at once.
It helps to think of floating drawdown as a debt the grid is running up on your behalf. Each small banked profit is income; each open underwater position is borrowing. The system looks profitable exactly the way a household looks prosperous while living on credit cards. And like credit card debt, the floating kind compounds against you in ways the income never matches. The grid banks $3 or $4 per closed level, while the deepest open level can be $40, $80, $150 underwater on its own. It routinely takes months of banked income to equal what one bad fortnight parks in the floating column.
This is why we'd argue grid trading floating drawdown risk deserves to be measured before anything else about the system, before the win rate, before the backtest, before the monthly return. Win rate on a grid is almost meaningless (it's high by construction, often 90%-plus, since only winners close). Monthly return is a balance-line artefact. The floating number is the system's real ledger.
There's a second, nastier property: floating drawdown on a grid isn't just large, it's unbounded until margin ends the discussion. A stop-losing trader can tell you their worst case per trade to the dollar: a $2,000 account risking 1% has $20 of room per trade, full stop. A grid trader, asked the same question, usually can't answer, because the honest answer is "it depends how far gold runs", which is another way of saying "I don't know". The grid will keep opening levels into a trend until it either runs out of configured levels or runs out of your equity, and most retail configurations run out of equity first.
None of this makes floating loss uniquely evil, to be fair. Every open trade floats before it closes; that's just trading. The problem is scale and intent. A normal trade floats $50 for an afternoon. A grid deliberately accumulates dozens of floating positions as its core mechanism, structurally, by design, in one direction. The float isn't a side effect of the strategy. It is the strategy. Which means you cannot run a grid responsibly without knowing, in advance and in dollars, how big that float can get. So let's compute it.
Computing worst-case exposure, step by step
Here is the calculation no grid vendor puts on the sales page. It needs four inputs and no spreadsheet, though a spreadsheet makes the table prettier.
Step one: dollar value per level. On gold, one standard lot moves $100 per $1.00 of price. So 0.10 lots per grid level means each open level costs you $10 for every dollar gold moves against it. Write that number down; call it V.
Step two: grid spacing. The distance between levels, in dollars of gold price. Call it S. Our example grid uses $5.
Step three: the adverse move you must survive. Call it W. Not the move you expect. The move that would kill you if you hadn't planned for it. Gold has produced $150 moves in a week many times, and $200-plus moves in a month are not rare events; anyone who watched 2024-25 saw several. Pick W honestly. We'd call $150 a bare minimum for gold, and $200 grown-up.
Step four: the formula. After an adverse move of W, the grid has opened roughly n = W ÷ S levels. The first level is the full W underwater, the second is W minus S underwater, and so on down the ladder. Sum the ladder and you get:
Worst-case floating loss ≈ V × S × n(n+1) ÷ 2
That n(n+1)/2 term is the villain of this entire article. It means exposure grows with the square of the move, not in proportion to it. Double the trend, quadruple the pain. Here's our example grid (0.10 lots per level, $5 spacing) worked through:
| Adverse move | Levels open | Floating drawdown |
|---|---|---|
| $25 | 5 | $750 |
| $50 | 10 | $2,750 |
| $100 | 20 | $10,500 |
| $150 | 30 | $23,250 |
| $200 | 40 | $41,000 |
Sit with that table for a second. The move from $50 adverse to $100 adverse doubles the distance but nearly quadruples the drawdown. And this is a modest grid, 0.10 lots, the kind of sizing vendors call conservative. On a $10,000 account, this "conservative" configuration is dead well before gold has trended $100, an amount gold can travel in two sessions when it's in the mood.
Run your own numbers before you argue. Take whatever grid you own or covet, extract V and S from its settings (vendors bury them under names like LotSize and PipStep, and remember gold "pips" in EA settings are often $0.10 increments, so check the units twice), pick W at $150, and turn the crank. If the answer exceeds roughly a third of your account, and it almost always does, the grid is oversized for the account. Not slightly. Structurally.
The fix, if you insist on proceeding, is worked backwards: decide the maximum floating drawdown you can genuinely stomach, say 25% of a $10,000 account, so $2,500, then solve for the lot size that keeps a $150 adverse move inside it. With $5 spacing and 30 levels, n(n+1)/2 is 465, times S is $2,325 per $1-per-level of V. So V must be about $1, which is 0.01 lots per level. One micro lot. That is the honest size for this grid on this account, and it will bank pennies, which tells you something true about the strategy's real economics that the sales page never will.
Trend runs: the grid killer
Everything above stays theoretical until gold trends. Then it stops being theoretical extremely fast.
Ranges are a grid's habitat; trends are its predator. And gold, of all instruments to run a grid on, is a trending animal. It ranges for weeks, yes, but its whole appeal to traders is that when it moves, it moves: central bank buying, a geopolitical shock, a dollar rout, and suddenly you're watching $60 days stack into a $250 fortnight. In 2024 and 2025 gold repeatedly ran hundreds of dollars with barely a pullback deep enough to close one grid level. Anyone short a grid into those runs learned the n(n+1)/2 lesson with live ammunition.
The cruelty is in the shape of the experience. A trend against a grid doesn't feel dangerous at first; it feels like the system working. Levels open, the float grows, but the float always grows before it recovers, that's the pattern you've watched for months. At ten levels down you're calm. At eighteen you're checking the terminal at dinner. At twenty-five you're doing arithmetic in the dark and discovering, some of you for the first time, what the formula above would have told you for free: the next $30 of trend costs more than the last $60 did.
And here the psychology becomes the second killer, because at that depth every option is bad and the least-bad one hurts the most up front. Close everything and you convert a horrifying float into a horrifying realised loss with one click, months of banked profit gone and then some. Hold and you're betting the remainder of your equity on a retracement arriving before the margin call does. Most people hold. Not because holding is right, but because closing makes the loss real, and the grid has spent months training them that floats recover. Sometimes the retracement even comes, which is the worst outcome of all, because it teaches you the hold was wisdom rather than luck, and you'll hold again next time with more size.
A brief word on the "news filter" defence, because every vendor offers one. The pitch is that the EA pauses before big scheduled releases, NFP, CPI, Fed days, and therefore dodges the trends. It's half true and wholly inadequate. Scheduled news causes spikes; the moves that kill grids are multi-week repricings, and those don't book an appointment. Gold's biggest runs of the past few years began on quiet days and simply refused to stop. A filter that sidesteps thirty minutes of volatility does nothing about eleven sessions of one-way drift, and the drift is what fills the ladder.
There's no clever twist here. Trends are not a tail risk to a gold grid; they're a certainty on any horizon longer than a few months. The only questions are when, how far, and whether you sized for it in advance. Which is why the worst-case number from the previous section isn't pessimism. It's a scheduling estimate.
Grid vs martingale: cousins, not opposites
Vendors love this sentence: "This is a grid system, NOT martingale." The capitals are usually theirs. It's meant to reassure, since martingale has a deservedly radioactive reputation. But the comparison flatters grids more than the maths does, so let's be precise about it.
A martingale increases lot size after losses: 0.01, then 0.02, then 0.04, doubling until one win recovers the lot. Exposure grows geometrically with each step. A pure grid keeps lot size flat per level and grows exposure by stacking positions, which, as we've seen, makes total drawdown grow quadratically with the adverse move. Geometric is faster than quadratic, so yes, a grid dies more slowly than a martingale. That is the entire substance of the boast. It's the difference between a debt at 40% interest and a debt at 25%: a real difference, worth knowing, and not remotely the same thing as safe.
The family resemblance runs deeper than either camp admits:
- Both refuse to realise losses, deferring them into an ever-growing open position instead.
- Both harvest small frequent wins and bank them, manufacturing a beautiful balance curve.
- Both stake the entire account on the market turning before equity runs out.
- Both produce years of smooth profit followed by one terminal event, the classic "picking up pennies in front of a steamroller" return profile.
And in the wild the two blur together anyway. Plenty of commercial grid EAs quietly add a lot multiplier per level (1.3x or 1.5x is common, hidden under a setting called something like Multiplier or Exponent), at which point you own a martingale wearing a grid's name tag. Check that setting before anything else. If the multiplier is anything above 1.0, every calculation in this article needs redoing with worse numbers, and our step-four formula becomes the optimistic case.
The deeper point is that grid-versus-martingale is the wrong debate. Both belong to the same species: systems with no stop loss, whose losses accrue as float until they can't. The meaningful dividing line in trading runs elsewhere, between systems that define their worst case per trade and systems that let the market define it. We've written about that trade-off directly in hedging versus stop losses, and the conclusion there applies with full force here: a defined loss taken today is almost always cheaper than an undefined one deferred.
A grid at minus $9,300: how it got there
Let's make this concrete with a composite of accounts we've actually been handed, details changed, arithmetic real. Call the owner Sam.
Sam bought a sell-side grid EA for gold: 0.05 lots per level, $4 spacing, no multiplier, take profit $4 per level. Small sizing by grid standards; Sam had read enough to avoid the 0.30-lot lunacy. He put it on a $15,000 account in the spring and it behaved exactly as advertised. Seven months of choppy gold, roughly $1,850 banked, balance $16,850, never more than a few hundred floating. Sam, reasonably, relaxed.
Then gold caught a bid and rallied $120 in eleven sessions without a pullback deep enough to close a single level. Run our formula: V is $5 per dollar per level (0.05 lots), S is $4, so a $120 move opens 30 levels and floats 5 × 4 × 465 = $9,300. Sam's terminal agreed to the dollar. Balance still $16,850, wearing its little seven-month smile. Equity $7,550. Half the account gone and, on the vendor's preferred chart, nothing had happened at all.
Now the part people never compute in advance: how much room was actually left. Thirty levels of 0.05 is 1.5 aggregate lots short. At gold around $3,300, that's roughly $495,000 of notional; at 1:200 leverage, about $2,475 of margin. Equity $7,550 against margin $2,475 is a margin level near 305%, which sounds comfortable until you remember the quadratic. The next $40 of rally opens ten more levels, adds margin, and drags the float toward $16,000. Somewhere around $45-$50 of further trend, less than one good day for gold in that mood, the account hits stop-out and the broker starts force-closing positions into a running market. Seven months of patience, ended by twelve days and change.
Worth pausing on the sizing, too. Sam's 0.05 lots per level genuinely was cautious by the standards of the genre; the default in his EA's preset file was 0.10, and the vendor's "aggressive" profile shipped at 0.30 with a 1.5 multiplier. Run our table on that aggressive preset and a $60 rally, a routine week for gold, produces a float north of $30,000 before the multiplier even finishes compounding. People attach these presets to $5,000 accounts. The blown-account stories that circulate in grid EA Telegram groups aren't unlucky outliers; they're the preset file working exactly as configured.
Sam wrote to us at the $9,300 mark, which was the single best decision in this story, because there was still equity to work with. Most people write after the stop-out, when the question has changed from "how do we manage this?" to "what happened?". The uncomfortable answer to the second question is always the same: nothing happened that the four-input formula wouldn't have predicted in the spring, for free, before the EA was ever attached. The $9,300 wasn't bad luck. It was a scheduled payment on a loan Sam didn't know he'd taken out.
Margin planning if you must run one
We'd rather you didn't run a grid at all on gold. But some of you will anyway, so here is the grown-up version, because grid trading margin requirements are the second calculation vendors skip, and margin is what actually pulls the plug.
Your account survives an adverse move only while equity stays above the broker's stop-out threshold times margin used, and both sides of that inequality move against you as levels stack: equity falls quadratically while margin used climbs linearly. Plan both. For a given worst-case move W: worst-case floating loss from our formula, plus margin used of n levels × lot size × 100 oz × gold price ÷ leverage. Your starting equity must exceed the sum with room to spare, and "room to spare" should account for spread widening and slippage on exactly the violent days when this matters.
Practical rules we'd actually stand behind:
- Size from the formula, not the vendor preset. Solve backwards from the drawdown you can survive at W = $200 on gold. Expect the answer to be 0.01 or 0.02 lots per level on a five-figure account, and expect to be disappointed by the banked income at that size. That disappointment is information.
- Cap the level count in the EA, and pair the cap with a decision. Max 15 levels means the grid stops digging at 15, but you must decide in advance, in writing, what happens at 15: close all, hedge, or hand over. A cap without a plan just relocates the panic.
- Set a hard equity floor. Pick an equity number, say 75% of starting balance, at which everything closes, no debate. Some platforms let you automate this; do. A rule you must execute manually at 2am, mid-trend, against months of conditioning, is barely a rule.
- Treat leverage as rope, not headroom. 1:500 doesn't make the grid safer; it lets you stack more levels before stop-out, which the quadratic converts into a strictly larger cheque on the same bad day.
- Never run two grids that can align. A buy grid on gold and a sell grid on silver are one correlated position wearing two hats, and they will discover their correlation during exactly the move that hurts both.
Follow all five and you'll have a grid that banks small change slowly and survives most years. Which raises the fair question of why bother, and honestly, we think that question answers itself, but at least it would be a choice made with open eyes rather than a countdown you never saw running.
Warning signs a grid is past saving
Not every underwater grid is doomed. Some are one modest retracement from whole. The skill is telling the difference early, while options still exist, and there are concrete markers we look for whenever someone sends us a terminal screenshot. Losses at this depth are normal, by the way, not shameful; what matters is what you do in the week after you notice them.
Floating loss above 40% of equity. Below that line, disciplined partial closes and a hedge can usually stabilise things. Above it, the maths starts demanding a retracement so deep that you're no longer managing, you're praying with extra steps.
Margin level under about 200% with the trend still intact. Stop-out arithmetic now runs your account. One ordinary trending day can take the decision away from you entirely, and forced liquidation into a running market always fills worse than any exit you'd have chosen.
The recovery maths has gone silly. Work out what retracement makes you whole. If the answer is "gold needs to give back $90 of a $120 rally without opening meaningful levels on the way down", you're not holding a position, you're holding a lottery ticket with margin requirements.
You've started doubling. Adding manual positions below the grid, widening the take profits, switching on the multiplier, "averaging down on the average down". This is the account owner joining the EA's logic instead of overruling it, and it's the single most reliable predictor of a blown account we know.
You've stopped looking. Not checking the terminal for days because the number hurts. Understandable, human, and operationally identical to abandoning the account during the exact window when action still helps.
Two or more of those and the honest conclusion is that the grid, as configured, has already failed; what remains is salvage, which is a different discipline with different rules. Salvage optimises for how much equity leaves the wreck, not for getting back to breakeven, and confusing those two goals is how a 40% drawdown becomes a 100% one. Which brings us to what salvage actually involves.
What rescuing a drowning grid actually looks like
First, the thing nobody wants to hear: rescue does not mean recovering the floating loss. Anyone who promises to trade a nine-grand float back to zero is selling you the same hope the grid sold you, at a second markup. Rescue means stopping the bleeding, restructuring the exposure, and then, market permitting, working the hole smaller over weeks. Sometimes the right professional answer is "close 60% of this today and eat the loss", and a rescuer who never says that isn't rescuing.
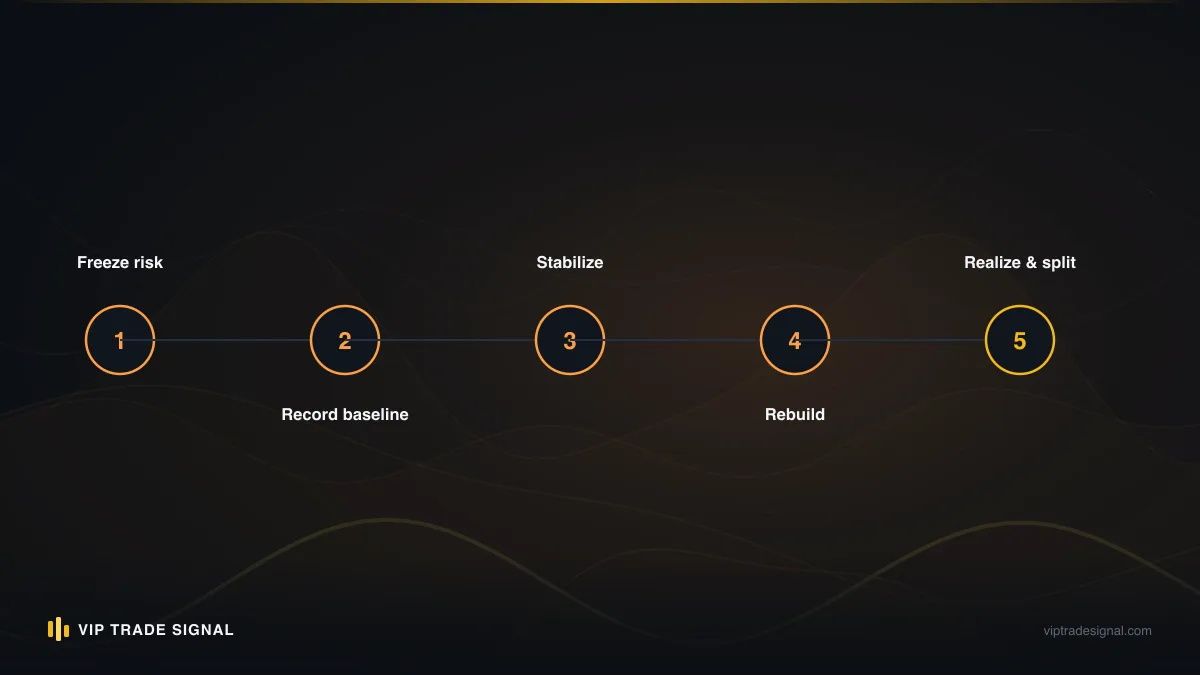
The usual sequence on a grid like Sam's runs something like this. Kill the EA immediately, since a grid that keeps adding levels during its own rescue is a fire that refills its own fuel. Freeze the exposure, often with a temporary opposing hedge, so the float stops tracking every tick while decisions get made; locked structures bring their own traps, though, and we've written up how that goes right and wrong in our piece on rescuing hedged accounts. Then triage the ladder: the deepest levels are usually beyond economic recovery and get closed in staged tranches on strength, while the shallow ones get realistic take profits instead of the grid's original fantasy targets. Realised losses along the way aren't failure. They're the price of converting an unbounded liability back into a bounded one.
Can you run that sequence yourself? Genuinely, sometimes yes, if the float is shallow, your margin is comfortable, and you can execute closes against your own hope. The honest failure mode is that the same optimism that held the grid this long also runs the rescue, and every staged close gets postponed one more bounce. If that's recognisably you, getting a professional between you and the terminal has value beyond the trading itself; we've laid out what that arrangement looks like, and what it can't promise, in when to hire a professional trader for a losing account.
For accounts floating roughly $5k-$10k down, this is precisely what our drawdown management service exists for: we work the account on your own MT4/MT5, you keep the master password and control of withdrawals, and the fee is a flat 50% of whatever profit is actually recovered above a baseline we both record at the start. No recovery, no fee, and no guarantees either way, because anyone guaranteeing recovery on a leveraged gold account is lying to you, and we'd rather lose the sale than join them.
The number to write down before you press start
Strip this article to one sentence and it's this: a grid's true price is its worst-case floating drawdown, and you can know that price in advance.
So here's the homework, and it's shorter than the article. Take the grid you're running or considering. Pull three settings: lots per level, spacing, and the multiplier (pray it's 1.0). Compute V × S × n(n+1)/2 for a $150 adverse move on gold, then again for $200. Write both numbers on a sticky note and put it on your monitor. That sticky note is the bill the market may present, on a date of its choosing, and your only decision is whether you can pay it. If you can't, resize until you can, or bin the EA and lose nothing but a fantasy. Either way you're ahead of roughly 90% of the people currently running grids, most of whom have never done the multiplication.
Our own bias, plainly: we don't run grids on client accounts, ever. Our gold signals carry a defined stop on every single trade, every closed one sits publicly at /signals/history including the losers, and we think a visible losing trade is worth ten invisible floating ones. That's a philosophy, not a guarantee, and you're free to weigh it against the smooth balance curves on offer elsewhere.
But if you're reading this with a terminal already showing five figures of red, skip the homework, since the exam has rather overtaken it. Get the EA off, get the exposure frozen, and get a second pair of eyes on the account this week, whether that's ours through a quick message or anyone competent you trust. Floating drawdown has one consistent habit: left alone with a trend, it grows. The sticky note was cheaper. The next best time is now, and the arithmetic, unlike the vendor, has never once lied to you.