There is a particular kind of quiet that settles over a trader watching gold go against them. A EURUSD position moving the wrong way is an irritation. A gold position moving the wrong way is a countdown. You can sit through sixty pips of euro pain over two days and barely feel it. Gold will hand you the same dollar damage in forty minutes, then do it again before dinner.
We trade one instrument on this desk. Only XAU/USD. So our entire understanding of gold trading drawdown comes from living inside it rather than reading about it, on every signal and every managed account, with no way to change the subject when the metal misbehaves. We have watched accounts sail through choppy forex years and then get folded in half by a single week of metal. Not because the trader got stupid. Because they brought forex habits to an instrument that eats forex habits.
This piece is the long version of what we tell every new subscriber and every account owner who comes to us already deep underwater. Why gold drawdowns are structurally deeper and faster than currency drawdowns. What a lot of gold actually costs you per point, in dollars, in a table you can check against your own last loss. When in the day the damage tends to happen. And the exact control framework we run, published, because a risk framework you keep secret is just a mood.
Why gold drawdowns feel different — because they are
Start with the honest observation most traders make in their first month on gold: it does not feel like a forex pair. It trends harder, reverses more violently, gaps more meaningfully at the Sunday open, and spends far less time in the polite, mean-reverting chop that makes majors survivable for the under-capitalised.
There are structural reasons for that. Gold is not an exchange rate between two managed economies; it is a single asset priced in dollars, pulled simultaneously by real yields, central bank buying, ETF flows, geopolitical fear and plain momentum-chasing. When several of those line up, there is no offsetting central bank on the other side leaning against the move the way there is when EURUSD stretches. The move just runs. In 2024 and 2025 gold put in daily ranges of $30 to $50 with a regularity that would have been headline material a decade earlier, and it did it while the euro was frequently managing sixty pips a day and struggling to hold your attention.
The second reason is who is trading it. Retail brokers report gold among their most-traded instruments, and retail traders overwhelmingly trade it the same size they trade currencies, because the platform makes 0.10 lots of gold look identical to 0.10 lots of anything else. Same order ticket. Same margin-looking numbers. Radically different exposure. The instrument is not lying to anyone, exactly. But the interface flatters you, and the flattery is expensive.
And the third reason is psychological, which does not make it less real. Because gold moves in headline-friendly round numbers, drawdowns on it have a narrative quality. "Gold dropped $60 today" lands differently in your chest than "the euro fell 55 pips", even when the second one cost you more. Traders freeze on gold. They watch. They give a losing position "room to breathe" on an instrument whose idea of breathing is a $25 lunge. By the time they act, the account has crossed from a bad day into a proper gold trading drawdown, and the maths of getting back has changed underneath them.
The dollar-per-pip reality nobody converts properly
Here is the table we wish every broker put on the order ticket. For XAUUSD, one standard lot is 100 ounces, so a $1.00 move in the gold price is $100 per lot, and the "pip" most platforms display (a 10-cent increment) is $10 per lot. Identical per-pip value to EURUSD. Which is exactly the trap, because the pips arrive at four or five times the rate.
| Position size | $ per $1.00 gold move | Typical calm day (~$25 range) | Rough day (~$45 range) |
|---|---|---|---|
| 0.01 lot | $1 | $25 swing exposure | $45 |
| 0.10 lot | $10 | $250 | $450 |
| 0.50 lot | $50 | $1,250 | $2,250 |
| 1.00 lot | $100 | $2,500 | $4,500 |
Now put the majors next to it, because this comparison is the whole argument. A standard lot of EURUSD at $10 per pip, on a representative 65-pip day, exposes you to roughly $650 of daily range. A standard lot of gold on an ordinary $25 day exposes you to $2,500. On a bad day, $4,500. Same lot number on the ticket. Four to seven times the range moving through your equity.
Run the consequence through a real account. Say you have $3,000 and you have been trading 0.20 lots of EURUSD comfortably; a 30-pip stop costs $60, an entirely sane 2%. Carry that same 0.20 lots to gold and give the trade a "sensible-looking" $8 stop, which on gold is tight, and you are risking $160, over 5% of the account, on a stop that normal intraday noise will clip several times a week. Widen the stop to something gold actually respects, say $15, and one loss is $300. Ten percent. Two ordinary losses in a row and you are down 19% and telling yourself the market is rigged.
It is not rigged. You are sized for a different instrument. This is the origin story of the majority of the wrecked accounts that arrive at our drawdown management desk: not exotic strategies, not scams, just forex position sizes ported to XAUUSD and left running until the hole was five figures deep.
Volatility by session: when gold hurts most
Gold does not distribute its violence evenly across the day, and knowing the rhythm is worth real money. The pattern we see, week in and week out, looks like this:
Asian session (roughly 00:00–07:00 GMT). Usually the quietest hours. Ranges of $5 to $10 are common, drifting, mean-reverting, dominated by regional physical demand and position-squaring. It is also, not coincidentally, when overleveraged traders feel safest adding size. Then two things ambush them: occasional sharp moves on Chinese data or PBoC gold-reserve headlines, and the fact that a position opened calmly in Asia is still open when London arrives.
London open through the morning (07:00–12:00 GMT). Volume arrives, spreads tighten, and gold picks a direction. The London AM benchmark brings genuine institutional flow. A fair share of the day's trend is set in these hours, and stops resting just beyond the Asian range get collected with depressing reliability before the real move starts.
The London–New York overlap (12:00–16:00 GMT). This is where gold does most of its damage and most of its giving. US data lands at 12:30 and 14:00 GMT, COMEX is fully awake, and the largest single-hour ranges of the day cluster here. If your account is going to take a $30 punch, the odds heavily favour it happening in this window. It is also when the majority of our own signals fire, because movement is the raw material; we would just rather you meet it sized properly.
New York afternoon (16:00–21:00 GMT). Liquidity thins after London goes home. Trends either grind quietly or produce the whippy, low-volume spikes that make afternoon breakout trades so unreliable. Then the daily close, the brief dead zone, and Asia begins again.
The Sunday open, and the cost of holding on
Two quieter session hazards deserve their own paragraph each. The first is the weekend gap. Gold trades essentially around the clock during the week, but it closes on Friday evening and reopens Sunday, and unlike the majors it gaps with real intent. Geopolitics does not observe market hours, and gold is the instrument that prices geopolitics first. A $10 to $20 Sunday gap through a stop is not a rare event; it happens a handful of times a year, and when it does the stop fills at the reopening price, not the level you typed. The defence is dull and effective: carry smaller size over weekends, or none at all when the news backdrop is loud. If your weekend position could not survive a $25 gap against it, you are not holding a trade. You are holding a lottery ticket with negative expectancy on the spread alone.
The second hazard is swap. Holding gold long overnight usually costs money, and in high-rate environments it costs meaningful money, a few dollars per lot per night with a triple charge on Wednesdays at most brokers. On a quick swing trade it is a rounding error. On a losing position held for six weeks "waiting for it to come back", the swap quietly adds hundreds of dollars to a drawdown that was already doing fine on its own. We have audited underwater accounts where the financing cost of refusing to close was itself larger than the trader's original intended risk on the position. Check your broker's XAUUSD swap rates before you ever plan to hold, and put a number on what a month of holding actually costs.
The practical rule that falls out of all of this: a gold position carried into the overlap must be sized for the overlap. Not for the gentle Asian tape you opened it in. We have reviewed dozens of blown accounts where every entry, individually, looked defensible, and the fatal pattern was simply size added during quiet hours that was still on the table at 13:29 GMT on a CPI day.
News that moves gold $30 in minutes
Every instrument has news risk. Gold has news risk with a multiplier, because it responds to two calendars at once: the US macro calendar, and the fear calendar that does not publish release times.
The scheduled list is short and brutal. US CPI. Non-farm payrolls. FOMC rate decisions and the press conference half an hour later. To a lesser degree PCE, ISM and retail sales. On any of these, a $15 to $30 move inside a few minutes is normal, and $40-plus happens several times a year. The mechanism is real yields: gold pays no interest, so when a hot inflation print or a hawkish Powell shifts rate expectations, the repricing hits gold instantly and hard, frequently with a spike-and-full-reversal shape that takes out stops on both sides before choosing a direction.
Then there is the unscheduled calendar. Missile strikes, bank wobbles, tariff announcements, central bank buying headlines out of Asia. Gold is the market's fear gauge, and fear does not pre-announce. In practice this means a gold trader is never entirely flat of event risk while holding a position, which is not a reason to avoid the instrument. It is a reason to hold sizes that can absorb a $30 shock without the account's survival coming into question.
Three habits we treat as non-negotiable around news:
- Know the day's releases before you size anything. Two minutes on an economic calendar. If CPI or NFP is due, either be flat, be small, or have a stop that will genuinely execute, and accept the slippage risk that comes with it.
- Never widen a stop because news is approaching. That is the exact backwards reflex. The approach of a volatility event is an argument for less exposure, and we watch traders do the opposite weekly.
- Do not trade the first candle. The initial spike on a big print reverses fully often enough that entering inside it is coin-flipping with a wide spread. Let the market pick its direction, then trade the level, not the noise.
Anatomy of a gold trading drawdown, from the inside
Let us walk through a composite. Call him Sam, because every desk knows a Sam, and be clear that he is illustrative rather than a real client. Sam funds an account with $10,000. He has two profitable years of forex behind him and a genuine method: he trades pullbacks to structure, he uses stops, he is not a gambler. In March he adds gold to his watchlist because the trend is beautiful.
Week one goes well. He trades 0.30 lots, his normal size, and wins twice: $900 in profit and the private conclusion that gold is just a faster major. Week two, gold pulls back $35 from the high. Sam buys the pullback at what looks like support with a $10 stop, risking $300. Reasonable, on paper. The level breaks by $4 in the overlap, stops him, then reclaims within the hour. Annoying. He re-enters. Stopped again on a news wick. He is down $600 on the day and now certain that his stops, not his sizing, are the problem.
So he does the thing. Third entry, 0.50 lots, no stop, "because it keeps wicking through and the trend is obviously up". Gold slides $28 over two sessions. Sam is floating $1,400 down, and the drawdown has stopped being financial and started being psychological: he checks the chart at 2am, he skips the exit he promised himself at breakeven, he adds 0.30 more at the round number because averaging down at support worked for years on EURUSD. Another $20 lower and the floating loss is past $3,000, roughly 30% of the account, on an instrument that has moved 1.5% from his first entry.
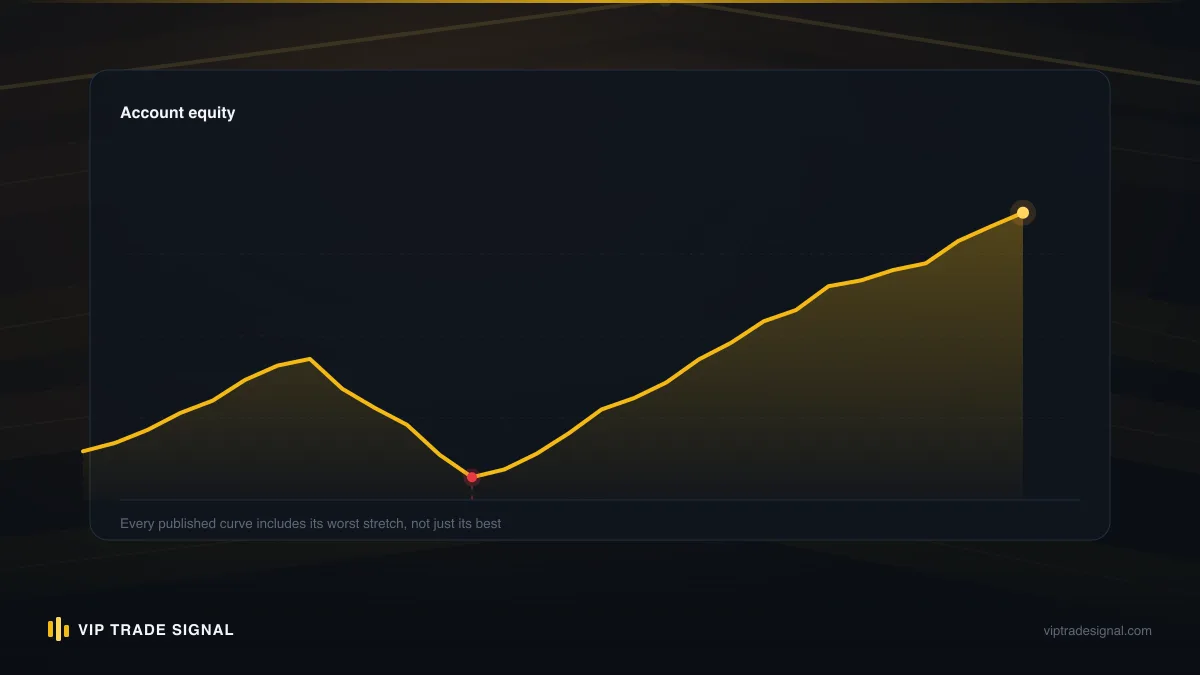
Notice what actually failed. Not the analysis; gold did eventually reclaim the level, weeks later. What failed was that every decision after the second stop-out was made by the drawdown rather than by Sam. That is the defining feature of XAUUSD drawdowns compared with forex ones: they compress the decision timeline. In a slow euro grind you get days to notice you are compounding a mistake. Gold gives you an afternoon, and the arithmetic of recovery is merciless: a 30% hole needs a 43% gain to fill, and a 50% hole needs a double. Trading is risky at the best sizes. At Sam's sizes it stops being trading at all.
Accounts in exactly this state, floating $5,000 to $10,000 down, usually hedged or averaged into paralysis, are the specific thing our recovery service exists for, and if the position is locked rather than merely losing, the mechanics in our piece on rescuing a hedged account are the honest place to start.
Sizing for gold's range, not your forex habits
Everything in gold risk control descends from one substitution: size from the instrument's range, not from a lot number that felt fine elsewhere.
The tool for this is ATR, the average true range, on the daily chart. Through much of 2024–25, gold's 14-day ATR sat between $25 and $45. Your stop on any swing trade needs to live in relation to that number, because a stop much tighter than about a third of the daily range is not a risk decision, it is a donation to whoever runs stops at the London open. So the sizing chain runs backwards from the stop:
- Decide the account risk per trade. We use 1% on managed money, and we would rather you never exceeded 2% on your own. On a $5,000 account, 1% is $50.
- Find the stop the chart requires. Not the stop your risk budget wishes for. If the structure says the trade is wrong $12 away, the stop is $12, which is 120 platform pips.
- Divide. $50 of risk across 120 pips is $0.42 per pip, so 0.04 lots. Yes, 0.04. On a $5,000 account. That is what honest gold sizing frequently looks like, and the discomfort you just felt reading it is the exact gap between forex habits and XAUUSD reality.
The trader who refuses the small size has two honest options: a wider-stop, longer-hold style that needs even smaller size, or a bigger account. The dishonest option, the tight stop on big size, is the one the platform makes easiest, and it manufactures the stopped-out-five-times-then-removed-the-stop spiral from the Sam story with industrial efficiency.
One more habit worth stealing: express risk in currency, out loud, before entry. "I am risking $50 to make roughly $110" is a sentence that keeps you sane. "I'm going 0.04 lots" contains no information your amygdala can use. Every signal we publish ships with entry, stop and targets for this reason; a signal without a stop is an opinion, and you can see the full anatomy of ours, including the losers, on the closed signal history.
Stops and structure on an instrument that ranges $25 a day
Where the stop goes matters as much as how big the position is, and gold has its own grammar here.
Gold respects structure, but it respects it loosely. Levels on XAUUSD are zones, frequently $3 to $5 deep, and the market's favourite move is to pierce a well-watched level by a couple of dollars, harvest the stops parked one tick beyond it, and reverse. So the working rules we drill:
- Place stops beyond the zone, not the line. If support is the 3,305–3,309 area, a stop at 3,304 is bait. Somewhere under 3,298, past the round number and the wick-depth of recent tests, is a stop with a chance of only dying when the idea is actually dead.
- Budget for the spread and the wick. Gold spreads widen at news and at the daily rollover; a stop that is technically correct but two dollars too intimate will be executed by the spread alone. Add $1.50 to $2.00 of grace beyond wherever the chart says.
- Respect round numbers. The $25 and $50 increments, 3,300, 3,325, 3,350, act as magnets and battlegrounds. Entries directly at them are crowded; stops directly behind them are food.
- Use hard stops, in the platform. Mental stops on gold are a fiction. The move that was going to trigger your mental stop is the same move that freezes you. If your objection is that stops keep getting hunted, the answer is placement and size, not removal. We wrote up the full argument, including where hedging genuinely beats a stop and where it merely postpones the pain, in hedging versus stop losses.
And a structural point traders miss: on an instrument this wide, the stop distance is doing more of your risk management than the stop's cleverness. A mediocre level with a properly sized position outlives a brilliant level with a reckless one, every time. We would rather take a slightly worse entry at a quarter of the size than a perfect entry that needs the market's cooperation within the hour.
A drawdown on gold is rarely one bad trade. It is one bad sizing decision, photocopied.
Recovering a gold drawdown without doubling exposure
So the damage is done. The account is down 20%, 30%, or floating something worse. What now, concretely?
First, take an honest inventory, on paper, before touching a single position. Open positions and their floating losses. Realised balance versus equity. Margin level, and how far gold would need to move against you before the broker starts closing things on your behalf, because a margin call is the market taking over your risk management at the worst possible prices. Most traders in a hole have never actually written these numbers down; they have a dread-flavoured impression of them, which is not the same thing. The inventory takes fifteen minutes and it changes the conversation from "how do I win it back" to "what exactly am I managing", which is the conversation that has solutions.
Second, the arithmetic you have to look at rather than around. Recovery percentages are not symmetric with loss percentages:
| Drawdown | Gain needed to recover |
|---|---|
| 10% | 11% |
| 20% | 25% |
| 30% | 43% |
| 40% | 67% |
| 50% | 100% |
Every instinct in a drawdown argues for size, because size is the only thing that makes the hole close fast, and speed is what the wounded ego is actually shopping for. This is precisely backwards. The account that is down 30% has, by definition, just demonstrated that its recent risk decisions were miscalibrated for this market. Doubling the stake on a miscalibrated process is not recovery. It is the second half of the blow-up, and on gold the second half runs quicker than the first. The grid and martingale crowd have industrialised this mistake; we pulled apart why averaging into gold trends ends the way it does in our piece on grid trading's drawdown problem.
What actually works is slower and less cinematic:
- Stop the bleeding at a number, not a feeling. Close or cap anything whose loss, if it doubled from here, would threaten the account. On floating positions this is the hardest click in trading. Do it anyway, or cap it with a hedge you have an exit plan for, not a hedge that just freezes the corpse.
- Cut unit risk to half of normal. If you risked 2% before, you risk 1% until the equity curve makes a new high. This feels glacial. It is also how the compounding table above gets climbed without a second collapse: forty-three percent is reachable in months at 1% risk with an ordinary edge, and reachable never if you donate another 20% on the way.
- Trade fewer, better setups. In recovery you take the A-grade structure trades in the London and overlap sessions and you skip the Asian boredom trades entirely. Half the trades, the better half.
- Record a baseline and measure from it. Write down the equity today, and judge every week against that number, not against the old high. The old high is a memory. The baseline is a job.
That baseline habit is not incidental; it is literally how our own drawdown management service is built. For accounts floating roughly $5k to $10k down, we agree and record a baseline with the owner, trade the recovery on their own MT4 or MT5 account, and charge a flat 50% of recovered profit above that baseline. Nothing up front beyond the advance, no fee if we do not recover anything, and, said plainly because it must always be said plainly: no guarantees, ever. Fifty percent is a high fee, we know it, and it is priced that way because we only get paid on profit that did not exist before and the minimums are low. Anyone promising guaranteed recovery on a leveraged gold account is describing a product that cannot exist.
Our drawdown control rules for XAUUSD, published
Here is the framework we run on every account we touch. None of it is secret, because none of it works as a secret; it works as a habit.
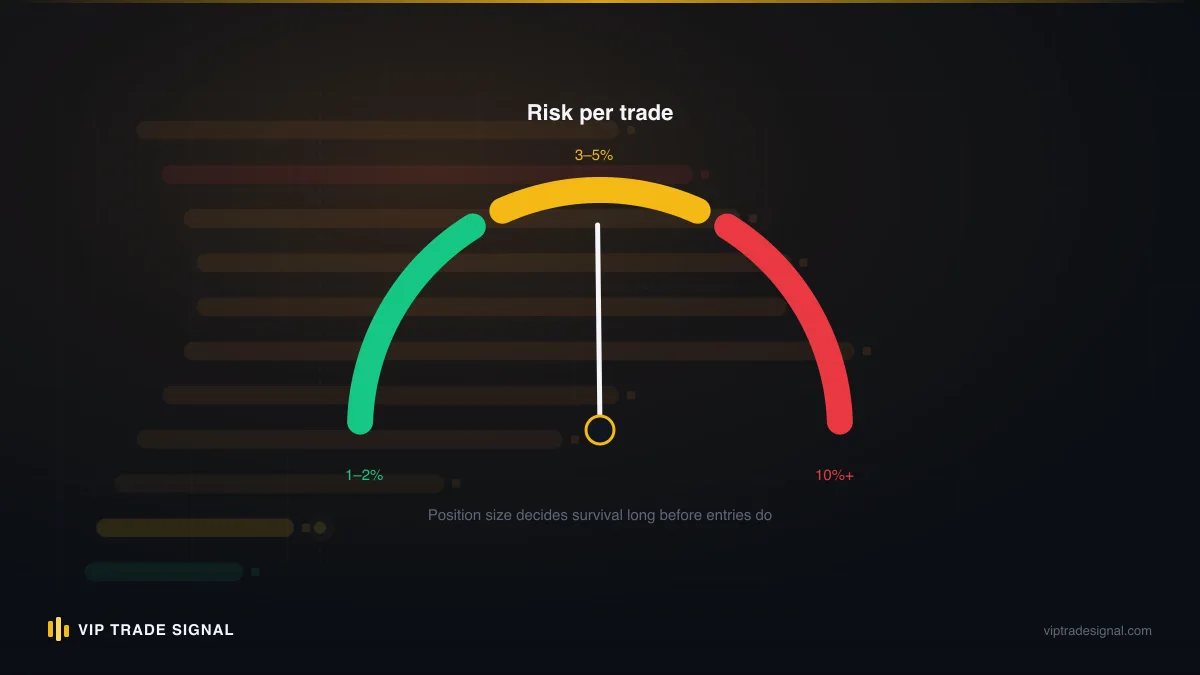
Rule 1: 1% per trade, sized from the chart's stop. The stop distance comes from structure plus wick-grace; the lot size is whatever makes that distance cost 1%. The lot size is the output of the process. It is never the input.
Rule 2: Daily circuit breaker at 3%. Two or three losers in a session and the platform closes for the day. Not because the fourth trade is doomed, but because the person choosing it is no longer the person who chose the first. Gold's speed makes this rule earn its keep more than any other; the worst gold days we have ever seen were single sessions, not slow bleeds.
Rule 3: Weekly stop at 6%, with a mandatory review. Hit it and nothing new opens until the week turns and the losing trades have been re-read sober. Half the time the review finds the process was fine and variance was variance. That finding matters just as much as finding a mistake, because it stops the destructive urge to redesign a working method mid-drawdown.
Rule 4: News windows are flat-or-small windows. No new positions in the fifteen minutes around CPI, NFP or FOMC, and existing positions either sized to absorb a $30 spike or trimmed until they are. Slippage through stops on these prints is real; the size must assume the stop fills badly.
Rule 5: No averaging into losers. Ever. Adds go on winners only, after structure confirms, with the combined position's stop still inside the daily risk budget. This single rule, applied retroactively, would have prevented the majority of the five-figure holes we have been hired to dig out.
Rule 6: One instrument, no correlation games. Easy for us, since gold is all we do, but it has a general point: a gold position plus a silver position plus a short-dollar position is one trade wearing three costumes, and it will draw down like one trade.
Rule 7: The drawdown itself scales the risk. When account equity is more than 5% below its high-water mark, per-trade risk halves automatically, and it stays halved until a new high prints. This is the rule traders resist hardest, because it feels like fighting with one hand tied exactly when you want to swing. That feeling is the point. The framework assumes, correctly, that judgement degrades under loss, and it takes size away from the degraded judgement without asking permission. When the curve recovers, full size returns on its own. No willpower required, which is fortunate, because willpower is precisely the resource a drawdown burns first.
Do these rules cost profit in the good weeks? Certainly. The circuit breaker has closed us out of afternoons that went on to be excellent. We regard that as the premium on an insurance policy that has, so far, kept every managed account out of the kind of hole that ends the story. You can run the same framework on a $500 account or a $50,000 one; the percentages do not care.
What a public win-and-loss history actually tells you
A brief word on why we keep banging on about published records, because it connects directly to drawdown control.
Most signal sellers show you a highlight reel. Screenshots of winners, monthly percentage claims, and a memory hole where the losing streaks should be. The tell is not the wins; anyone trading gold through a trending year has wins. The tell is the absence of clustered losses, because every real gold strategy has them. The metal's volatility guarantees it. A record with no visible drawdown is not evidence of skill. It is evidence of curation.
So we publish every closed signal, wins and losses, timestamped, at the signal history, and we would tell you to apply the same audit to us as to anyone: find the worst fortnight in the record and ask whether you could have sat through it at your size. That question, "could I survive this provider's worst stretch", is more useful than any win-rate figure, because your account does not experience a win rate. It experiences a sequence. A 70% win rate still delivers four losses in a row about once every hundred trades, and on gold, four properly-stopped losses is an entirely ordinary week somewhere in every quarter.
This is also why the signal service ships every entry with a stop and defined targets rather than "buy gold now" and a prayer. A signal's job is not just direction. It is giving you the numbers that make honest sizing possible before the trade, which is the only point at which drawdown control actually happens. Everything after entry is just finding out.
Where this leaves you
Strip everything above down to what you can do this week, and it is short.
Work out, in dollars, what a normal gold day does to your current size. Multiply your usual lot size by 250 platform pips and look at the number next to your account balance. If it is more than a few percent, your next drawdown is already scheduled; only the date is unknown.
Then rebuild the chain in the right order: chart chooses the stop, risk percentage chooses the lot, session and calendar choose the timing. Put the circuit breakers in writing where you can see them, because the version of you that needs them will not be in a mood to invent them. And if you are reading this from inside the hole rather than above it, floating thousands down, hedged into a corner, checking the chart at 2am, the way out is baseline-and-halve-the-risk, not double-and-hope. That is slow. It is also the only route we have ever seen work more than once, and it is the one we charge for only when it does.
Gold is the best instrument we know. It trends, it respects structure in its rough-handed way, and it pays traders who size for what it is. It just never, ever forgives being mistaken for a forex pair. Control the drawdown and the metal's mood swings become the opportunity. Fail to, and they become the story you tell about why you stopped trading.