There is a number every losing trader eventually goes looking for, usually late at night, usually after refusing to look at the account for a few days. The account is down some amount. The question is simple: how much do I need to make to get back to where I started?
Almost everyone gets the answer wrong the first time they guess. Down 25%? Most people say you need 25% back. You don't. You need 33.3%. Down half? You need to double what's left. The percentage gain needed to recover a loss is always bigger than the loss itself, and the gap between the two grows in a way that is gentle at first and then genuinely vicious. That asymmetry between losses and gains is, in my opinion, the single most important piece of arithmetic in trading. Not the most complicated. The most important.
This article is the reference version of that arithmetic. You'll get the formula in one line, the complete table from a 1% loss to a 90% loss, a slow walk through the case everybody quotes but few actually sit with (why a 50% loss needs a 100% gain), and then the part most articles skip: what the shape of that curve should do to your trading rules before you're ever underwater. Because the table isn't really about recovery. It's about prevention. By the end I want you to see it the way we do on the desk: as the strongest argument for cutting losses early that has ever been printed.
The question every underwater trader eventually asks
Let me describe a trader we'll call Sam, because I've met a hundred of him and been him once myself.
Sam opened a $5,000 account to trade gold. He did well for six weeks, poorly for two, then had one bad Thursday around a US inflation print where he averaged into a falling long three times. The account now shows $3,100. Sam has done the subtraction: he's down $1,900, which is 38%. And here is where Sam's brain quietly betrays him. He thinks, more or less: I made 15% in a good month before, so 38% back is maybe three good months. Hard, but fine.
Except 38% back is not what Sam needs. Gains don't apply to the money you lost. They apply to the money you have left. Sam's future returns will be earned on $3,100, not $5,000, and to climb from $3,100 back to $5,000 he needs a gain of $1,900 on a base of $3,100. That's 61.3%. Not 38%. His three hard months just became six or eight, assuming nothing else goes wrong, which is an assumption that has ended more accounts than any single trade ever has.
That gap between the loss you took and the gain you need is not a technicality. It's the tax the market charges you for being wrong, and the rate goes up the deeper you go. Small losses are cheap to fix. A 5% drawdown needs 5.26% back, a rounding error's worth of extra work. But the relationship isn't a straight line, and traders who treat it like one make catastrophically bad decisions when they're deep underwater, because they price the climb back using intuition built on shallow water.
The maddening part is that nobody discovers this at the right time. You discover it after the loss, when the information can only depress you, rather than before, when it could have set your stop. So consider this article an attempt to move the discovery earlier. Read the table today, while your account is whole, and let it argue with you about how much you're willing to lose.
The one-line formula
Here is the whole engine of this article, and it fits in one line:
Required gain = loss ÷ (1 − loss)
Where the loss is expressed as a decimal. Lose 20%? That's 0.20 ÷ 0.80 = 0.25, so you need a 25% gain. Lose 60%? 0.60 ÷ 0.40 = 1.50, a 150% gain. That's it. No spreadsheet required, though you'll want the table below anyway because nobody does division at 2 a.m. when they most need the answer.
Why does the formula work? Take an account that starts at some value, call it 100 for convenience. After a loss of L (as a decimal), you're holding 100 × (1 − L). To get back to 100, whatever gain G you earn must satisfy:
(1 − L) × (1 + G) = 1
Solve for G and you get G = L ÷ (1 − L). The denominator is doing all the damage. As your loss grows, the base you have left to grow from shrinks, so every percentage point of recovery has to be earned on a smaller pile. At a 10% loss the denominator is 0.90 and barely matters. At a 75% loss the denominator is 0.25, and dividing by a quarter multiplies by four. Same numerator, four times the required gain.
A quick sanity check you can do in your head: the required gain always exceeds the loss, and the two are only close when the loss is small. At 1% down you need 1.01% back. Practically symmetrical. At 50% down you need 100% back, double. At 90% down you need 900% back, ten times the loss. The multiplier itself, 1 ÷ (1 − L), is worth knowing: it's how many times your remaining equity must be multiplied to get home. Down 50%, multiply by 2. Down 80%, multiply by 5. Down 90%, multiply by 10. When you frame a 90% drawdown as "I need to 10x this account just to break even", the situation stops sounding like a rough patch and starts sounding like what it is.
One more framing before the table, because it helps some people more than the algebra does. Losses and gains in trading are multiplicative, not additive. A 30% loss followed by a 30% gain is not zero; it's 0.70 × 1.30 = 0.91, still 9% down. Percentages don't cancel. They compound, and they compound against you on the way back up. Anyone who has held a losing position "because it'll come back" is implicitly betting against this arithmetic, usually without knowing it.
The full table: percentage gain needed to recover a loss from 1% to 90%
Here it is. Bookmark this section or print it, whatever gets it in front of you when it matters. Every figure is the gain required on your remaining equity to return to your starting balance.
| Loss | Gain needed to break even | Multiplier on remaining equity |
|---|---|---|
| 1% | 1.01% | 1.01x |
| 2% | 2.04% | 1.02x |
| 3% | 3.09% | 1.03x |
| 5% | 5.26% | 1.05x |
| 8% | 8.70% | 1.09x |
| 10% | 11.11% | 1.11x |
| 12% | 13.64% | 1.14x |
| 15% | 17.65% | 1.18x |
| 20% | 25.00% | 1.25x |
| 25% | 33.33% | 1.33x |
| 30% | 42.86% | 1.43x |
| 35% | 53.85% | 1.54x |
| 40% | 66.67% | 1.67x |
| 45% | 81.82% | 1.82x |
| 50% | 100.00% | 2.00x |
| 55% | 122.22% | 2.22x |
| 60% | 150.00% | 2.50x |
| 65% | 185.71% | 2.86x |
| 70% | 233.33% | 3.33x |
| 75% | 300.00% | 4.00x |
| 80% | 400.00% | 5.00x |
| 85% | 566.67% | 6.67x |
| 90% | 900.00% | 10.00x |
Spend a minute on the shape, not just the individual rows. From 1% to 10%, loss and required gain are nearly twins; the penalty for being down 10% is barely one extra percentage point of work. From 10% to 20% the gap opens but stays civilised: a 20% loss costs you 25% of climbing. Then the curve starts to lean. By 30% you owe nearly 43%. By 40% you owe two-thirds of your remaining account. And past 50% the numbers stop describing trading and start describing miracles: 300% at three-quarters down, 900% at nine-tenths.
Three rows deserve stars next to them. The 20% row, because 25% is roughly the boundary of what a skilled discretionary trader can realistically earn back inside a year without inflating risk. The 50% row, because "double what's left" is the phrase that finally lands for most people. And the 90% row, because 900% is the honest answer to "should I keep trading this account or start over", and the honest answer is usually start over, with smaller risk and better rules.
Why the curve bends: the shrinking-base effect
The table's cruelty comes from one mechanism, and it's worth understanding properly rather than just memorising rows, because the mechanism generalises to everything else in your trading.
When you lose money, two things happen at once. The obvious one: your equity drops. The sneaky one: the base on which all your future percentage returns will be calculated drops by exactly the same amount. Your losses are measured against the old, bigger account. Your recovery is earned on the new, smaller one. The percentage system is quietly using two different denominators, and both choices go against you.
Picture it as stacked bars. Start with a $10,000 account drawn as a full bar. A 40% loss removes $4,000, leaving a $6,000 bar. Now, to recover, you're not filling the gap with returns on the original bar; you're growing the short bar. Every 10% gain on $6,000 adds $600, not $1,000. The gap you have to fill was measured in old dollars, but you're earning new, smaller dollars. Six hundred at a time, you need nearly seven of those 10% months, compounded, to refill a hole that took one bad week to dig.
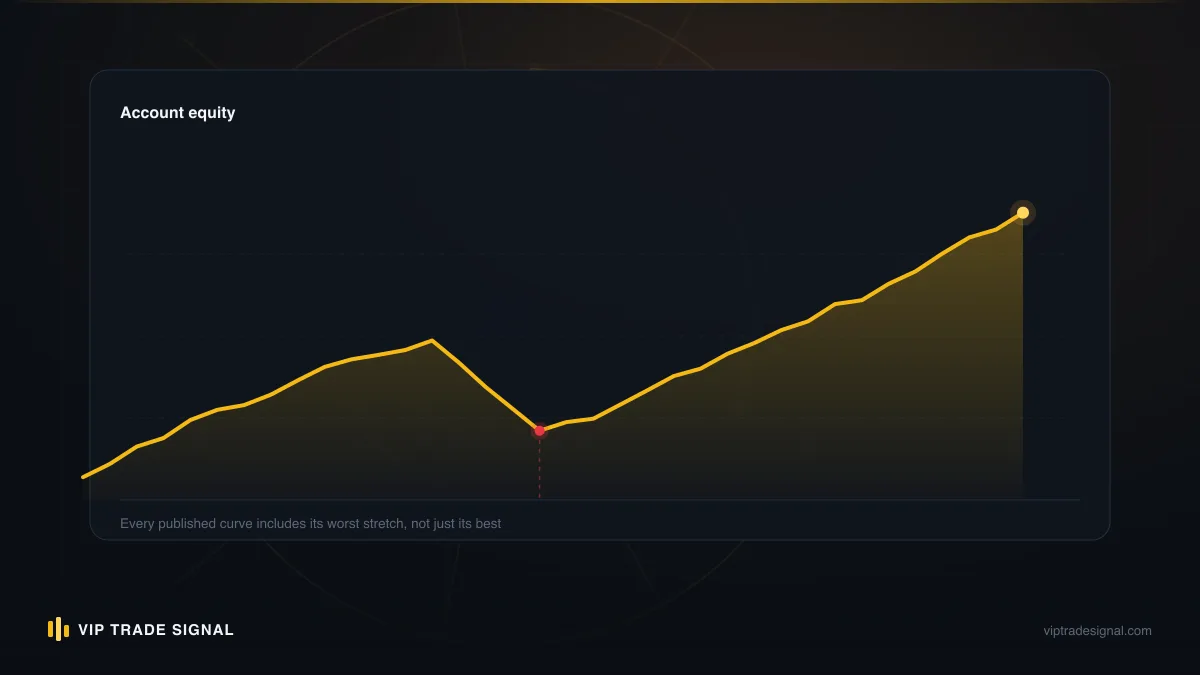
This is why the curve is convex rather than straight. In the shallow region the base is nearly intact, so the two denominators nearly agree and the penalty is small. As the loss deepens, the recovery base shrinks toward zero while the gap stays fixed in dollar terms, so the required percentage growth blows up. Mathematically it's a hyperbola with a wall at 100%: as your loss approaches everything, the gain needed to recover approaches infinity, which is just the algebra's way of saying that dead accounts don't come back.
I find the dollar framing does more work than the percentage framing for most traders, so let me hammer it once more with Sam's numbers. Sam is at $3,100 needing $5,000. Suppose Sam is genuinely good and averages 4% a month on equity, which over a full year, through news weeks and dead weeks and the occasional stopped-out streak, is a strong result on a real account. Month one earns him $124. Month two, about $129. He is trying to shovel $1,900 of old money with a spade that scoops $125 of new money at a time and only grows slowly. Compounding at 4% monthly, Sam needs about a year to get back to flat. A year of good, disciplined trading, and the reward at the end of it is the account he already had last spring. That's the shrinking-base effect measured in the only unit that matters, which is months of your life.
And notice what it does to psychology. A trader staring at a 43%-required-gain figure is a trader tempted to double risk to shorten the climb. The arithmetic that punished him for losing now baits him into the exact behaviour most likely to deepen the loss. The curve doesn't just describe the hole. It hands you a bigger spade and points at the bottom.
Why a 50% loss needs a 100% gain, worked slowly
The 50/100 pairing is the most quoted line in all of risk management, and it's usually quoted at speed, as a slogan. Slogans slide off. So let's do it slowly, once, with real numbers, so it sticks.
You have $10,000. You lose 50%. What actually happened: $5,000 left your account. You now hold $5,000. The loss was calculated on the original ten. Fine so far.
Now you want your $10,000 back. The missing money is $5,000. The money you have to work with is also $5,000. So the gain you need, expressed the only way gains can be expressed, as a percentage of what you currently hold, is $5,000 ÷ $5,000 = 100%. You must double your remaining equity. Not because of any market mechanism, not because of spreads or swaps or your broker's feelings, but because of pure arithmetic: half of the big number is all of the small number.
Now put that doubling in context. Ask any honest trader how long it takes to double an account with sane risk. At 5% a month compounded, which very few people sustain across a full year, doubling takes about 14 months. At a more defensible 3% a month it takes nearly two years. So a 50% drawdown, which can happen to an over-leveraged gold account in a single violent week (we watched accounts do exactly that during the 2024-25 rallies, in both directions), quietly costs the trader one to two years of excellent performance just to get back to zero progress. Zero. All that skill and patience spent arriving at the place you started.
Half of the big number is all of the small number. That sentence is the entire science of drawdown, and most traders learn it with rent money.
There's a second thing hiding in the worked example that people miss. After the 50% loss, every future percentage you earn is worth half as many dollars as the same percentage was before. Your 2% winning day used to pay $200; now it pays $100. But if you keep position sizes the same as before the drawdown, and plenty of tilted traders do exactly that, your losses stay full-sized in dollars while your account is half-sized. You are, without having changed a single setting, trading at double your intended risk. The loss didn't just take your money. It silently doubled your leverage. This is why the first move after any serious drawdown must be cutting position size to match the new equity, and why not doing so is how 50% drawdowns become 80% ones.
What the table says about your maximum acceptable drawdown
Here's where the reference table turns into policy. Most traders pick their maximum drawdown limit by feel, if they pick one at all. The table lets you pick it by arithmetic, and the arithmetic has a clear opinion.
Look at the curve in three zones. Below 20% loss, the recovery premium (the gap between loss and required gain) is under five percentage points. Annoying, recoverable, the ordinary cost of doing business in a leveraged market. Between 20% and 40%, the premium grows from 5 points to 27 points, and required gains of 25% to 67% start colliding with what real traders actually earn in real years. Past 40%, the premium explodes, and the required gains stop being trading targets and become lottery tickets.
So the table's advice, translated into a rule: your hard maximum drawdown, the number where you stop trading and reassess everything, should live somewhere in the 15% to 25% band, and I'd argue for the lower half of it. Not because losing 30% is immoral, but because the arithmetic on the far side of 30% is so hostile that your expected path back leads through either years of grinding or one desperate, oversized bet. Neither is a plan. A trader who hard-stops at 15% never needs more than 17.65% to fully recover, and 17.65% is a demanding but honest annual target. A trader who lets it ride to 45% needs 81.82%, and 82% years are the kind of thing marketing pages promise and audit trails never show.
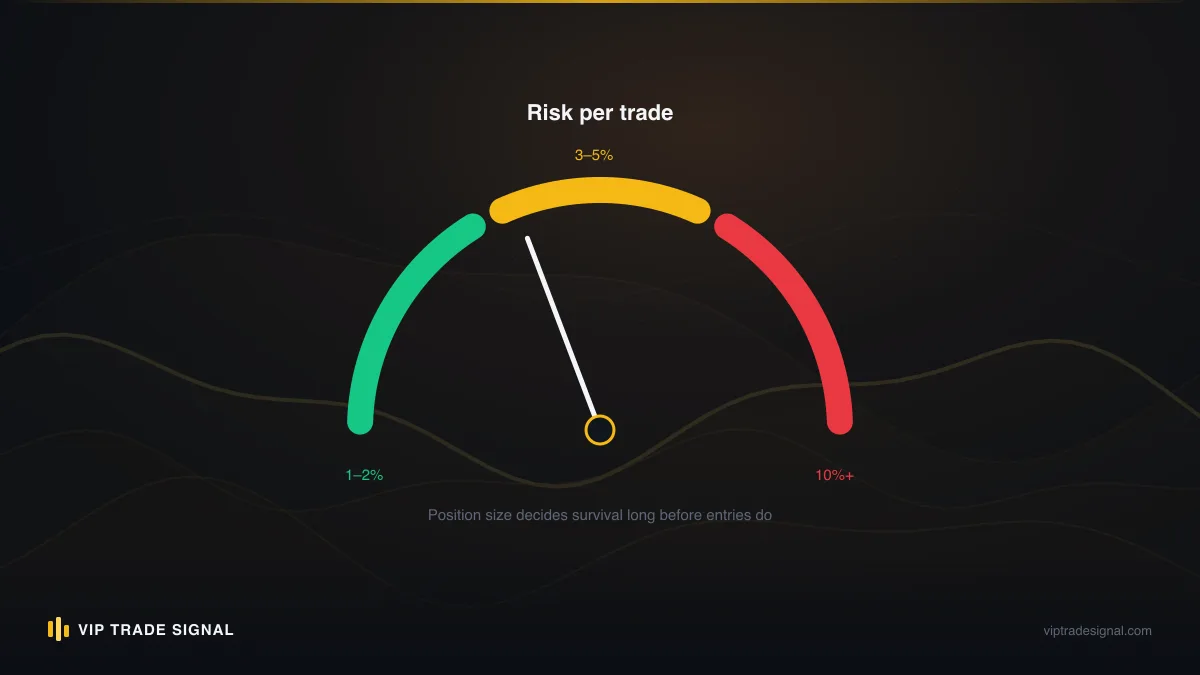
Notice, too, how this reframes per-trade risk. If your account-level line in the sand is 15%, and you risk 1% per trade, you can absorb roughly 15 consecutive full losses (a touch more, since each 1% is taken on a shrinking base) before hitting the line. Fifteen straight stop-outs is rare even in a genuinely bad patch, so the system has headroom. Risk 3% per trade and five bad trades put you at the line. Five losing trades in a row is not rare. It's a normal fortnight in a choppy gold market. Your per-trade risk and your maximum drawdown aren't separate settings; the recovery table is the exchange rate between them.
This zone logic is also exactly why our own drawdown desk draws its intake line where it does. The drawdown management service exists for accounts floating roughly $5k-$10k underwater, typically 30-60% down, precisely because that's the region where the required gain has outgrown what a tilted, exhausted account owner can realistically execute alone, but hasn't yet crossed into the territory where starting over is plainly the better trade. We charge a flat 50% of whatever profit is recovered above a baseline we record together at the start, and we say in writing what I'll say here: no recovery is guaranteed, ever, because the same table that measures the climb doesn't care who's climbing. Some accounts arrive too deep. The honest answer for a 90%-down account is almost never "recover it".
The time dimension: required gain at realistic monthly returns
Percentages hide time, and time is the currency you actually spend. So let's convert the table into months, using compounded monthly returns a real, disciplined trader might sustain. I'll use 2%, 3% and 5% a month. If those look low next to what social media promises, good; that means your instincts are still calibrated to marketing rather than to broker statements. Sustained 5% monthly, compounded across years, is elite.
| Loss | Months to recover at 2%/mo | At 3%/mo | At 5%/mo |
|---|---|---|---|
| 10% | 5.3 | 3.6 | 2.2 |
| 20% | 11.3 | 7.5 | 4.6 |
| 30% | 18.0 | 12.1 | 7.3 |
| 40% | 25.8 | 17.3 | 10.5 |
| 50% | 35.0 | 23.4 | 14.2 |
| 60% | 46.3 | 31.0 | 18.8 |
| 70% | 60.8 | 40.7 | 24.7 |
| 80% | 81.3 | 54.4 | 33.0 |
| 90% | 116.3 | 77.9 | 47.2 |
Read the 3% column, since 3% a month is a genuinely strong, sustainable figure for a careful trader. A 20% drawdown costs about seven and a half months. Sobering, survivable. A 50% drawdown costs almost two years. A 70% drawdown costs three and a half years, and a 90% drawdown costs six and a half years of uninterrupted, above-average performance with zero further setbacks along the way, an assumption so heroic it disproves itself. Nobody compounds 3% monthly for 78 straight months without a losing stretch. The table's deep rows aren't really recovery estimates. They're formal proofs that recovery, in any practical sense, is off the table.
The time view also exposes the most dangerous thought in trading, which arrives on schedule around the 40% mark: "at this rate it'll take years, so I need a faster rate." And so the trader who was risking 1% starts risking 5%, or removes stops, or martingales into a trend, because the slow arithmetic feels unbearable and the fast arithmetic hasn't hurt him yet. Here's the thing though. The required gain is fixed by the table, but the required time is only fixed if your edge is. Doubling risk without doubling edge doesn't halve the recovery time; it roughly doubles the variance, which mostly means it halves the account again. Every deep drawdown we've ever been handed at the desk had this move somewhere in its history. Not the initial loss. The acceleration after it.
If you want to see how this plays out specifically in gold, where daily ranges of $30-60 make both the digging and the climbing faster than in most FX pairs, we've written up the mechanics separately in our piece on gold trading drawdowns. The metal is not more dangerous than anything else at equal position size. But nobody trades it at equal position size, and the recovery table doesn't grade on a curve.
How the asymmetry compounds across drawdown cycles
One drawdown is arithmetic. A trading career is a sequence of them, and the sequence is where the asymmetry does its deepest damage, because recovery premiums don't take turns. They stack.
Run a simple sequence. A trader takes a 15% drawdown, fully recovers (that cost 17.65%), then later takes another 15%, recovers again (another 17.65%), then a third. Across the three cycles, 45 points of losses demanded about 53 points of gains, and the account went precisely nowhere. Eight extra points of pure friction, paid to the arithmetic, on top of spreads, swaps and everything else. Over a decade of trading, this friction is a real cost centre that never appears on any statement.
Now run the uglier version, where recovery doesn't complete between hits. Three 15% drawdowns in succession, no recovery between them: 0.85 × 0.85 × 0.85 = 0.614. The account is down 38.6%, and the required gain is now 62.8%. Compare that with the 17.65% each drawdown would have cost individually. The whole is much worse than the sum of its parts, because each new loss was carved from an already-shrunken base and pushed the account further along the steep part of the curve. Drawdowns are convex in sequence. Two moderate losses back-to-back put you in worse shape than their sum suggests, and the third one puts you somewhere the table describes in triple digits.
This is why "it's only another 10%" is such a lethal sentence at the bottom of a losing streak. From flat, a 10% loss needs 11.1% back. From 40% down, losing "another 10%" of the original stake takes you to 50% down, and moves your required gain from 66.7% to 100%. The same ten points cost 11 points of recovery at the top of the curve and 33 extra points at the bottom. Late losses are more expensive than early ones. Considerably more. Which inverts how most people instinctively defend an account: they fight hardest at the start of a drawdown, when losses are cheap, and loosen up at the bottom, when every additional point is gold-plated.
Systems that structurally accumulate open losses, and grid or martingale EAs are the canonical example, are effectively machines for sliding down this curve in one motion; we've pulled that apart in detail in our breakdown of grid trading drawdown risk. And an account locked up with opposing hedged positions has its own strange version of the problem, where the drawdown is frozen mid-curve rather than realised; that mess gets its own treatment in the hedged account rescue piece.
The inverted lesson: this table is why you cut early
Everything so far has treated the table as a map of the way back. Now flip it over, because its real value points forward.
Every row of the table is also a price list for hesitation. When your gold long is 1% of equity underwater and your stop says out, the cost of obeying is a 1.01% climb. Trivial. When you've widened the stop twice and you're 8% down, obedience now buys you an 8.7% climb. When you've turned a trade into a "position" and a position into a "view" and you're 30% down, the exit you refused at 1% now costs 42.86% to undo. The market never forced any of this. Each step down the table was a decision, and the table prices every decision with complete indifference.
Which means the famous old instruction, cut your losses early, isn't a proverb. It's a corollary. Cutting at 1% instead of 10% doesn't save you 9 points; it saves you the difference between a 1.01% recovery and an 11.11% one, plus the outsized psychological tax of trading underwater, plus the position-sizing distortion we covered earlier, plus your place on the gentle part of the curve should the next loss arrive immediately. Early exits are cheap because the curve is flat where they live. Late exits are ruinous because the curve is steep where they live. That's the entire case, and it's airtight in a way that trading advice almost never is.
I'd go further. If you only ever internalise one quantitative idea from this entire blog, make it this one, ahead of expectancy, ahead of win rates, ahead of any entry technique. A trader with a mediocre entry method and a fanatical devotion to small losses will still be trading in five years. A trader with a brilliant entry method who lets losers run will eventually feed one account, or several, to the steep end of this table. We publish every closed signal, winners and losers alike, and the losing ones share a property: they're small, because the stop was decided before entry and honoured after it. That's not a virtue we invented. It's just what the table demands of anyone who intends to stay solvent.
There's an emotional version of this worth saying plainly. The moment you most need to cut is the moment cutting feels most like failure, and the moment holding feels most like courage. The table is the antidote to that feeling, because it converts the courage into a number. Holding a loser from 5% to 15% isn't brave. It's paying 12.4 extra points of recovery for the privilege of not admitting a mistake for another week. Written down like that, most people wouldn't take the deal. So write it down.
Printing the table, and using it as a risk anchor
A reference you don't look at is decoration. Here's how to actually wire this table into your trading, step by step, none of it requiring software.
- Print the table. Physically. Stick it next to your screen, at eye level, where MT5 can't cover it. The point of paper is that it's visible during the exact moments you'd never voluntarily open an article like this one.
- Circle your line. Pick your maximum acceptable drawdown from the 15-25% band and circle that row. That circle is now a standing order to your future self: at this row, all positions close, size gets recalculated, and no new trade opens for at least a week. Decide it today, while you're calm, because the person who reaches that row will not be calm and should not be trusted with the decision.
- Translate it into trades. Divide your circled drawdown by your per-trade risk to see how many consecutive losses your system can absorb. If the answer is under 10, your per-trade risk is too big for your line. Fix whichever one is honest to fix.
- Re-anchor after every losing week. Find your current drawdown row and read the required gain out loud. If you're 12% down, say "I need 13.6% on what's left". This tiny ritual keeps your recovery expectations sane and, more importantly, keeps the double-the-risk demon priced.
- Resize on the way down. After any 10%+ drawdown, recalculate lot sizes from current equity, not starting equity. This is the single mechanical habit that stops moderate drawdowns metastasising, and it's the one tilted traders skip first.
- Know your handover point. Decide now, in advance, at what row you'd stop self-rescuing and either close the account or bring in help. If you'd rather not decide alone, our FAQ sets out how the drawdown desk assesses whether an account is realistically recoverable, and what a flat 50%-of-recovery arrangement looks like when it is; the short version is that we'd rather tell a 90%-down trader to start fresh than take a fee for climbing a wall the table says is unclimbable.
One habit I'd add on top, from years of watching this go wrong: check your drawdown weekly even when things are fine, especially when things are fine. Drawdown limits fail not because traders can't do arithmetic but because they stop looking at the number that would trigger the rule. The trader who knows he's 14% down while his line is 15% behaves completely differently from the trader who "hasn't checked in a while" and is quietly at 22%. Measurement is most of discipline.
Where this leaves you
The table you've just read is about as close to a law of physics as trading gets. Edges decay, correlations break, and every strategy has a market that humiliates it, but loss ÷ (1 − loss) will be exactly as true in thirty years as it is tonight, for every account, in every instrument, at every broker. You can't out-trade it, and you certainly can't negotiate with it. You can only decide, in advance, how far down its steep section you're ever willing to be.
So decide. Right now, before the next trade: what is your number? Not a vague intention, an actual row of the table with a circle around it and consequences attached. If you're reading this with a healthy account, you have the rare luxury of choosing your maximum drawdown while it's still hypothetical, and I'd genuinely rather you take that from this article than any signal we'll ever send. And if you're reading it the other way, already deep in the table's ugly rows with a gold account that got away from you, then be honest with the arithmetic before you're ambitious with the trading: work out your actual required gain, put a realistic monthly return under it, and see how many months you're really proposing to climb. If the answer is a number of years you can say with a straight face, climb carefully, at reduced size, with the table on the wall. If it isn't, the bravest trade available is a closed account and a smaller, better-run new one, and no table anywhere prices bravery at zero.
Losses are normal. Everyone on our desk has taken plenty and will take plenty more. What separates the traders still here from the ones who aren't was never the losing. It was which row of this table they were standing on when they finally stopped.